Journal of Financial Planning: March 2022
Executive Summary
- Some retiree asset allocation decisions may be based on projections made using long-term historical average returns of the different asset categories. With stock and bond returns at their long-term averages, a 4 percent initial withdrawal rate over a 30-year retirement was a possibility even for conservative investors with portfolios heavily weighted toward bonds. This pleasant picture changes dramatically when the current bond environment is considered.
- After spending much of 2020 below 1 percent, 10-year U.S. Treasury yields have increased to about 1.6 percent as of May 2021, still far below their long-term average. With inflation averaging 2 percent and possibly headed higher, bonds are providing negative real returns for retirees in need of safe cash flows. In addition, if bond yields do climb back up to their long-term averages, retirees holding bonds will be hit with significant capital losses along the way.
- Rather than assuming that bond rates and inflation will return to normal over five or 10 years, as some other papers have done, this analysis considered scenarios where rates return to normal over five, 10, 15, 20, 25, 30 years, or never. While a quick recovery for interest rates would mean large upfront capital losses for new retirees, failure rates for portfolios heavily weighted with bonds peak if rates recover in about 15 years.
- This study found that post-retirement glide path choices that would have worked in the past are no longer safe investment choices in this environment. With a 20–80 stock–bond mix, a 4 percent withdrawal rate over 30 years is simply not a viable option. Even with lower withdrawal rates and/or shorter retirement horizons, retirees are best served with decreasing glide paths that boost their early allocation to stock. Decreasing glide path options result in lower failure rates across the different portfolio equity levels, but the higher the allocation to stock, the less the choice of glide path matters.
Doug Waggle is a professor of finance in the College of Business at the University of West Florida. He teaches courses in financial planning and investments. He earned his Ph.D. in finance from the University of Alabama and his MBA from the University of Southern Mississippi.
Gisung Moon is an associate professor of finance in the Turner College of Business at Columbus State University in Georgia, where he teaches undergraduate and graduate courses in corporate finance. He earned his MBA and Ph.D. in finance from the University of Missouri.
Hongbok Lee is a professor of finance in the College of Business and Technology at Western Illinois University. He teaches courses in investments and financial management. He earned his Ph.D. in finance from the University of Missouri and his master’s in economics from the University of Illinois at Urbana-Champaign.
Click on the Figures and Table below for PDF versions.
JOIN THE DISCUSSION: Discuss this article with fellow FPA Members through FPA's Knowledge Circles.
FEEDBACK: If you have any questions or comments on this article, please contact the editor HERE.
Bond yields in the United States remain near historic lows, with annual yields on 10-year United States Treasury bonds at about 1.6 percent in May 2021 (up from below 1.0 percent for most of 2020). This is nowhere close to the 1970–2020 average bond yield of 6.2 percent. The situation looks even worse in real terms, with inflation-adjusted yields for most of 2020 in negative territory compared to the longer-term average of about 2.4 percent. If bond yields stay at current levels and inflation runs at the Federal Reserve’s soft target of about 2 percent, real bond yields will continue in negative territory.
Much of the total returns provided by bonds since the early 1980s, when 10-year Treasury bond rates topped out at over 15 percent during a period of high inflation, have been from capital gains. As market interest rates fell over time, values of those long-term bonds rose. At today’s bond yields, however, it is mathematically impossible for this trend to continue. Rates simply do not have enough room to fall for bonds to continue their historical capital gains performance.
Retirees holding long-term bonds in their portfolios right now are faced with low bond yields, an end to the generous capital gains previously generated by bonds, and the very real possibility of capital losses. Low bond yields obviously do not provide much in the way of current income for investors who are in the time of life where they need it most. If those yields do move back up toward their long-term averages, bond investors will incur significant capital losses. A simple example illustrates the existing capital loss potential of bonds. If yields on 10-year U.S. Treasuries were to suddenly jump from 1.6 percent to their long-term historical average of 6.2 percent, bond investors would suffer a capital loss of nearly 35 percent. The scary part is that this loss potential is from the “safer” asset in a typical stock–bond portfolio. Of course, it is highly unlikely that yields would rebound in such dramatic fashion, but even if the return to historic yields is spread out over a longer period of time, the capital losses will still be there.
No one knows how long it will take for bond yields to return to their long-term averages. An inflationary shock could lead to a quick rise in rates, or this convergence could take much longer, or not occur at all in the investment horizons of most current retirees. Inflation has been a hot topic since the country emerged from the first wave of the COVID-19 pandemic. The Consumer Price Index was up 5.4 percent in July 2021 compared to the previous year, but the Federal Reserve believes the inflation effects will be transitory in nature. There has also been considerable pressure on wages as businesses attempt to meet increased demand. In addition, the federal government has spent trillions on stimulus related to the coronavirus, with the possibility of trillions more. As of this writing, bond yields still remain stubbornly low, but factors such as these could ultimately trigger an increase.
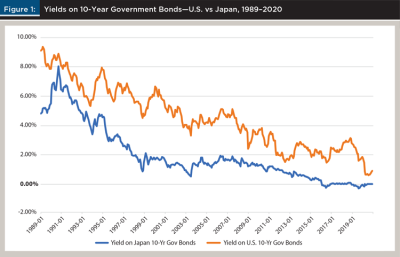
Current bond yields have been shown to predict 10-year bond total returns by works such as Finke, Pfau, and Blanchett (2013) and Blanchett, Finke, and Pfau (2013b), so if yields are still low 10 years from now, the best guess would be for 10 more years of the same. Consider, for example, the case of Japanese bond yields. As shown in Figure 1, yields on 10-year Japanese government bonds first dropped below 2 percent in 1997 and have stayed there ever since. Far from bouncing back from this low level, yields have fallen even further in recent years. The average yield from 2016 through 2020 was actually –0.01 percent. That is in nominal, not real, terms. While the Federal Reserve has not expressed an appetite for negative interest rates in the United States, this anomaly has surfaced in Japan and other economies. This is not to suggest that the economic situation in the United States and Japan are related, but just to point out that the potential for periods of sustained low interest rates exists.
The current low-bond-yield environment is particularly bad for new retirees because of the high level of sequence risk it imposes. Significant losses early in retirement are the most difficult for retirees to weather, increasing the odds of a withdrawal rate plan failure. See, for example, Frank, Mitchell, and Blanchett (2011), which compares withdrawal rates in good and bad market sequences. A 20 percent drop in portfolio value in the early years of retirement might be devastating, while the same 20 percent drop later in retirement, after years of compounding, might have much less effect. If bond yields quickly return to their historic averages, retirees will be able to earn higher yields sooner, but this would be after facing large upfront capital losses when they can least afford to do so. On the other hand, a slow return to historic averages would mean a lingering period of low yields and sustained, but smaller, capital losses over time.
While retirees and their financial planners know that rising interest rates will be bad for bonds in the short run, this paper added value by examining multiple scenarios for bond yields and inflation returning to their historical averages. Since the interest rate environment is uncertain, different scenarios with bond yields and inflation returning to their historic averages over five, 10, 15, 20, 25, and 30 years were simulated. Another scenario with bonds yields staying at the current low levels indefinitely was also included—maybe this really is the new normal. It is not readily apparent how these different scenarios would affect retirees. A quick return to historical rates, for example, would mean high upfront capital losses, but then favorable bond yield after that. The multiple interest rate scenarios are a key difference between this paper and other works that have considered the low-interest-rate environment, such as Finke et al. (2013); Blanchett, Finke, and Pfau (2013a); Blanchett et al. (2013b); and Blanchett (2015b).
This paper simulated failure rates for different stock–bond portfolio allocations with selected initial retirement withdrawal rates and nine different glide path options assuming bond yields and inflation rates noisily drift back to normal over the different time periods noted above. Failure rates are the percentage of times that simulations show that a retiree would run out of money before the end of their planned retirement period under the different scenarios. The failure rates of these options were also compared to expectations based on long-term historical averages to point out potential cases where investor guidance might need to be changed.
Glide paths are planned changes in the portfolio’s stock–bond allocations over time. A decreasing glide path, for example, might have the retiree’s allocation to stock decreasing from 80 percent to 40 percent over a 30-year retirement. How the various glide path options perform under the different interest rate scenarios is of particular interest. Glide paths that were viable under normal circumstances might not be desirable choices in a low-interest-rate environment. The different glide path options considered in this paper were based on Blanchett (2015a) and consisted of stock allocations that were fixed, increasing over time, decreasing over time, increasing before decreasing, and decreasing before increasing.
Literature Review
Maximum safe initial withdrawal rates for retirement portfolios have been widely addressed in the literature ever since Bengen (1994) developed the 4 percent rule, but there is still a divergence of opinions on the matter. This issue is particularly relevant given the low-interest-rate environment faced by retirees today. Finke et al.’s (2013) paper is titled ‘The 4 Percent Rule Is Not Safe in a Low-Yield World,” and that sums up their conclusions. Finke et al. assumed that both bonds and stock started from low real rates before returning to their long-term averages over either five or 10 years. With a portfolio of 30 percent stock and a 30-year retirement period, the failure rates for reversion to the mean in five years and 10 years were 22 percent and 43 percent, respectively. For portfolios composed of 50 and 70 percent stock, the outlook was not a lot better. The best-case scenario for reversion to the mean in five years was an 18 percent failure rate, while the best case with reversion to the mean in 10 years was a 32 percent failure rate. Finke et al. (2013) found that if real rates stayed at those initial real rates for the full 30-year retirement period, failure rates ranged from 46 percent with 70 percent stock to 77 percent with 30 percent stock. This paper, on the other hand, did not assume low initial stock returns and found that better success rates are possible both with high stock allocations and if interest rates remain permanently low.
Blanchett et al. (2013a) looked at the interaction between the cyclically adjusted price-to-earnings (CAPE) ratio and bond yields. While the regular PE ratio is simply the current stock price divided by the prior year’s earnings per share (EPS), the CAPE ratio, also known as the Shiller PE ratio, uses the average of the prior 10 years of EPS figures. The historical EPS numbers used in the CAPE ratio are adjusted for inflation to put them all in terms of current dollars. Blanchett et al. found that lower initial bond yields and higher CAPE ratios led to higher probabilities of failure. At an initial bond yield of 1 percent with a CAPE of 15 (roughly the long-term average), a portfolio of 80 percent equity had nearly a 30 percent chance of failure assuming a 4 percent withdrawal rate over a 30-year retirement. At a 2 percent initial bond yield, the failure rate dropped only about one percent. Results with equity allocations of 60 percent and 80 percent were very close to each other, but the failure rates increased considerably as the equity allocation decreased to 40 percent and then 20 percent. Pfau (2011) found that the current dividend yield, another measure related to stock market valuation, was an important predictor in determining maximum safe withdrawal rates.
Blanchett et al. (2013b) also specifically addressed the issue of low bond yields and safe portfolio withdrawal rates. Their paper assumed that bond yields began from an initial “seed” value of 2.5 percent and slowly drifted back to normal levels in about 10 years. For stock allocations of 20, 40, 60, and 80 percent and 30-year retirement periods, their results showed a 90 percent chance of success (10 percent failure rate) for initial withdrawal rates in a narrow range of just 2.6 percent to 2.8 percent. These withdrawal rates were well below the typical 4 percent rule and also differed considerably from results found in this paper, but they also assumed a 1 percent management fee. Blanchett (2015b) considered the impacts of both bond yields and market valuations using the CAPE ratio on three different glide paths: fixed, increasing, or decreasing. Bond returns were modeled in a similar fashion to Blanchett et al. (2013a) and Blanchett et al. (2013b), and bonds yields again had an initial seed value of 2.5 percent and were assumed to drift toward normal over time. Both Blanchett et al. (2013b) and Blanchett (2015b) assumed a floor on bond yields of 1 percent, which in hindsight was not low enough. This paper, on the other hand, was written post 2020 and assumed a floor on bond yields of zero. While nominal bond yields in the United States have remained positive thus far, this also might not hold in the long run.
Blanchett (2007) examined the effectiveness of 43 different glide path options at sustaining withdrawal levels during retirement, assuming long-term historical average returns as inputs. In most situations, a constant stock–bond allocation was superior. For instance, with a 30-year retirement and a 4 percent withdrawal rate, the lowest failure rate of about 2 percent was achieved with a 30–70 allocation. Blanchett (2015a) follows up on glide paths and finds that decreasing glide paths have higher probabilities of sustaining initial withdrawals rates over a 30-year retirement compared to constant stock–bond allocations when the glide paths are anchored around the same equity level. This means, for example, that a glide path that starts at 60–40 and steps down evenly to 20–80 over 40 years had a higher probability of success than a constant 40–60 portfolio. This paper also found higher success rates for decreasing glide paths, but the glide path choice mattered less with higher stock allocations. Kitces and Pfau (2015) argued in favor of rising glide paths, where stock levels increase over time, when the stock market is considered to be overvalued. Spitzer and Singh (2008) compared several fixed stock–bond portfolio allocations to both a steep and gentle descent glide path and found that the constant allocations generated higher probabilities of retirement withdrawal rate success.
Monte Carlo Simulations
In this paper, Monte Carlo simulations were used to examine the potential impact of the current low-interest-rate environment on the success of initial retirement withdrawal rate plans assuming different interest rate scenarios, stock–bond allocations, glide path options, and retirement horizons. Both bond yields and the rate of inflation were assumed to start out at low levels at the beginning of retirement and then to ultimately converge to their long-term historical averages. How long it will actually take for these interest rates to converge to their long-term averages is the key question. Accordingly, different simulations were run in which the change in inflation and bond yields shifted up (with noise) assuming five, 10, 15, 20, 25, and 30 years until rates returned to their long-term averages. A scenario assuming that rates remained permanently low was also considered.
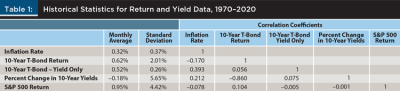
Since the starting point for bond yields and inflation is a moving target, rough estimates of the situation at the time this paper was written were used. Accordingly, the beginning inflation rate for all simulations was assumed to be 2.0 percent (0.166 percent monthly), and the yield on 10-year U.S. Treasury bonds was assumed to be 1.5 percent (0.125 percent monthly). Both rates were assumed to fluctuate randomly with a positive drift until they converged to their long-term averages, from which they would just vary randomly. The long-term averages, standard deviations, and correlations were based on monthly figures from the 1970–2020 period, as shown in Table 1. The long-term inflation rate was 3.8 percent (0.317 percent monthly), while bond yields were 6.2 percent (0.518 percent monthly). Inflation data and bond returns were derived from data from the Federal Reserve via www.fred.stlouisfed.org and www.federalreserve.gov/datadownload, respectively. The S&P 500 Index returns, which served as a proxy for stock returns, were derived from S&P Net Advantage.
While the low-interest-rate environment in the United States since the 2008–2009 financial crisis has been bad for bond yields, the same cannot be said for stock returns. Stock total returns, based on the S&P 500 Index, from 2009–2020 (1.26 percent per month) were much higher than the 1970–2008 average (0.86 percent per month). This strong current performance pulled the 1970–2020 monthly return of stock up to the 0.95 percent that is shown in Table 1. All simulations were run assuming monthly stock returns of either 0.86 percent or 0.95 percent, but only the results with the more conservative estimates were included in the paper.
Rather than directly modeling bond total returns or yields, the simulations began with percentage changes in yields. Yields were expected to vary randomly from their starting levels, with a positive walk, until they reached their historical averages. Once yields reached their “normal” levels, they still varied randomly, but with an expected change of zero. The expected rate of change in yields depended on whether rates were expected to converge to normal over five, 10, 15, 20, 25, or 30 years. In the case where rates were expected to remain low indefinitely, yields varied randomly with an expected change of zero. Monthly total returns on 10-year Treasuries were calculated using the yield from the prior month and the capital gain or loss that occurred based on the change in yields for each month.
Monthly stock returns, the inflation rate, and the change in bond yields were modeled as multivariate normal using the variance-covariance matrix of the historical data from 1970–2020. There were seven different stock-bond-inflation scenarios, with one for each of the different length of times for interest rates to converge to normal (five, 10, 15, 20, 25, or 30 years, or never). For each of these interest rate scenarios, 1,000-run Monte Carlo simulations were performed to generate monthly stock, bond, and inflation returns over a 40-year retirement period. The monthly stock and bond returns were adjusted for inflation to give real rates of return since retiree withdrawals were assumed to keep pace with inflation. These seven sets of 1,000 simulations of 480 months of real returns formed the foundation for all of the subsequent comparisons. This means, for example, that all of the various glide path, equity level, and withdrawal rate scenarios where interest rates returned to normal over five years used the same set of return simulations.
Base stock allocations of 20, 40, 60, and 80 percent were considered. Retirement portfolios were composed of a simple mix of the S&P 500 Index and 10-year U.S. Treasury bonds with monthly rebalancing. Including small-capitalization stocks and/or international stock has been shown to increase retiree withdrawal rate plan success, but this paper’s focus was on stocks and bonds in the low-interest-rate environment, so other assets were not included.
Management fees were not considered in the simulations in this paper. Obviously, a traditional 1 percent annual management fee would reduce portfolio performance and lead to higher failure rates, but this does not consider the potential benefits of having a financial planner, which cannot be modeled here. The 1 percent management fee would not necessarily apply to an investor dealing with a fee-only financial planner. Likewise, an investor following a set rebalancing schedule with these widely traded assets would face only minimal fees and transaction costs if trading in their own account.
Initial withdrawal rates of 3.5, 4.0, 4.5, and 5.0 percent were simulated, with withdrawals made at the end of each month. Initial withdrawal rates are the percentages of initial wealth that are withdrawn the first year of retirement. The dollar amounts subsequently withdrawn were assumed to increase in step with inflation each year. For example, with a 4 percent withdrawal rate, a retiree with a $1 million portfolio would withdraw $40,000 in their first year of retirement. If inflation averaged 2.5 percent that first year, the retiree would then withdraw $41,000, a 2.5 percent increase over $40,000, in the following year.
Glide Paths
An investor’s glide path relates to how they plan to change their asset allocation over time. One investor might decrease their allocation to stock (and increase their bond allocation) each year, while another might increase their stock allocation over time instead. The same glide paths used by Blanchett (2015a) were employed in this paper, except that the glide paths used here all completed in 30, rather than 40, years. For retirement periods beyond 30 years, the portfolio asset allocation mix remained fixed at its year-30 composition, which depended on the glide path being examined. The glide paths considered were decreasing fast, decreasing slow, increasing fast, increasing slow, V fast, V slow, inverted V fast, and inverted V slow, plus constant stock–bond allocations. Figure 2 shows these glide path options assuming a 60–40 base portfolio allocation.
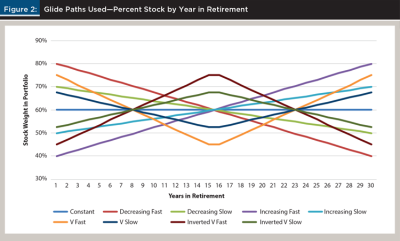
In each of the nine glide path scenarios for 60 percent stock shown in Figure 2, the simple average percent invested in stock over the full 30 years was the same. Of course, the weighted average dollar amount in stock might differ considerably between the glide paths, depending on how the various scenarios played out. With the decreasing fast glide path, the first-year allocation to stock is 80 percent (20 percent above the base case), and then it declines annually in even steps until it reaches 40 percent (20 percent below the base case) in year 30. For the decreasing slow glide path, the first-year allocation to stock is 70 percent (10 percent above the base case), which declines annually until it reaches 50 percent (10 percent below the base case) after 30 years. The increasing fast and increasing slow glide paths are the mirror opposites of their decreasing fast and slow counterparts. The increasing fast (slow) glide path begins with an equity allocation of 40 percent (50 percent) and ends up with an equity allocation of 80 percent (70 percent). The V fast glide path begins with a 75 percent equity allocation that drops down to 45 percent in years 15 and 16 before rising back up to 75 percent in year 30. The V slow glide path starts at 67.5 percent equity and drops to 52.5 percent before trending back up to 67.5 percent again. Flipping the two V glide paths over results in the inverted V paths that start and end with lower stock allocations.
The importance of post-retirement glide path choice is magnified in a low-interest-rate environment. Glide paths that were good alternatives when interest rates were high might not be so good when interest rates are low. The length of time it takes for bond yields to return to their historic averages is an unknown factor that could make some glide paths preferable to others. While stock is seen as essential to the portfolio because of its return potential and its usefulness as a hedge against inflation, this is even more relevant with bond yields that cannot keep up with inflation. While bonds are generally seen as less risky than stock, low interest rates increase the risk of bond ownership, making them less desirable in the portfolio, but some glide paths may help mitigate this disadvantage.
Stock and Bond Returns
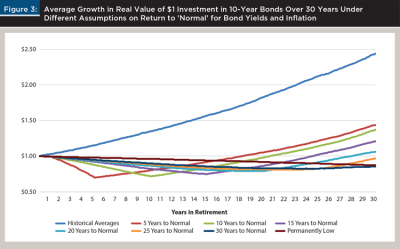
How bonds will affect retiree portfolios in the coming years is a key issue of this paper. Figure 3 reports the average value of $1 invested in bonds over time, in real terms, based on the paper’s simulation results. If bond yields were beginning from their long-term historical averages, a $1 investment in bonds would be expected to grow to nearly $2.50 in real terms over 30 years, including capital gains. None of the alternate interest rate scenarios had bonds performing anywhere near this historical average level. The faster interest rates return to their historic levels, the quicker bond investors will face upfront capital losses. Interest rates returning to their historic averages over five years would lead to a $1 bond investment quickly decreasing in value to about $0.70 in real terms. From there, it would take about 13 more years for the average bond investor’s value to return to $1. This is the quickest recovery for bonds in the low-interest-rate scenarios, but that doesn’t mean that it is necessarily the best-case scenario for current retirees because of the large upfront capital losses.
While the current low-interest-rate environment is bad for bond investors, the same is not true for stockholders. Low interest rates are typically good for business investment and the stock market, in general. Stocks and bonds are in some ways substitute investments. In this low-interest-rate environment, bonds have not been attractive to many investors, retirees in particular. This has driven many income-seeking investors into dividend-paying stock, as seen over the past several years. This phenomenon will likely continue until interest rates recover. This increased demand for stock may sustain higher returns going forward.
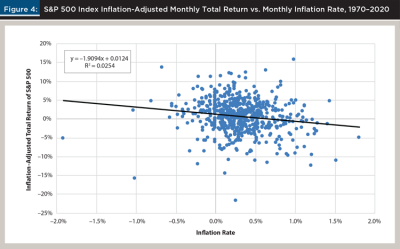
As noted earlier, the positive impact of low interest rates on stock returns is supported by the strong market performance exhibited during the extended period of low interest rates in the United States since 2008. Monthly returns of the S&P 500 Index over the past 12 years were over 40 percent higher than those experienced during the 1970–2008 period. In addition, over the long run, lower inflation rates have been correlated with higher inflation-adjusted stock returns, as shown in Figure 4. A 1 percent reduction in the rate of inflation is associated with 1.9 percent increase in inflation-adjusted stock returns. This inflation effect on stock returns is statistically significant with a p-value of less than 0.01.
The results of this paper are sensitive to the return assumptions, as is true of any other simulation-based analyses. Historical average returns are one of the most basic and unbiased predictors of future returns available to financial planners. This makes historical averages ideal inputs for analyses such as this one, when practical. While the current interest rate environment makes historical average total returns for bonds impossible to achieve in the short to intermediate term, the same is not true for stocks. Even though the stock market is currently priced high on a relative basis, continued low interest rates and bond yields may help the market continue its strong performance going forward. This was the rationale for the use of historical average stock returns in this paper. The reported results, as noted above, were actually based on the more conservative stock returns over the 1970–2008 period rather than over the full 1970–2020 period. The authors consider the somewhat lower stock return estimates to be a compromise between using the very high 50-year historical average figures and the low stock return estimates used in some other papers. The somewhat conservative stock return forecasts used in this paper allow for the possibility that the market is overpriced and that returns will be somewhat lower going forward.
Results
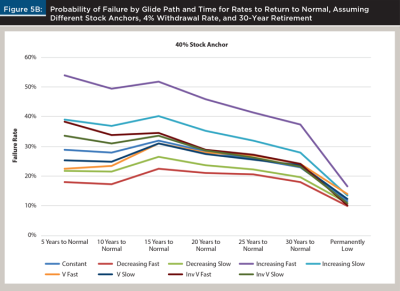
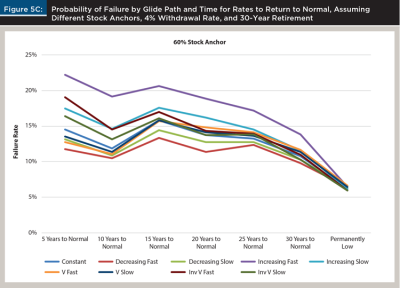
Figures 5A–5D show the failure rates assuming different stock weight anchor points for eight different glide paths and a constant stock–bond allocation across the seven different interest rate scenarios, assuming a 4 percent initial withdrawal rate and a 30-year retirement. Figures 5A, 5B, 5C, and 5D assume glide paths based on 20, 40, 60, and 80 percent stock anchors, respectively. Figure 5A shows that with a 20–80 base portfolio allocation, the glide path selection dramatically affected the probability of failure. With the increasing fast glide path, failure was practically guaranteed across all interest rate scenarios, while the odds of failure dropped to about 50 percent with the decreasing fast path—still unsatisfactory, but much lower. As the weight in equity increased, the choice of glide path became less important, as seen by the tightening bands of the paths in Figures 5B, 5C, and 5D. With an 80–20 mix, all of the glide paths offered failure rates of less than 15 percent across all of the interest rate scenarios.
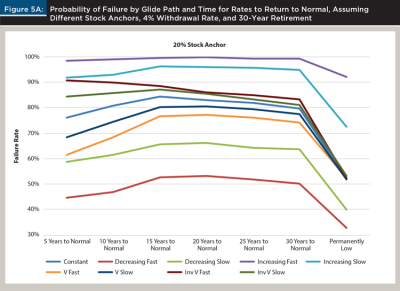
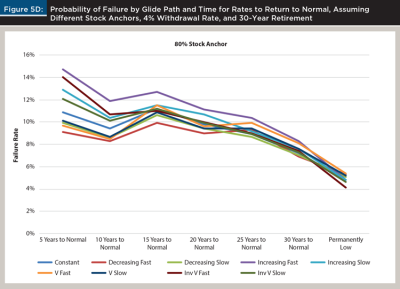
As seen in Figure 5A, the probability of failure for portfolios heavily weighted with bonds peaked with the scenario where interest rates took 15 years to recover. Quicker drops in bond prices (and the realization of sequence risk), as in the scenarios where interest rates returned to normal over five or 10 years, were offset by an earlier return to high bond yields. For stock, on the other hand, the longer the time for inflation to return to historical averages, the lower the failure rate. The interaction between stock and bond returns over time plays out across the different stock weights, glide paths, and interest rate scenarios.
Table 2 shows that in a low-interest-rate environment, a 30-year investment horizon with a 4 percent withdrawal rate is not likely a realistic goal for retirees with a 20–80 portfolio. Failure rates for all but one of these glide path / interest rate scenarios were greater than 35 percent. This finding contrasts with works such as Pfau (2011); Spitzer, Strieter, and Singh (2007); and Cooley, Hubbard, and Walz (2011); which assumed returns near their long-term averages, and found low levels of stock in the portfolio were viable, if not optimal, options. Cutting the retirement horizon to 25 years, the “decreasing” glide paths, which begin with higher allocations to stock, provided reasonable chances of success, but only for retirees still willing to accept relatively high probabilities of failure. In this paper, failure rates below 15 percent were preferred, but more aggressive investors may find failure rates up to 25 percent, as suggested by Cooley et al. (2011), to be acceptable.
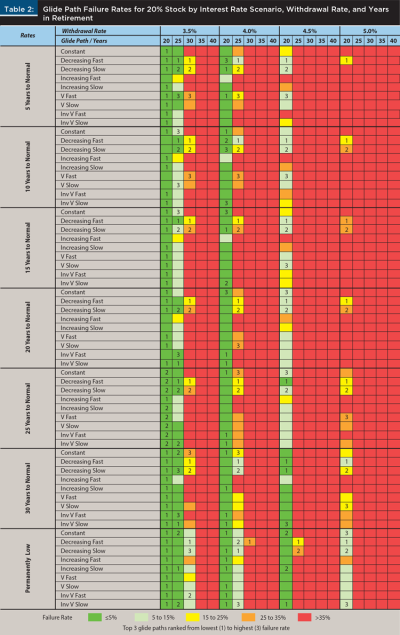
For a retiree with a 20–80 portfolio, a 3.5 percent or lower withdrawal rate might be a more realistic goal. Table 2 shows that for a 30-year horizon, the decreasing fast glide path was the best option, but it still came with failure rates of up to 25 percent across the different investment rate scenarios. Achieving more desirable failure rates of 15 percent or less required cutting the planned length of time in retirement to 25 years or less.
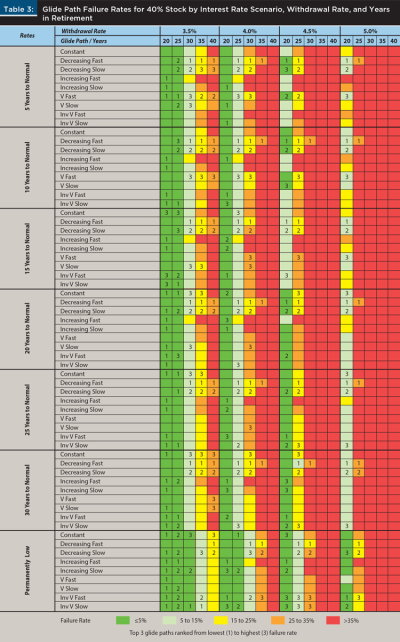
At a 40–60 mix, the standard 4 percent withdrawal rate over a 30-year retirement was a possible goal for retirees willing to accept failure rates as high as 25 percent, as shown in Table 3. However, one of the decreasing glide paths would have again been required to achieve even this outcome. Changing either to a 4 percent withdrawal rate over 25 years or keeping the 30-year horizon and lowering the withdrawal rate to 3.5 percent would have resulted in preferred failure rates of 15 percent or less. Given the current low-interest-rate situation, a retiree with a 40–60 allocation should only consider a 4.5 percent withdrawal rate if their retirement horizon was 25 years or less. Likewise, they should only consider a 5 percent withdrawal rate if their horizon was 20 years or less.
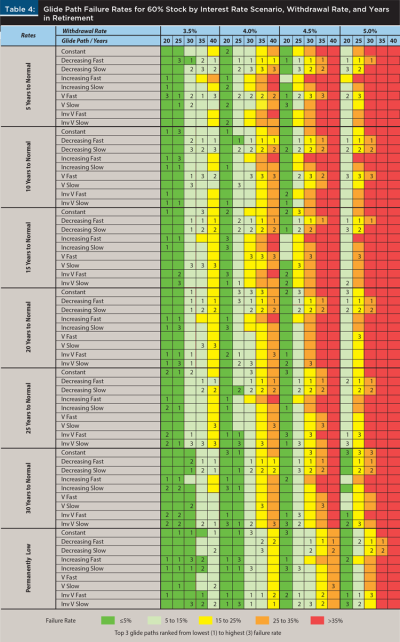
With a 60–40 portfolio, failure rates were much more manageable than with lower levels of stock, as shown in Table 4. Still, to achieve the standard 4 percent withdrawal rate over a 30-year retirement, only the decreasing glide paths offered failure rates of 15 percent or less across all the interest rate scenarios. A constant 60–40 allocation over time was another solid performer in this situation, with a failure rate of more than 15 percent in only one of the interest rate scenarios. A 4.5 percent withdrawal rate over a 30-year retirement was only possible if investors were willing to accept failure rates of up to 25 percent. Getting 15 percent or lower failure rates with an initial 4.5 percent withdrawal rate required cutting the retirement horizon to 25 years and picking one of the decreasing glide paths that performed consistently well.
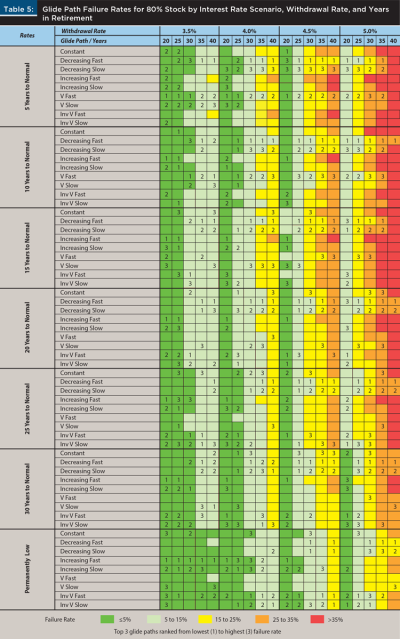
Higher levels of stock in the portfolio clearly provided better retirement outcomes in the low-interest-rate scenarios in this paper. Table 5 shows failure rates for the glide paths and interest rate scenarios assuming an 80–20 portfolio and reflects much lower probabilities of failure than present with lower stock allocations. As noted earlier, the higher the stock allocation, the less the glide path selection matters. While the decreasing fast glide path was the best performer in most interest rate scenarios assuming a 4 percent withdrawal rate and a 30-year retirement, all of the glide path options actually had failure rates of 15 percent or less in this situation. A retiree choosing a 4.5 percent withdrawal rate (with the 30-year horizon) with either of the decreasing glide paths would have had only two interest rate scenarios with failure rates above 15 percent.
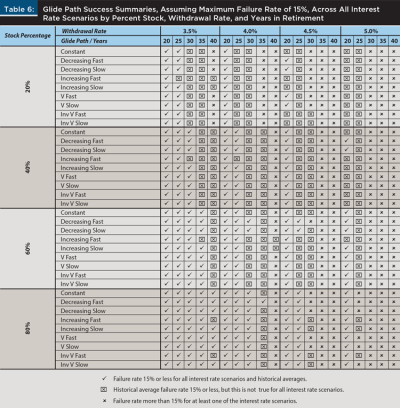
The big question of how the low-interest-rate environment would affect traditional investment advice is addressed in Table 6. Table 6 compares the results of this paper’s low-interest-rate environment simulations to the results using widely employed, long-term historical average figures. The comparisons are based on stock–bond allocation, glide path choice, initial withdrawal rate, and retirement horizon. A ü means that the retiree option had a failure rate of 15 percent or less using both the historical average returns and the low-interest-rate assumptions across all the different interest rate scenarios. Retirees with these targets would not need to change their plans due to low interest rates. The cases with an ý show the impact of low interest rates on retirement planning. These are situations where the failure rate based on long-term historical averages was 15 percent or less, but where that no longer holds for one or more of the low-interest-rate scenarios. The cases with ûs are where expected failure rates were above 15 percent with the long-term averages and the low-interest-rate scenarios. These were not viable retirement goals even before interest rates dropped so low.
Table 6 shows that the more conservative the retirement investment portfolio, as reflected by lower stock allocations, the more impact there is on traditional investment guidance. With stock and bond returns at historical levels, a 20–80 portfolio could be expected to support a 4 percent withdrawal rate over a 30-year retirement using any of the glide path options, with failure rates of 15 percent or less. However, this was not the case in the low-interest-rate scenarios. None of the 20–80 glide paths provided failure rates of 15 percent or less across the low-interest-rate scenarios. The same holds true for a 20–80 portfolio with a 4.5 percent withdrawal rate over a 25-year retirement. With an 80–20 mix, a 3.5 percent withdrawal rate remains a viable option for all but two of the glide path options over a 40-year retirement. There are considerably fewer changes in guidance at the more aggressive 80–20 portfolio allocation.
Conclusions
In the current low-interest-rate environment, bonds act as a drag on overall portfolio performance and notably decrease the maximum sustainable withdrawal rates available to retirees. Higher bond allocations lead to lower maximum sustainable withdrawal rates and shorter possible retirement horizons. This is because low bond yields have a double-edged impact on retiree portfolios. First, bond yields below the current inflation rate mean negative real returns. Second, as bond yields rise over time to their historic levels, investors will be hit with significant capital losses. However, no one knows if and when bond yields will return to their historic levels. Bonds yields quickly returning to historical average levels would actually be good for retirees holding bonds, with the higher yields having time to offset the upfront capital losses. The opposite is true for retirees holding stock who would have higher inflation rates eating into their returns.
A low-interest-rate environment has a much bigger impact on the retirement planning of more conservative investors who have portfolios geared toward higher levels of bonds. New investment guidance for investors in 20–80 or 40–60 portfolios differs more from traditional guidance, based on long-term historical stock and bond returns, than is the case for investors with 60–40 or 80–20 allocations. With higher portfolio allocations to stock, more glide path options become feasible.
The glide paths that performed best in the low-interest-rate environment and across the different interest rate scenarios were the decreasing glide paths. Consistent with more stock in the portfolio generating better performance, these glide paths have above average allocations to stock up front and then shift to more bonds over time. The more aggressive the retirement portfolio, meaning the higher the average stock position in the portfolio, the less the glide path selection matters.
Citation
Waggle, Doug, Gisung Moon, and Hongbok Lee. 2022. “Retirement Glide Path Options in an Uncertain, Low-Interest-Rate Environment.” Journal of Financial Planning 35 (3): 68–88.
References
Bengen, William P. 1994. “Determining Withdrawal Rates Using Historical Data.” Journal of Financial Planning 7 (4): 171–180.
Blanchett, David M. 2007. “Dynamic Allocation Strategies for Distribution Portfolios: Determining the Optimal Distribution Glide Path.” Journal of Financial Planning 20 (12): 68–70, 72–81.
Blanchett, David M. 2015a. “Revisiting the Optimal Distribution Glide Path.” Journal of Financial Planning 28 (2): 52–61.
Blanchett, David M. 2015b. “Initial Conditions and Optimal Retirement Glide Paths.” Journal of Financial Planning 28 (9): 52–60.
Blanchett, David M., Michael S. Finke, and Wade D. Pfau. 2013a. “Asset Valuations and Safe Portfolio Withdrawal Rates.” SSRN Scholarly Paper No. ID 2286146, Social Science Research Network, Rochester, NY. https://doi.org/10.2139/ssrn.2286146.
Blanchett, David M., Michael S. Finke, and Wade D. Pfau. 2013b. “Low Bond Yields and Safe Portfolio Withdrawal Rates.” The Journal of Wealth Management 16 (2): 55–62.
Cooley, Philip L., Carl M. Hubbard, and Daniel T. Walz. 2011. “Portfolio Success Rates: Where to Draw the Line.” Journal of Financial Planning 24 (4): 48–50, 52–54, 56–60.
Finke, Michael, Wade D. Pfau, and David M. Blanchett. 2013. “The 4 Percent Rule Is Not Safe in a Low-Yield World.” Journal of Financial Planning 26 (6): 46–55.
Frank, Larry R., John B. Mitchell, and David M. Blanchett. 2011. “Probability-of-Failure-Based Decision Rules to Manage Sequence Risk in Retirement.” Journal of Financial Planning 24 (11): 44–53.
Kitces, Michael E., and Wade D. Pfau. 2015. “Retirement Risk, Rising Equity Glide Paths, and Valuation-Based Asset Allocation.” Journal of Financial Planning 28 (3): 38–48.
Pfau, Wade D. 2011. “Can We Predict the Sustainable Withdrawal Rate for New Retirees?” Journal of Financial Planning 24 (8): 40–47.
Spitzer, John J., and Sandeep Singh. 2008. “Shortfall Risk of Target-Date Funds During Retirement.” Financial Services Review 17 (2): 143–153.
Spitzer, John J., Jeffrey C. Strieter, and Sandeep Singh. 2007. “Guidelines for Withdrawal Rates and Portfolio Safety During Retirement.” Journal of Financial Planning 20 (10): 52–54, 56–59.