Journal of Financial Planning: March 2015
Michael E. Kitces, CFP®, CLU®, ChFC®, RHU, REBC, is a partner and the director of research for Pinnacle Advisory Group and the publisher of The Kitces Report newsletter and the financial planning industry blog Nerd’s Eye View through his website www.kitces.com.
Wade D. Pfau, Ph.D., CFA, is a professor of retirement income at The American College and director of retirement research at McLean Asset Management. He is a two-time recipient of the Journal of Financial Planning’s Montgomery-Warschauer Award. His website is www.RetirementResearcher.com.
Executive Summary
- This research investigates two types of dynamic asset allocation strategies, predetermined equity glide paths and valuation-based asset allocation, for retirees using U.S. historical data.
- Based on U.S. historical data, it is difficult to beat a strategy that maintains a consistently high allocation to stocks to the extent that a retiree’s risk tolerance allows for this, and subject to the caveat that high stock allocations cannot always be expected to do as well in the future.
- However, when retirements beginning in varying valuation environments are considered, the potential for different dynamic allocation strategies emerge to help retirees sustain higher spending levels with lower average stock allocations.
- When retirements begin in overvalued market environments (which reflected the situation for new retirees in 2015), an accelerated rising equity glide path shows potential to provide downside risk protection for retirees. In other valuation environments, historical worst-case scenario sustainable withdrawal rates are highest with valuation-based asset allocation strategies.
This study explores the interaction of two research threads relating to asset allocation in retirement: whether the optimal equity glide path should rise or fall throughout retirement (and at what pace those changes should occur), and/or whether retirement asset allocation should move up and down dynamically in response to stock market valuation extremes.
The first research question relates to the appropriate default equity glide path for client portfolios during the retirement phase of the lifecycle. The conventional wisdom is that retirees should use a declining equity glide path during retirement where equity exposure glides downward every year as the client gets older. However, Bengen (1996) and Blanchett (2007) both found that static fixed allocations support higher sustainable withdrawals compared to declining equity glide paths, casting at least part of the conventional wisdom into doubt. At the time, neither Bengen nor Blanchett tested rising equity glide paths.
In turn, Pfau and Kitces (2014) found that rising equity glide paths in retirement—where the portfolio starts out conservative and becomes more aggressive as retirement progresses—have the potential to modestly reduce both the probability of failure and the magnitude of failure for retirees relative to a static portfolio or a declining equity glide path. This result may appear counterintuitive. Yet, the conclusion is actually logical when viewed from the perspective of what scenarios cause a client’s retirement to fail (at least when the starting spending rate is modest).
In scenarios that threaten retirement sustainability, such as an extended period of poor returns in early retirement, a declining equity exposure over time will lead the retiree to have less invested in stocks if and when mean reversion takes hold and the good returns arrive later in retirement. With a rising equity glide path that starts more conservative, the retiree is less exposed to losses when most vulnerable to seeing their retirement plan derailed by poor market returns early in retirement. This will work especially well if there is mean reversion in asset returns. Blanchett, Finke, and Pfau (2013) provided empirical evidence that mean reversion is observable in a sample of 20 countries using financial market data since 1900.
Conversely, using a rising equity glide path in scenarios where equity returns are good early on, the retiree is so far ahead of their original retirement goal that their subsequent asset allocation choices do not impact the chances to achieve it; this is the positive outcome of a favorable sequence of returns. Interpreted another way, as the portfolio grows and the funded status improves, the portion of assets necessary to cover the remaining spending goals will decline, increasing the retiree’s capacity for risk (if desired).
The second research area under investigation here relates to how retirement outcomes can be anticipated by retirement date stock market valuation levels, as well as how retirement outcomes can be improved with a dynamic asset allocation strategy that adjusts the stock allocation in response to market valuations.
Campbell and Shiller (1998) demonstrated an empirical link in which stock market valuations, defined by the price of the S&P 500 divided by average real earnings over the previous 10 years, can explain about 30 percent of subsequent real stock returns over 10 years. High valuations imply lower returns, while low valuations imply higher future returns. This link is especially important in retirement because it not only impacts cumulative returns that support sustainable retirement distributions, it also impacts the potential for a favorable or unfavorable return sequence in the disproportionately important early part of retirement. A version of this effect is also apparent with bond returns; low bond yields clearly relate to lower subsequent bond returns.
Following this line of thought, Kitces (2008) and Pfau (2011a, 2011b) used fixed asset allocations to explore the relationship between retirement date valuations and sustainable retirement spending. Kitces argued that safe withdrawal rates are higher when valuations are low (and vice versa when starting valuations are high). Pfau (2011a) extended this idea with a regression model including dividend and bond yields to show that, historically, a close relationship has existed between sustainable withdrawal rates and these variables.
It is possible to obtain fairly reasonable predictions for a new retiree’s sustainable withdrawal rate based on prevailing conditions at the retirement date. Subsequently, Blanchett, Finke, and Pfau (2014) built a Monte Carlo simulation model that allowed returns to evolve from the starting retirement date situation for market valuations and interest rates. They also presented evidence for the link between retirement date market conditions and sustainable withdrawal rates.
The other important aspect of market valuations relates to valuation-based asset allocation, which makes adjustments based on stock market valuation levels. Pfau (2012a) provided an extensive review of the research in this area, which can trace its origins to Graham and Dodd (1940). The underlying theme in this research is that stock markets tend to exhibit cyclical patterns over time. Stock allocations should increase when stock prices/values are relatively low. Allocations should decrease when prices/values are relatively high. As Tomlinson (1953) described, “ … a variable ratio formula provides for smaller percentages of stocks in high market areas, where the risk of owning stocks is greatest, and for larger percentages in low market areas, where the risk of loss is bound to be considerably less” (p. 167).
When applying this to financial planning problems in terms of wealth accumulation, Pfau (2012a) found that almost every permutation of valuation-based asset allocation strategies built on the cyclically adjusted price-to-earnings ratio (PE10), which is centered around 50 percent stocks, demonstrates strong potential to improve risk-adjusted returns for conservative long-term investors. Such valuation-based strategies provide returns comparable to 100 percent stocks but with substantially less risk according to a wide variety of risk measures.
Conversely, valuation-based strategies can be viewed as offering comparable risks and the same average asset allocation as a 50/50 fixed allocation strategy, but with higher returns. Solow, Kitces, and Locatelli (2011) also found that valuation-based strategies can improve risk-adjusted returns. They argued that capital market expectations do differ in a dramatic fashion between high and low valuation environments, especially with respect to equity returns.
Given prior research that market risk and return expectations can vary by valuation, Kitces (2009) and Pfau (2012b) provided evidence supporting the idea that long-term investors can obtain improved retirement planning outcomes using valuation-based asset allocation strategies.
Kitces (2009) examined a valuation-based strategy that shifted stock allocations dynamically between 30 percent, 50 percent, and 70 percent based on historical cyclically adjusted price-to-earnings ratios. He found that incorporating valuations into asset allocation decisions can help increase sustainable withdrawal rates.
Pfau (2012b) confirmed this finding by showing that valuation-based allocations would have supported lower savings rates and higher sustainable withdrawal rates, relative to a fixed asset allocation strategy, with the same average allocation to stocks.
The current research combines glide paths and valuations in order to investigate which types of market valuation environments may justify different types of glide paths for retirees. The following questions are addressed: (1) considering market valuations, are there times when a traditional glide path may be preferable to a rising equity glide path; (2) do rising glide paths perform better when retirement begins at a point of high market valuations; and (3) are retirees justified to deviate from a set glide path when market valuations are at extreme levels?
Joint consideration of glide paths and valuations allows for a richer analysis. As Kitces (2009) showed, making adjustments based on market valuation can enhance retirement income success even from a static portfolio baseline. And as noted earlier, the general reason why rising equity glide paths appear to perform well is that they end up increasing equity exposure in scenarios where stocks provide mediocre returns and become relatively “cheap” in the first half of retirement before reverting to the mean in the second half.
Given that in other scenarios, markets perform well in the early years, a more optimal default glide path approach might make glide path adjustments based not on time-based triggers but on valuation-based triggers. This would allow for a rising equity glide path if stocks start out overvalued with a higher risk of poor returns, but use a static portfolio or declining equity glide path if stocks are undervalued at the onset of retirement. The purpose of this paper is to test these scenarios.
Methodology and Data
This analysis employed overlapping historical periods to simulate retirement outcomes for hypothetical retirees over rolling 30-year periods using different asset allocation strategies. The withdrawal rate was defined as a percentage of retirement assets in the initial year, with that fixed dollar amount adjusted for inflation in subsequent years regardless of asset returns. This means the current withdrawal rate could vary from the initial withdrawal rate after the first year. Withdrawals were made at the start of each year, and the remaining portfolio was rebalanced to the targeted asset allocation.
The maximum sustainable withdrawal rate (MWR) was defined as the highest (initial) withdrawal rate that would have been able to sustain a series of inflation-adjusted dollar withdrawals over the 30-year retirement duration. If the withdrawal pushed the account balance to zero, the withdrawal rate was too high and the portfolio failed. The MWR is the highest rate that succeeds. Taxes were not specifically incorporated, and any taxes associated with the entire portfolio would still need to be paid separately.
The study used historical data since 1871 obtained from Robert Shiller’s website (www.econ.yale.edu/~shiller/data.htm). The PE10 measure was the stock price in January divided by the average real earnings on a monthly basis over the prior 10 years. Investment portfolios included large-cap stocks (S&P Composite Stock Price Index) and short-term fixed income assets (annual yield from six-month commercial paper rates). For short-term fixed income assets, Shiller stopped collecting data after 2009. Missing data for the most recent years were replaced using one-year constant maturity Treasury rates from the Board of Governors of the Federal Reserve System. We will also discuss results when replacing short-term Treasury bills with the longer-dated bonds in Shiller’s dataset. These are defined as the yields on 10-year Treasuries in years since 1953, and Shiller used the government bond yields provided in Sidney Homer’s A History of Interest Rates for the period prior to that.
The following formula was used to estimate bond returns to approximate the return for year t using the yields (r) for year t and t +1:
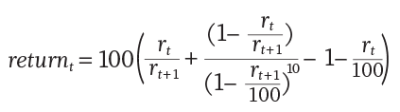
Pfau and Kitces (2014) found that declining equity glide paths do not necessarily help support retirement success, and even static allocations may do no better than more conservative starting allocations that rise in equity exposure throughout retirement. Generally, depending on the underlying assumptions and outcome measures, the optimal starting equity exposures for a 4 percent withdrawal rate are around 20 to 40 percent, finishing at around 40 to 80 percent.
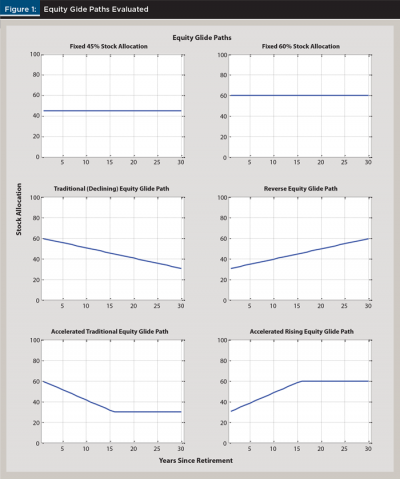
To limit the number of scenarios and illustrate the results in a comprehensible way, this analysis examined asset allocation strategies comparable to a rising equity glide path beginning at 30 percent and ending at 60 percent stocks. Fixed asset allocations; traditional declining equity glide path; an accelerated traditional glide path; a rising equity glide path; an accelerated rising equity glide path; valuation-based allocations tethered around a fixed allocation; and glide paths with valuation-based overlays were analyzed.
Fixed asset allocations included 45 percent stocks (the midpoint when shifting from 30 percent to 60 percent) and 60 percent stocks (the aggressive end of the baseline glide path).
The traditional declining equity glide path began at 60 percent stocks. The stock allocation was reduced by 1 percent per year (such that equities are down to 50 percent after 10 years, 40 percent after 20 years, etc.) until the stock allocation reached 30 percent in the 30th year of retirement.
The accelerated traditional glide path began at 60 percent stocks and was reduced by 2 percent per year such that the final 30 percent stock allocation was reached in the 15th year (and then static from there to the end of retirement).
The rising equity glide path started retirement at 30 percent stocks and the stock allocation was increased by 1 percent per year, such that it took 30 years to reach the final stock allocation of 60 percent.
An accelerated rising equity glide path was also used that increased the stock allocation by 2 percent each year, such that it took 15 years for the final 60 percent allocation to be reached. These six glide paths are illustrated in Figure 1.
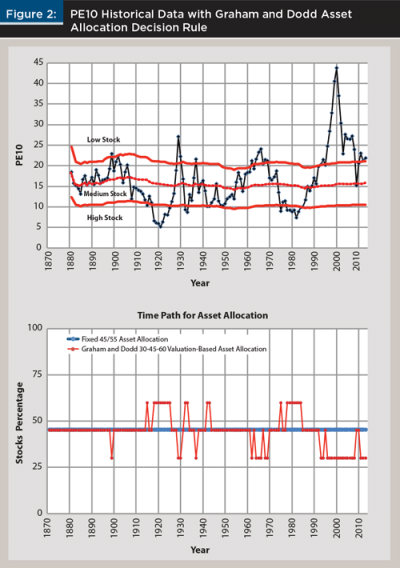
For the valuation-based asset allocation strategy, the neutral stock allocation was 45 percent. The stock allocation shifted to 60 percent when the market was undervalued and to 30 percent when the market was overvalued. An undervalued or overvalued market can be defined multiple ways. To avoid the issue of look-back bias as much as possible, Graham and Dodd’s (1940) switching rules were used. They suggested maintaining a neutral asset allocation when valuations fall within a range between 2/3 and 4/3 of their historical average value. The historical average was defined as the rolling median between the start date of the data series (1871) and that point in history. Graham and Dodd increased the stock allocation when valuations were less than 2/3 of their average. They decreased the stock allocation when valuations were more than 4/3 of their average.
These numerical bounds correspond to evolving PE10 values of approximately 10 and 21 over time. Given the volatility of PE10, these bounds also roughly correspond with the bottom and top quintiles of the historical valuation distribution, which are PE10 values of 11.1 and 21.2. Though more frequent action is possible, this analysis only considered clients who check whether a revision of their asset allocation is required at the beginning of each year.
To summarize, the valuation-based strategy used a lower stock allocation in any year that PE10 began the year at more than 4/3 of its historical median up to that point. A higher stock allocation was used when PE10 began the year at less than 2/3 of its historical median up to that point. A neutral stock allocation (set at a 45 percent baseline) was used in all other years.
For this valuation-based strategy, Figure 2 shows historical PE10 along with the bounds for the Graham and Dodd (1940) decision rules, as well as the corresponding asset allocation for each year in the historical record. Over the period studied, there were 28 allocation changes, for an average of one change every five years. Once a change occurs, that higher or lower allocation may remain in place for several years in a row. Out of the 133 years in which PE10 could be calculated, there were 28 years in which a lower equity allocation was used (stocks are overvalued), and 21 years with a higher equity allocation (stocks are undervalued). The period 1871 through 2013 covers 143 years; however, 10 years of earnings were required to construct the first value for PE10. A neutral allocation for 1871–1880 was assumed as PE10 was unknown at that time.
Finally, equity allocation glide paths were combined with valuation-based asset allocations to create traditional and rising valuation-based glide paths. These strategies followed the declining or rising equity glide path allocation over time, except that they subtracted or added 15 percent to what the stock allocation otherwise would have been in cases when the markets were overvalued or undervalued.
Both unbounded and bounded versions of these combined strategies were considered. With the unbounded strategies, the stock allocation was allowed to potentially be less than 30 percent or greater than 60 percent after the valuation-based adjustments were made. For the bounded strategies, the stock allocation was not allowed to extend beyond the 30 to 60 percent range. For example, if the equity glide path called for a 37 percent stock allocation in a particular year, and if this was a year in which the market was overvalued, the unbounded allocation strategy would subtract 15 percent from 37 percent, resulting in a stock allocation of 22 percent. In the bounded case, the stock allocation reduced only to the 30 percent bound. Conversely, in a case where the equity glide path called for a stock allocation of 52 percent in a year that the market was undervalued, the unbounded strategy would allow for the stock allocation to be 15 percent higher at 67 percent, while the bounded strategy would increase the stock allocation to 60 percent. With the unbounded strategies, stock allocations could fall to as low as 15 percent or increase to as high as 75 percent.
Revisiting Glide Path Results in the Historical Context
Table 1 shows the highest sustainable withdrawal rate for the worst-case scenario in the historical record (which Bengen (1994) labeled as “SAFEMAX”), with outcomes for the fixed portfolios (45 percent and 60 percent in equities), and for each of the two versions of the rising and declining glide paths. Results include both scenarios where fixed income assets are held as Treasury bills and as bonds.
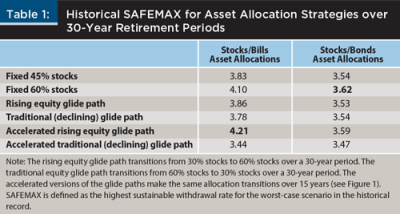
Notably, while Kitces and Pfau (2014) showed that rising equity glide paths over the entire 30-year horizon can be more effective when modeled on a Monte Carlo basis, the results were not replicated when analyzed using historical data. Instead, with historical data that implicitly includes mean reversion (not included in the prior Monte Carlo models), the optimal portfolios were the fixed 60 percent equity exposure portfolio with both stocks/bills and stocks/bonds portfolios. Both the baseline rising equity glide path and the declining equity glide path results proved inferior to the more aggressive fixed allocation. With U.S. historical data, the equity risk premium looms large, making it difficult for conservative portfolios/glide paths to achieve better results than more aggressive (static) asset allocations even when using outcome measures focused on downside risks. This issue is less pronounced when using Monte Carlo simulations based on historical data that do not incorporate mean reversion.
Table 1 also adds the SAFEMAX results for the accelerated versions of the glide paths, which adjust by 2 percent per year for 15 years and then level off for the remainder of the time horizon. Using the historical data that reflects mean reversion, the results when using Treasury bills suggest that the accelerating rising glide path could even outperform the fixed aggressive allocation in the worst-case scenario. Although the accelerated rising glide path did have greater average equity exposure throughout retirement compared to a 30-year rising glide path, it still had less average equity exposure than the 60 percent fixed portfolio (as the former only reaches 60 percent in equities for the second half of retirement, while the latter has 60 percent in equities for all of retirement), yet it achieves a superior withdrawal rate result. With bonds, the accelerated rising glide path was still not as good as the fixed aggressive allocation, though both were noticeably lower than their stocks/bills counterparts.
On the other hand, the accelerated declining glide path performed worse than the other portfolios in the case of both stocks/bills and stocks/bonds. This is likely a combination of the fact that such portfolios have lower average equity allocations—and therefore less of an equities contribution to long-term growth—and that the accelerated declining glide path can further exacerbate sequence-of-return risk by bearing most of the equity exposure and downside risk in the early years when a market decline most jeopardizes the retirement goal, but then decreasing the equity exposure and limiting any subsequent recovery as mean reversion takes hold.
Also notable was the fact that overall, the stocks/bonds portfolios led to significantly lower sustainable withdrawal rates than stocks/bills portfolios. Bonds have historically provided a better yield than Treasury bills, yet the results reveal that when coupled with their increased volatility, the worst-case historical outcomes worsened with (longer-term) bonds compared to Treasury bills.
Results for Different Market Valuations at the Start of Retirement
As first demonstrated in Kitces (2008), the historical variation in sustainable withdrawal rates can be at least partially explained by the market valuations at the beginning of retirement. Accordingly, Panel A of Table 2 shows the SAFEMAX for the stocks/bills and stocks/bonds portfolios with the four primary strategies: (1) fixed 45 percent; (2) fixed 60 percent; (3) accelerated rising glide path; and (4) steady declining glide path—segmenting by the market valuation level at the start of retirement. The valuation thresholds were determined by whether retirement began in a favorable (undervalued), fairly valued (neutral), or unfavorable (overvalued) market environment as shown in Figure 2.
It is notable that segmenting the results by market valuation also reveals an interesting distinction in the comparison of stocks/bills versus stocks/bonds. The inclusion of bonds in the portfolio leads to inferior outcomes in moderate or unfavorable valuation scenarios, while the stocks/bonds outcomes are comparable (though still not superior) for retirements beginning at favorable valuation levels. These results further emphasize that when market valuations are high and stocks are exposed to an increased probability of low returns, the volatility of longer-term bonds can be a liability in mitigating sequence-of-return risk. However, in situations where stocks are already favorably valued and the downside risk to equities is more limited, the volatility of bonds is less problematic.
With respect to the glide path outcomes, the accelerated rising equity glide path was most effective in the high-valuation environments, where the worst of the bad outcomes were concentrated.
In situations where retirement began with valuations in the middle zone, the accelerated rising glide path was comparable with stocks/bills but not superior to the fixed 60 percent equity portfolio (though notably, achieves the same SAFEMAX with less cumulative equity exposure and volatility throughout retirement).
In the low-valuation scenarios where stocks were actually “cheap” at the beginning of retirement, the accelerated rising glide path shifted to being the least favorable result, while the steady declining glide path performed better, and the fixed 60 percent equity portfolio yielded the most favorable SAFEMAX results. This was not surprising given that the 60 percent stock portfolio had the highest average equity exposure in situations where stocks had the highest expected returns due to favorable valuations.
These results indicate that the optimal equity glide path (as well as the decision about whether to use Treasury bills or bonds) is in fact quite sensitive to the market valuation at the start of retirement. The rising equity glide path should only be considered in unfavorable valuation environments (which characterizes the environment in 2014–2015). Notably though, the traditional steady declining equity glide path was still inferior to some other strategy in all valuation environments. Based on historical data, more aggressive portfolios are rewarded in favorable (undervalued) and neutral environments. Rising equity glide paths perform better in unfavorable market environments. These were the situations that generated the overall historical SAFEMAX.
Results for Valuation-Based Strategies
Given the apparent sensitivity of optimal asset allocation glide paths to market valuation at the beginning of retirement, the next test examined the consequences of using a more dynamic asset allocation strategy. That strategy is one that shifts equity exposure throughout retirement, decreasing equity exposure to 30 percent in years when PE10 was more than 133 percent of its historical median to that point, and increasing equity exposure to 60 percent in years when PE10 fell to less than 67 percent of its historical median up to that point, and otherwise holding the equity exposure at 45 percent in the neutral valuation environments (see Figure 2). Panel B of Table 2 shows the SAFEMAX results with these valuation-based strategies added to the mix.
In the case of unfavorable valuation environments, the valuation-based results using stocks/bills were comparable to the results of the accelerated rising equity glide path. In moderate valuation environments, results were slightly superior. In the most favorable valuation environments, the valuation-based SAFEMAX was significantly higher than for the accelerated rising glide path. Notably, the valuation-based SAFEMAX was also consistently slightly higher than the static 60 percent stocks portfolio, even in the most favorable starting valuation environment.
Panel B of Table 2 also shows the results for the scenarios where valuation-based adjustments were applied from a rising or declining equity glide path base (as opposed to only adjusting from a 45 percent stocks center point), which can potentially accelerate or even reverse the glide path at valuation extremes. Although the results of the bounded valuation-based glide paths were generally superior to their analogous steady glide paths, the valuation-based glide paths were not as effective in the various valuation environments as the 30-45-60 valuation-based approach.
In the case of the unbounded valuation-based glide paths (where stocks could move outside the 30 and 60 percent thresholds to as low as 15 percent and as high as 75 percent), results improved relative to their analogous bounded scenarios, suggesting that the application of the somewhat arbitrary 30 percent and 60 percent thresholds may be constraining the valuation-based opportunities. In particular, the unbounded valuation-based declining glide path performed especially well, beating out all other glide paths with a 5.80 percent SAFEMAX from the cheapest starting valuations. This was not surprising given that the portfolio would be over-weighted to 75 percent in equities when their expected returns were most favorable.
The unbounded valuation-based declining glide path only slightly lagged the 30-45-60 valuation strategy at other starting valuations. However, the practicality of this outcome may be limited by client risk tolerance, because not all retired clients may be willing to own a portfolio with as much as 75 percent in equity exposure at any point in their retirement. Once asset allocation bounded scenarios are applied, the valuation based 30-45-60 approach continued to look the most appealing.
In the case of stocks/bonds, the trends in the valuation-based strategies and glide paths were similar to the non-valuation-based approaches; the stocks/bonds scenarios were consistently inferior to the stocks/bills scenarios at unfavorable and moderate starting valuations, and were comparable—though not superior—when starting valuations were favorable.
Overall, these results suggest that the valuation-based approach is generally superior to the rising equity glide path approach and the fixed equity allocation portfolios, because the valuation-based scenarios produce comparable to slightly better results across the board. For those who are willing to be even more flexible, there appear to be further benefits to widening the valuation-based adjustments, although such an approach would have to be balanced against client risk tolerance and willingness to deviate significantly from an underlying allocation benchmark. Additionally, in all but the most favorable valuation environments, retirees should consider more defensive bond allocations; specifically, Treasury bills as opposed to longer-term bonds, because even with valuation-based adjustments, stocks/bonds portfolios underperformed stocks/bills portfolios from unfavorable and moderate starting valuations.
Median Wealth versus SAFEMAX
Although the focus of the methodology was on determining the worst-case historical maximum sustainable withdrawal rate (SAFEMAX) for various allocation strategies across starting valuation environments, such an approach focuses specifically on the strategies that minimize risks in the worst outcomes. It does not necessarily address how wealth may be impacted in more favorable retirement sequences. To gain some perspective on this trade-off, Table 3 shows the median real wealth after 30 years (from a $100 initial base using a 4 percent withdrawal rate spending pattern) across the different asset allocation strategies, starting from various valuation environments.
As Table 3 shows, the classic fixed 60 percent stock exposure asset allocation produced the greatest or nearly greatest median wealth when the starting valuation was undervalued (favorable) or fairly valued. It is only in the overvalued starting valuation environments that the fixed 60 percent equity allocation lost to the alternatives, where with stocks/bills the accelerated rising equity glide path proved superior (and valuation-based rising glide paths even better), and with stocks/bonds the 30-45-60 valuation-based and the unbounded valuation-based traditional glide paths were slightly better.
Overall, valuation-based strategies were not as clear outperformers based on median wealth as they were when viewed from the SAFEMAX perspective. This is not surprising, given that these approaches will produce a lower average equity exposure throughout retirement for returns to compound.
Consistent with past research, valuation-based strategies did support larger median wealth than the more directly comparable fixed 45 percent stock allocation strategy. It is also interesting that with this median wealth measure, using Treasury bills was more advantageous than bonds in all but the undervalued starting environments.
Overall, the more favorable strategies when viewed in the context of median wealth were substantively similar to those determined by a SAFEMAX approach, with the caveat that “risk-managed” approaches were somewhat less favorable. Valuation-based strategies were not a clear outperformer in terms of median wealth as they were with the SAFEMAX. In scenarios where danger was greatly diminished with favorable starting valuations, the investor was truly rewarded for taking greater risk, with materially higher wealth outcomes for both fixed 60 percent equity allocations (over other risk-managed alternatives) and for taking longer-term bond risk (in lieu of Treasury bills).
Implications for Financial Planners
The primary implication of this research for financial planners is that, when it comes to retirement income strategies and proper asset allocation strategies in retirement, market valuations matter. The results from this study generally reinforce the prior research discussed earlier, showing both a sensitivity of sustainable withdrawal rates to starting valuations at retirement, and also that various asset allocation glide paths have been more or less effective depending on the market valuation at the time of retirement.
Results reveal that prior research suggesting rising equity glide paths are favorable compared to fixed portfolios (especially when the rising glide path is “accelerated” and simply occurs throughout the first half of retirement), and that declining equity glide paths provide the worst outcomes, might be true only in situations where market valuations are at extremes relative to historical levels when the worst-case scenarios defining the SAFEMAX are observed. At more moderate valuation levels, the gap between rising equity glide paths and static portfolios narrows. At favorable valuations, the declining equity glide paths actually perform better, while the rising equity glide paths are worst, and the fixed 60 percent equity portfolios are best of all (in terms of both SAFEMAXs and median terminal wealth).
These outcomes are driven heavily by the market returns that are implied, and subsequently manifest, given market valuation levels at the start of retirement. Accordingly, a valuation-based dynamic allocation approach appears to capture the best of both worlds, producing a comparable SAFEMAX as rising equity glide paths in unfavorable valuation environments, and a superior SAFEMAX than declining equity glide paths in favorable valuation environments.
In fact, the valuation-based dynamic allocations were superior to accelerated glide paths, steady glide paths, and valuation-based glide paths, except in scenarios where market valuation was most favorable. In those cases, the approaches that provided the highest overall equity exposure (and especially in the early years) were even more favorable.1
It is notable that in these high-valuation environments glide paths and dynamic valuation-based allocations tend to perform better with stocks and Treasury bills (or similar cash substitutes) and not bonds. The potential bond volatility with interest rate risk can be dangerous and possibly lead to lower SAFEMAX outcomes when equity valuations are already so elevated (even if the bonds still have better long-term returns). This suggests that financial planners guiding clients on retirement income in today’s environment should focus on managing interest rate risk, even at the cost of lower bond portfolio returns. It is not necessarily fatal to a retirement plan to hold high allocations of short-term bonds in the face of low interest rates, because its primary purpose is to defend against equity declines and be available to reinvest for better equity returns, not to be a return driver itself.
Notwithstanding all of these results, it is still noteworthy that, similar to the results of Blanchett (2007), a static 60 percent equity allocation is still “nearly” optimal in most situations relative to the other glide paths studied here. The static 60 percent equity allocation had a SAFEMAX that is slightly inferior to 30-45-60 valuation-based portfolios. Compared to the rising equity glide path, it was only slightly lower in unfavorable valuation zones, comparable at moderate valuations, and superior in the most favorable valuation environments (while also producing greater median wealth in moderate and favorable starting valuations thanks to the higher average equity exposure). Therefore, it appears that valuation-based dynamic portfolios, or accelerated rising glide paths, are truly best for:
- those who retire when valuations are poor;
- the subset of clients with moderate starting valuation who are more concerned about retirement income sustainability than maximizing a remaining legacy value to heirs;
- those who are more concerned about downside exposure than upside potential;
- those who generally want a more risk-managed approach to retirement.
It is also significant that in the end, valuation-based dynamic portfolios (or valuation-based glide paths) may provide slightly more favorable SAFEMAX outcomes in the long run, at least when starting from unfavorable valuation environments. This approach is not necessarily intended to be an effective trade timing indicator in the short run. In many instances, the Graham and Dodd (1940) valuation thresholds tested here would have reduced equity exposure years before a market decline occurred. Similarly, this approach may overweight equities long before a precise market bottom. Subsequent research might explore the means of refining these timing mechanisms further. However, it should be emphasized that the strategies in the context of this research are intended to optimize retirement income sustainability and not to provide short-term market timing indicators or to minimize tracking error of performance returns.
The bottom line is that the optimal asset allocation strategy in retirement does appear to be contingent on market valuation, and that part of the explanation for why a rising equity glide path does well in overvalued markets is that it proxies the behavior of valuation-based asset allocations.
Based on this research, strategies to adjust the retirement income approach based on such valuations include changing the initial withdrawal rate and applying a more valuation-based dynamic allocation strategy.
For those who prefer a somewhat more steady approach, the next alternative would be to implement an accelerated rising equity glide path, recognizing that such an approach is generally only effective in environments where market valuation starts out high.
For those who are uncomfortable engaging in dynamic allocations or glide paths at all, it is important to recognize that an annually rebalanced static 60 percent equity exposure is still remarkably effective as a retirement asset allocation, although the alternatives studied in this research do provide modest improvements in outcomes, especially in situations where sequence-of-return risk is elevated (at high valuation environments) and sustainable withdrawal rates are otherwise at their lowest.
Endnote
- At the time of analysis, market valuations were not favorable. In August 2014, PE10 was approximately 26, which was well into the overvalued range (see Figure 2). This is the exact environment in which sustainable withdrawal rates tend to be lowest, and where the (accelerated) rising glide path and valuation-based dynamic allocations tend to shine.
References
Bengen, William P. 1994. “Determining Withdrawal Rates Using Historical Data.” Journal of Financial Planning 7 (4): 171–180.
Bengen, William P. 1996. “Asset Allocation for a Lifetime.” Journal of Financial Planning 9 (8): 58–67.
Blanchett, David M. 2007. “Dynamic Allocation Strategies for Distribution Portfolios: Determining the Optimal Distribution Glide Path.” Journal of Financial Planning 20 (12): 68–81.
Blanchett, David M., Michael S. Finke, and Wade D. Pfau. 2013. “Optimal Portfolios for the Long Run.” Social Science Research Network. ssrn.com/abstract=2320828.
Blanchett, David M., Michael S. Finke, and Wade D. Pfau. 2014. “Asset Valuations and Safe Portfolio Withdrawal Rates.” Retirement Management Journal 4 (1): 21–34.
Campbell, John Y., and Robert J. Shiller. 1998. “Valuation Ratios and the Long-Run Stock Market Outlook.” Journal of Portfolio Management 24 (2): 11–26.
Graham, Benjamin, and David Dodd. 1940. Security Analysis (The Classic 1940 Second Edition). New York: McGraw-Hill.
Kitces, Michael E. 2008. “Resolving the Paradox: Is the Safe Withdrawal Rate Sometimes Too Safe?” The Kitces Report. www.kitces.com/may-2008-issue-of-the-kitces-report.
Kitces, Michael E. 2009. “Dynamic Asset Allocation and Safe Withdrawal Rates.” The Kitces Report. www.kitces.com/april-2009-issue-of-the-kitces-report-dynamic-asset-allocation-and-safe-withdrawal-rates.
Pfau, Wade D. 2011a. “Can We Predict the Sustainable Withdrawal Rate for New Retirees?” Journal of Financial Planning 24 (8): 40–47.
Pfau, Wade D. 2011b. “Safe Savings Rates: A New Approach to Retirement Planning over the Life Cycle.” Journal of Financial Planning 24 (5): 42–50.
Pfau, Wade D. 2012a. “Long-Term Investors and Valuation-Based Asset Allocation.” Applied Financial Economics 22 (16): 1343–1353.
Pfau, Wade D. 2012b. “Withdrawal Rates, Savings Rates, and Valuation-Based Asset Allocation” Journal of Financial Planning 25 (4): 34–40.
Pfau, Wade D., and Michael E. Kitces. 2014. “Reducing Retirement Risk with a Rising Equity Glide Path.” Journal of Financial Planning 27 (1): 38–45
Solow, Kenneth, R., Michael E. Kitces, and Sauro Locatelli. 2011. “Improving Risk-Adjusted Returns using Market-Valuation-Based Tactical Asset Allocation Strategies.” Journal of Financial Planning 24 (12): 38–49.
Tomlinson, Lucille. 1953. Practical Formulas for Successful Investing. New York: Wilfred Funk.
Citation
Kitces, Michael, and Wade D. Pfau, 2015. “Retirement Risk, Rising Equity Glide Paths, and Valuation-Based Asset Allocation.” Journal of Financial Planning 28 (3): 38–48.