Journal of Financial Planning: April 2011
Executive Summary
-
Portfolio success rate analysis provides the information needed to plan withdrawals from a retirement portfolio. Because financial markets and other matters of life change unexpectedly, those plans are likely to change.
-
This updated analysis reports portfolio success rates net of monthly withdrawals through a range of payout periods. The data we rely on are total returns to large-company common stocks and high-grade corporate bonds as well as Consumer Price Index values and inflation rates from January 1926 through December 2009.
- We conclude that if 75 percent success is where to draw the line on portfolio success rates, a client can plan to withdraw a fixed amount of 7 percent of the initial value of portfolios composed of at least 50 percent large-company common stocks.
- The sample data suggest that clients who plan to make annual inflation adjustments to withdrawals should plan lower initial withdrawal rates in the 4 percent to 5 percent range, again from portfolios of 50 percent or more large-company common stocks, in order to accommodate future increases in withdrawals.
- Changes in withdrawal rates or amounts can be made in response to unexpected changes in financial market conditions using the basic tables we provide.
Philip L. Cooley has been the Prassel Distinguished Professor of Business Administration at Trinity University since 1985. He is the author of several books and more than 50 journal articles on financial topics.
Carl M. Hubbard is a professor of business administration at Trinity University. He has previously authored and coauthored articles on retirement planning in many journals including the Journal of Financial Planning.
Daniel T. Walz is a professor of finance at Trinity University. For Spring 2011, he is a visiting professor of finance at the University of Hong Kong.
The idea of a portfolio success rate has served as a useful metric since we first wrote about it in 1998. It measures “the percentage of all past payout periods supported by a portfolio despite annual withdrawals” (Cooley, Hubbard, and Walz 1998). If a portfolio outlives the client despite his or her withdrawal of money from it at some rate, then it is counted as a success. However, if the client outlives the portfolio, it is counted as a failure. The principal advantage of the portfolio success rate methodology is the ability of the reader to scan a range of portfolio success rates relative to withdrawal rates, portfolio asset allocations, and years of payout for planning purposes. Because no methodology can specify an optimal withdrawal rate or portfolio allocation for all clients generally, it is important for advisers to present the risk-return trade-offs in the withdrawal rate decision in a manner that facilitates retirement investment planning.
Withdrawal rates that worked well in the past presumably will work well in the future. The problem is, what is meant by “worked well in the past”? What level of portfolio success rate is required for planning purposes? Should we require 100 percent success from past results for a withdrawal rate prior to using the rate in a financial plan? Or can we use a withdrawal rate that was less than 100 percent successful in the past?
Requiring a high portfolio success rate necessarily requires a low withdrawal rate. In contrast, if a low portfolio success rate is acceptable, then a high withdrawal rate can be used in a financial plan. Unfortunately, high withdrawal rates are not sustainable, meaning that the portfolio value will prematurely reach zero and the client is left without support from the portfolio. So what is the Goldilocks solution between a high portfolio success rate (low withdrawal rate) and a low portfolio success rate (high withdrawal rate)?
Drawing the Line
Begin by considering why a high portfolio success rate would be chosen, thus leading to a low withdrawal rate and little financial support for the client from the portfolio. Perhaps the client doesn’t need support from the portfolio because of other income streams. Maybe the client wishes to leave a large estate to heirs. It may also be the case that the client or adviser is extremely risk averse. In that situation the client avoids longevity risk by planning to live poor and die rich. Nevertheless, a basic inference from the research on this topic is that a low withdrawal rate will deprive a client of funds in the early years of retirement but will provide greater support in the later years, or simply a large estate. This circumstance apparently motivated an article by Scott, Sharpe, and Watson (2009), who criticized the “4 percent rule” for its high initial cost of retirement income (retirement portfolio investment relative to withdrawals).
In contrast, imagine the client who wants to take as much as possible from the portfolio. Who has not heard of the client who wants to withdraw 10 percent per year from the portfolio because that is roughly the average annual rate earned in the stock market? Of course, except for short payout periods, such a high withdrawal rate is a risky strategy! The risk arises from the volatility of stock market returns. Ten percent may be the average rate, but the variance around the average can be enormous. Thus, a 10 percent annual withdrawal from a well-diversified, all-stock portfolio usually has only about a 50 percent portfolio success rate. Essentially the client would be flipping a coin on the success of this strategy. Certainly, the portfolio success rate must exceed 50 percent for most clients.
Think carefully about the setting we envision regarding the use of portfolio success rates to select a reasonable withdrawal rate. At some point a future client begins to think, “How much money can I expect to withdraw annually from my portfolio to supplement Social Security payments and other income?” A reasonable withdrawal rate from the portfolio is one that is likely to be sustainable over the retirement years.
Past Studies
In earlier literature on sustainability of retirement portfolios, withdrawal-rate authors calculated portfolio success or failure rates based on constant or inflation-adjusted periodic withdrawals from continually rebalanced portfolios of stocks and bonds for specific payout periods, or until the portfolios were exhausted. The purpose of the literature was retirement planning. The portfolio success rates associated with initial withdrawal rates were reported for planning initial retirement withdrawals from managed portfolios. Financial plan modifications of withdrawal amounts and rates as well as alterations of portfolio asset allocations during the payout period are likely. Bengen (1994, 1996, and 1997), Bierwirth (1994), Cooley, Hubbard, and Walz (1998, 1999, 2003a, 2003b, and 2005), Pye (2000), and Spitzer, Streiter, and Singh (2007) are examples of that literature.
Other literature on retirement planning examines whether adaptive or variable payouts over statistical life expectancies and various portfolio rebalancing plans improve the sustainability of withdrawal rates. This literature often suggests that equations or mechanisms should be in place for changing the withdrawal rate or amount in response to unexpected changes in the value of a retirement portfolio. Ho, Milevsky, and Robinson (1994); Milevsky, Ho, and Robinson (1997); Bengen (2001); Guyton (2004); Spitzer, Streiter, and Singh (2008); Stout (2008), Blanchett and Frank (2009); Liu, Chang, De Jong, and Robinson (2009); and Frank and Blanchett (2010) are examples of adaptive literature. In the article by Scott, Sharpe, and Watson (2009), the authors consider this topic from a different perspective by suggesting the use of call options to reduce the volatility and cost of retirement income.
The primary difference in the two genres of retirement withdrawal studies is perspective. The first group of studies focuses on retirement planning, but does not suggest ongoing portfolio withdrawal management techniques. The latter group of articles suggests not only an initial withdrawal rate or amount but a plan for ongoing portfolio management with the objective of optimizing withdrawals. For a more detailed review of selected literature, see the appendix.
Data and Methodology
The principal objective of our analysis is to calculate retirement portfolio success rates for various monthly withdrawal rate assumptions and various portfolio asset allocations from 1926 to 2009, and show how an adviser can use the findings to manage portfolio withdrawal rates adaptively. Our results and those of similar research may be used for ongoing portfolio management in ways that adapt to unexpected changes in the value of a retirement portfolio. To this end, we use the overlapping-periods methodology, sometimes referred to as rolling periods, in order to calculate end-of-period portfolio values from historical stock returns and bond returns. At the completion of the analysis of a payout period, the sample payout period is “rolled” forward by one year, and another analysis is conducted.
The overlapping or rolling periods methodology has advantages over the commonly used Monte Carlo simulation and bootstrapping methodologies. Both Monte Carlo simulation and bootstrapping techniques usually assume that the mean and standard deviation of returns to securities and portfolios are unchanged through a payout period. However, analyses of stock and bond returns show varying means and standard deviations over time. For example, Cooley, Hubbard, and Walz (2003a) demonstrate the equivalency of portfolio success rates from Monte Carlo simulation versus rolling periods, but only if the returns data in the Monte Carlo analysis are adjusted for mean reversion and serial correlation. Simple simulation studies ignore serial correlation and clustered variances of stock returns over time. Simulation studies of withdrawal rates can be especially useful when the returns data are limited. Some examples are hedge funds and commodity and foreign stock ETFs. In those instances, there are too few years of returns data to conduct a traditional rolling periods study. Monte Carlo simulation and bootstrap studies can provide interesting results, but the rolling periods approach has the unique advantage of retaining the effects of the actual sequence of security returns and variances in bull markets and bear markets over the 84 years of data we researched.
In our portfolio success rate analysis, a portfolio of stocks and bonds is deemed successful at the end of an n-year payout period if its ending value, gross of monthly returns, and net of monthly withdrawals is positive. When a portfolio drops to zero in value, it is counted as a failure. No bankrupt or negative value portfolios are included in our calculations of median ending portfolio values.
The monthly data on financial market returns are provided in the 2010 Ibbotson SBBI Classic Yearbook by Morningstar. The stock returns in the analysis are monthly total returns to the Standard & Poor’s 500 Index. Corporate bond returns are monthly total returns calculated from the Salomon Brothers Long-Term High-Grade Corporate Bond Index and Standard & Poor’s monthly high-grade corporate composite yield data. Monthly portfolio returns, month-end values, and month-end values after withdrawals are calculated for overlapping 15-, 20-, 25-, and 30-year periods from January 1926 to December 2009. In that 84-year period, there are 70 overlapping 15-year payout periods, 65 overlapping 20-year payout periods, 60 overlapping 25-year payout periods, and 55 overlapping 30-year payout periods. Calculations of monthly portfolio returns implicitly assume rebalancing of portfolios each month to the desired allocation of stocks and bonds. Annual inflation rates used in adjusting annual withdrawals are calculated from the Consumer Price Index (CPI-U) for 1926 to 2009 published by Morningstar (2010) and the U.S. Bureau of Labor Statistics (2010). Month-end portfolio values that determine portfolio success rates after nominal withdrawals are calculated as follows:
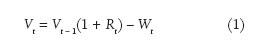
in which Vt is the remaining value of the portfolio at the end of month t, Vt – 1 is the value of the portfolio at the beginning of the month net of the previous month’s withdrawal, Rt is the rate of return on the portfolio for month t, and Wt is the amount withdrawn from the portfolio at the end of the current month. Month-end portfolio values that determine portfolio success rates after inflation-adjusted withdrawals are calculated as follows:
in which the variables are defined as in Equation (1), except (1 + iY) is the inflation adjustment for each year’s monthly withdrawals. The inflation adjustment (1 + iY) is calculated by dividing the previous year’s (t – 1) Consumer Price Index for urban consumers (CPI-U) by the value of the CPI-U at the beginning of the payout period. Thus, the clients maintain the purchasing power of monthly withdrawals with a one-year lag, enabling annual adjustment of monthly withdrawals by known rates of inflation.
Some clients may choose to withdraw funds at the beginning of the month, but that simply scales back the investment capital by one month’s withdrawal. In that circumstance, the withdrawal rates in Tables 1–4 would apply to the reduced investment capital after the first withdrawal. Likewise the results would be unchanged if the actual investment of retirement funds occurs one month prior to the initial beginning of the month’s withdrawal.
The 7 Percent Plan
Table 1 reports the portfolio success rates of nominal or constant monthly withdrawals ranging from 0.25 percent per month (3 percent annualized) to 1.0 percent per month (12 percent annualized) for annual overlapping periods from 1926 to 2009. The payout periods vary from 15 to 30 years in increments of 5 years, and asset allocations vary from 100 percent stocks to 100 percent corporate bonds in increments of 25 percent. Advisers can determine what percentage success rate is minimally acceptable. Table 1 clearly shows that retirement portfolios composed of at least 50 percent equities can support withdrawal rates up to 7 percent with a high probability of success; that is, the portfolio will still have a positive terminal value at the end of the retirement period. For example, a portfolio with 75 percent stocks and 25 percent bonds successfully supported a 30-year retirement with a 7 percent withdrawal rate through 91 percent of the sample overlapping periods.
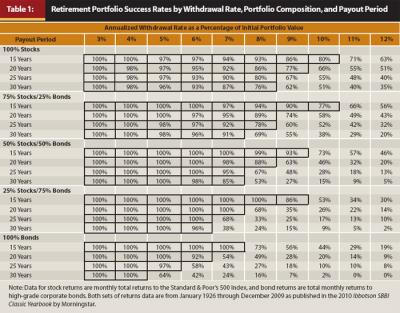
In our calculations of portfolio values net of 7 percent withdrawals, we note that 8 of the 55 simulated portfolios of 50 percent stocks and 50 percent bonds for 30-year payout periods failed. Four of those failed portfolios were initiated in the late 1920s and early to mid-1930s. The average survival of those eight failed portfolios was 289 months, about 24 years. Thus, half the portfolios with withdrawal rates of 7 percent failed because of the misfortune of having been initiated just before or during the Great Depression. Also, the average number of months of survival is evidence that failure of those portfolios would not have been a surprise when it occurred. There was time and opportunity to reevaluate withdrawal rates and portfolio asset allocations.
Table 1 also indicates that the portfolio success rate diminishes quickly for retirement portfolios with a bond composition greater than 50 percent. For example, a portfolio with a 25 percent stock and 75 percent bond asset allocation successfully supported a 30-year retirement with a 7 percent withdrawal rate for 38 percent of the sample overlapping periods. The success rates in Table 1 also show that for portfolio withdrawal rates greater than 7 percent, portfolio success rates diminish rapidly to generally unacceptable levels. For example, if the withdrawal rate for a 30-year portfolio with 75 percent stocks and 25 percent bonds is increased from 7 percent to 8 percent, the portfolio success rate declines from 91 percent to 69 percent. Higher withdrawal rates likely would be unsuccessful except for equity-heavy portfolios through short payout periods.
Table 2 presents the portfolio success rates for withdrawal rates inflation-adjusted on an annual basis as described in Equation (2) above. The results in Table 2 indicate that maintaining a relatively constant “real” withdrawal amount over time significantly diminishes portfolio success rates. That is, clients who wish to adjust their annual withdrawals by inflation must begin with a lower initial withdrawal rate in order to avoid depleting their portfolios. For example, a portfolio with 75 percent equities and 25 percent bonds successfully supported a 30-year retirement period with a 7 percent withdrawal rate, adjusted for inflation, for only 45 percent of the sample overlapping periods, versus 91 percent for a 7 percent nominal withdrawal rate in Table 1. However, an initial withdrawal rate of 5 percent from a portfolio of 75 percent equities and 25 percent bonds was successful through 82 percent of the 30-year payout periods when adjusted for inflation.
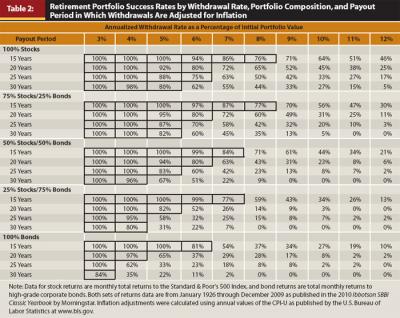
As with the 7 percent plan, we examined the failing portfolios net of 5 percent inflation-adjusted withdrawals over 30 years from portfolios of 50 percent stocks and 50 percent bonds. We found that all but 1 of the 18 failing portfolios spanned the high-inflation years of the late 1970s. As the withdrawals were adjusted upward as a result of high inflation and low financial market returns, the portfolios were depleted and failed. Thus, as in the analysis of 7 percent fixed withdrawals, extraordinary economic and financial circumstances explain the failures of the 5 percent inflation-adjusted withdrawals from 50 percent stock and 50 percent bond portfolios. As equivalent circumstances develop, clients have little choice but to reduce planned withdrawals in order to preserve their portfolios.
The portfolio success rates in Tables 1 and 2 allow an adviser to evaluate the likely success of an initial withdrawal rate. If the adviser plans to adjust withdrawals for inflation, the portfolio success rates reported in Table 2 justify 5 percent to 6 percent initial withdrawals over an expected 15- to 20-year payout period from portfolios containing at least 50 percent stocks.
Table 3 reports the median ending portfolio values per $1,000 initial retirement portfolio, again varying by retirement period, portfolio composition, and nominal withdrawal rate (unadjusted for inflation). The table shows that the median ending portfolio values dramatically increase with the proportion of equity investment. For example, assuming a 7 percent withdrawal rate and 30-year retirement period, the median end-of-period value for portfolios composed of 50 percent stocks and 50 percent bonds is $1,190. The median value of 100 percent stock portfolios net of 7 percent initial withdrawals is $7,752. The median ending portfolio values contained in Table 3 suggest that when a higher end-of-retirement period value is important to the decision process of a client, a lower withdrawal rate and a higher equity allocation should be considered.
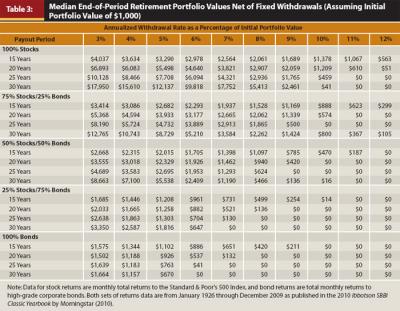
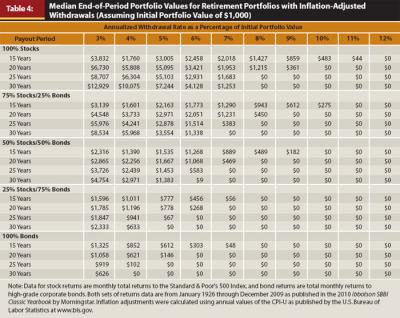
Table 4 presents the median ending portfolio values per $1,000 initial retirement portfolio with inflation-adjusted withdrawal rates. Again, the benefit of a higher allocation to stocks is striking. Assuming a 6 percent real withdrawal rate and 30-year retirement period, portfolios consisting of 50 percent stocks and 50 percent bonds have a median end-of-period value of $9. Holding all else constant, the median ending value of portfolios with a 100 percent investment in equities is equal to $4,128. Thus, the median values in Table 4 support the notion that portfolios with a high equity composition are more supportive of inflation-adjusted withdrawals than portfolios with less equity investment.
Adaptive Withdrawal Plans
Much of the recent literature focuses attention on revising withdrawal amounts and portfolio asset allocations through payout periods, especially in response to changes in market conditions. Some authors advise adjusting to lower real withdrawal amounts when the real or inflation-adjusted portfolio values decline and suggest a plan to increase real withdrawals when they increase. As those withdrawal plans become more adaptive to changes in market conditions, they move closer in effect to a variable annuity plan that withdraws a constant percentage of a moving average value of the portfolio. Some authors add the complexity of adjusting each year’s withdrawal amount by the previous year’s inflation rate but with the proviso that the effective withdrawal rate not be greater than a designated percentage, say 6 percent, of the value of the portfolio.
The information in Tables 1–4 provides analysis advisers can use to revise withdrawal rates and asset allocations in place of the more mathematically complicated adaptive mechanisms. For example, when the stock market rises more than expected, a client could consider increasing the amount of annual withdrawals that reflect a sustainable rate from Table 1 or 2 to be applied to the higher portfolio value over the expected remaining payout period. If a client expects a short remaining payout period of 15 years and expects subsequent stock market conditions consistent with average expected returns and risk, he or she might consider an inflation-adjusted withdrawal rate of as much as 7 percent. In Table 2, 7 percent inflation-adjusted withdrawals are 77 percent to 87 percent successful over 15-year payouts in sample portfolios that contain at least a 25 percent allocation to stocks.
When portfolio values decline significantly because of stock market reversals, withdrawal amounts are likely to require adjustment downward to a subsequently sustainable percentage of the remaining value of the portfolio over the remaining payout period. Because Tables 1 and 2 reflect the bear market of 2008–2009, they are especially useful in that circumstance. By lowering the monthly or annual withdrawal amount to a figure consistent with an acceptable portfolio success rate in either Table 1 or 2, clients reduce the probability of depleting their portfolios, albeit with a lower standard of living. Whether clients should be planning inflation-adjusted withdrawals depends on their overall financial circumstances. If other income and assets act as sufficient inflation hedges, then inflation-adjusted withdrawals would not be necessary. Otherwise it would make sense to plan to make inflation-adjusted withdrawals.
The impact of changes in the equity proportion of a portfolio on the sustainability of withdrawal rates also may be observed in Table 1 or 2. For shorter payout periods, high equity proportions support on average higher sustainable withdrawal rates, but at the cost of greater volatility. The higher success rates in Tables 1 and 2 of portfolios with higher equity allocations even in shorter payout periods argue against the practice of increasing the allocation to bonds in later years of life. Clearly, individual circumstances and a person’s ability psychologically to endure stock market volatility may suggest higher allocations to cash and fixed-income securities. However, the portfolio success rates in Tables 1 and 2 and median ending values in Tables 3 and 4 would not support a conversion of retirement portfolios to bonds in later years of life.
What about the perfect storm of 2008 when almost all securities declined in value? In a perfect financial storm, clients are likely to focus on preserving the remaining portfolio while still withdrawing some funds for support. In a sustained bear market such as 2008 to early 2009, clients preserve the opportunity for portfolio recovery by reducing withdrawal amounts to no more than the dividend and interest income from the portfolio, thus avoiding the liquidation of shares or bonds at low values. Planning budgets in retirement and allocation to liquid assets should include the possibility of such market conditions.
Certainly, adjustments in withdrawal amounts and rates are to be expected throughout a payout period. An examination of 2008 year-end values of portfolios in our analyses would reveal alarming declines in portfolio values, even for the successful portfolios. Thus, Tables 1 and 2 are not offered as unalterable withdrawal plans, but should be viewed as tools to guide practitioners and clients in making initial portfolio withdrawal plans and subsequent adjustments to those plans.
Conclusion
The question remains, what level of portfolio success rate should advisers and clients require in the selection of a sustainable withdrawal rate? At this point we must take a subjective liberty as authors who have studied this question for a long time. We take liberty because of the importance of the question, to which the answer is necessarily subjective. In our opinion, most practitioners and clients should require at least a 75 percent portfolio success rate in the selection of a withdrawal rate. This rule of thumb means that the associated withdrawal rate has worked three out of four times in the past and failed one out of four times. If a client expected a 20-year payout period after retirement and was willing to accept a 75 percent success rate, he or she could select a 7 percent or even an 8 percent annualized withdrawal rate for fixed withdrawals from a portfolio of at least 50 percent stocks. The success rates equal to 75 percent or better are bordered in Tables 1 and 2 in order to focus attention on the withdrawal rate/portfolio asset allocation/payout period combinations we consider successful.
For purposes of planning, this rule seems sensible to us. We emphasize the phrase for purposes of planning and fully expect mid-course corrections up and down during the retirement years. Note that the withdrawal rate selected for planning is not cast in stone—it can change. It is not a contractual obligation; it is not a guaranteed annuity rate.
We conclude that if 75 percent or better portfolio success rates form the feasible set of portfolio success rates, clients could plan to withdraw a fixed amount of 7 percent of the initial value of portfolios composed of at least 50 percent large-company common stocks. For shorter payout periods of 15 or 20 years, the sustainable withdrawal rate with 75 percent success or better is as much as 8 percent for portfolios of 50 percent or more large-company common stocks. The sample data suggest that clients who plan to make annual inflation adjustments to withdrawals should also plan lower initial withdrawal rates in the 4 percent to 5 percent range, again, from portfolios of 50 percent or more large-company common stocks, in order to accommodate future increases in withdrawals.
We emphasize that the purpose of this and similar research is to assist advisers and clients in forming a plan for annual withdrawals from retirement portfolios. The variability of financial markets throughout the twentieth century and now in the early years of the twenty-first century teaches us that such plans must adapt to unexpected losses of portfolio value, but also may be revised to take advantage of unexpected gains. As advisers and clients reformulate plans for withdrawals, the tables we provide for planning purposes also serve to recalculate subsequently sustainable withdrawal amounts from various portfolio allocations and through revised and probably shorter payout periods.
References
Bengen, W. P. 1994. “Determining Withdrawal Rates Using Historical Data.” Journal of Financial Planning 7, 4 (October): 171–180.
Bengen, W. P. 1996. “Asset Allocation for a Lifetime.” Journal of Financial Planning 9, 4 (August): 58–67.
Bengen, W. P. 1997. “Conserving Client Portfolios During Retirement, Part III.” Journal of Financial Planning 10, 6 (December): 84–97.
Bengen, W. P. 2001. “Conserving Client Portfolios During Retirement, Part IV.” Journal of Financial Planning 14, 5 (May): 110–119.
Bierwirth, L. 1994. “Investing for Retirement: Using the Past to Model the Future.” Journal of Financial Planning 7, 1 (January): 14–24.
Blanchett, D., and L. Frank. 2009. “A Dynamic and Adaptive Approach to Distribution Planning and Monitoring.” Journal of Financial Planning 22, 4 (April): 52–66.
Cooley, P. L., C. Hubbard, and D. Walz. 1998. “Retirement Spending: Choosing a Sustainable Withdrawal Rate.” Journal of the American Association of Individual Investors 20, 2 (February): 16–21.
Cooley, P. L., C. Hubbard, and D. Walz. 1999. “Sustainable Withdrawal Rates from Your Retirement Portfolio.” Financial Counseling and Planning 10, 1: 39–47.
Cooley, P. L., C. Hubbard, and D. Walz. 2001. “Withdrawing Money from Your Retirement Portfolio Without Going Broke.” Journal of Retirement Planning 4: 35–41, 48.
Cooley, P. L., C. Hubbard, and D. Walz. 2003a. “A Comparative Analysis of Retirement Portfolio Success Rates: Simulation Versus Overlapping Periods.” Financial Services Review 12, 2: 115–128.
Cooley, P. L., C. Hubbard, and D. Walz. 2003b. “Does International Diversification Increase the Sustainable Withdrawal Rates from Retirement Portfolios?” Journal of Financial Planning 16, 1 (January): 74–80.
Cooley, P. L., C. Hubbard, and D. Walz. 2005. “Retirement Withdrawals: What Rate Is Safe When Time Is Short and Uncertain?” Journal of the American Association of Individual Investors 27, 1 (January): 4–9.
Frank, L., and D. Blanchett. 2010. “The Dynamic Implications of Sequence Risk on a Distribution Portfolio.” Journal of Financial Planning 23, 6 (June): 52–61.
Guyton, J. 2004. “Decision Rules and Portfolio Management for Retirees: Is the ‘Safe’ Initial Withdrawal Rate Too Safe?” Journal of Financial Planning 17, 10 (October): 54–62.
Ho, K., M. Milevsky, and C. Robinson. 1994. “Asset Allocation, Life Expectancy, and Shortfall.” Financial Services Review 3, 2: 109–126.
Liu, Q., R. Chang, J. De Jong Jr., and J. Robinson. 2009. “Reality Check: The Implications of Applying Sustainable Withdrawal Rate Analysis to Real World Portfolios.” Financial Services Review 18 (Fall): 123–139.
Milevsky, M., K. Ho, and C. Robinson. 1997. “Asset Allocation Via the Conditional First Exit Time or How to Avoid Outliving Your Money.” Review of Quantitative Finance and Accounting 9, 1 (July): 53–70.
Morningstar. 2010. Ibbotson SBBI 2010 Classic Yearbook. Morningstar Inc.
Pye, G. B. 2000. “Sustainable Investment Withdrawals.” Journal of Portfolio Management 26, 4 (Summer): 73–83.
Scott, J. S., W. F. Sharpe, and J. G. Watson. 2009. “The 4% Rule—At What Price?” Journal of Investment Management (third quarter). http://www.stanford.edu/~wfsharpe/retecon/4percent.pdf (accessed Spring 2010).
Spitzer, J., J. Streiter, and S. Singh. 2007. “Guidelines for Withdrawal Rates and Portfolio Safety During Retirement.” Journal of Financial Planning 20, 10 (October): 52–59.
Spitzer, J., J. Streiter, and S. Singh. 2008. “Adaptive Withdrawals.” The Journal of Investing 17, 2 (Summer): 104–113.
Stout, R. 2008. “Stochastic Optimization of Retirement Portfolio Asset Allocations and Withdrawals.” Financial Services Review 17, 1 (Spring): 1–15.
U.S. Bureau of Labor Statistics. 2010. Consumer Price Index—All Urban Consumers, Series Id. CUUR0000SA0. www.bls.gov/PDQ/servlet/SurveyOutputServlet (accessed Spring 2010).
![]()
![]()