Journal of Financial Planning: September 2021
Executive Summary:
- Many retirees do not have substantial savings outside the equity in their homes.
- Some retirees do not have much income available that keeps up with unexpected cost of living increases.
- Retirees may not have anticipated low interest rates and a housing market bubble fueling large increases in assessed home values that caused property taxes to go up while risk-free income streams went down.
- Retirement planning should now include the potential impacts of increased property taxes eroding the disposable earnings of retirees.
Mark Schaub, D.B.A., is a professor of finance at Stephen F. Austin State University in Nacogdoches, Texas. Since 2002, he has published over 100 journal articles on topics ranging from personal finance to international investing. He started the finance major at Texas A&M University—Texarkana and helped create the finance emphasis at Northwestern State University in Natchitoches, Louisiana. His doctorate in finance was earned from Mississippi State University.
As an attorney specializing in estate planning and probate law, Dr. Banker Phares, J.D., brings his expertise into the classroom. He received his bachelor’s degree from Lamar University and his doctor of jurisprudence from Southern Methodist University. Phares holds the John and Karen Mast Professorship, oversees SFA’s financial planning program, and works closely with the Chadwick Student Financial Advisors. In addition to his scholarly articles, Phares has written more than 200 articles for the Nacogdoches newspaper, The Daily Sentinel, about personal financial planning, healthcare, finance, and the development of the Texas higher education system.
JOIN THE DISCUSSION: Discuss this article with fellow FPA Members through FPA's Knowledge Circles.
FEEDBACK: If you have any questions or comments on this article, please contact the editor HERE.
NOTE: Click on images below for PDF versions.
A retirement plan examines a large scope of potential expenditures that a retiree may have to cope with once they begin living on a fixed income. Most in the United States plan well to deal with medical expenses by obtaining Medicare and supplemental insurance that pays what Medicare doesn’t. However, many retirees did not consider that bubbles in the housing market in the late 1990s, early 2000s, and today, fueled by historically low and—at times—near-zero interest rates, would lead to a large increase in property taxes. For more information on how low interest rates fuel increasing house values, see Schaub (2011, 2013). Higher property taxes naturally tend to follow increased assessed values of homes.
A large part of financial planning involves tax planning. Normally, the focus is on reducing income taxes today in order to save more for tomorrow (when, hopefully, the retiree will be in a lower tax bracket). Property taxes, however, are unique in that they are assessed whether there is income or not. Income taxes are only paid when there is income. Payroll taxes are only paid when receiving a paycheck from an employer. Sales taxes are only paid when a purchase is made. However, property taxes are assessed forever, independent of consumer behavior (other than having bought a home at some point). Even when the home changes owners, these taxes still follow the property. Therefore, these taxes are not as easy to control after retirement and tend to only go up over time regardless of income. While there are some state and local governments that provide extra exemptions for those over 65, these taxes can still increase when home values are reassessed.
This paper examines the financial impact that property taxes may have after someone retires. It explores demographics of the aging population, and how the housing market may reduce disposable income for those living on fixed incomes that don’t increase by true inflation rates, or incomes that are determined by the prevailing interest rates paid on savings in the economy. Further, an examination into how some are dealing with the problem, as well as what potential retirees should look for when deciding where to live after retirement, are presented.
The Problem
The wealth and income of households age 60 and older gives an indication of how much retirees and pre-retirees have to work with when it comes to paying the bills after age 65. In Table 1, information from the Survey of Consumer Finances (SCF) put out by the Board of Governors of the Federal Reserve is presented to indicate the financial shape of the aging population.
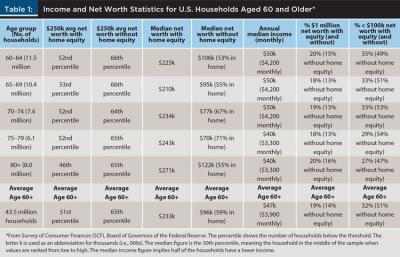
Table 1 shows that about 20 percent of households ages 60 and over have $1 million of net worth or more. That falls to less than 15 percent when home equity is taken out. This makes sense because most of these people have been working and saving for three or four decades. The other extreme, however, shows about a third of the 60-and-over population does not even have $100,000 of net worth. It becomes more than half of the 60-and-over population when taking home equity out. Therefore, some of these households may not be able to make ends meet. Furthermore, only one-third of the aging population has $250,000 of net worth when ignoring home equity, while half have that level of wealth when home equity is included. Obviously, the biggest challenges to paying bills during retirement are experienced by those households that are relying only on Social Security (SS). The median income figures show that income generated from savings, pensions, and SS are about $47,000 (meaning half of the retirees make below $47,000 each year from all their combined sources of income). This is the amount of money these retirees have to pay all of their bills including taxes, living expenses, medical expenses, and unanticipated expenses. Obviously, where a retiree lives would determine the ease or difficulty of living on the median income (or less).
While the biggest anticipated additional expenses during retirement come from healthcare for medical issues and prescriptions, many retirees did not anticipate the housing market bubble that inflated home values and caused higher-than-expected increases in property taxes. Figure 1 shows how the bubble dramatically increased median house values from 1996 until the height of the bubble in 2006. According to these data, from 1970 until 2006, the nominal median house price rose from $27,559 to $235,231 (an increase in value of over 750 percent). Adjusting for inflation, the increase was still nearly two-fold ($155,860 in 1970 versus $278,178 in 2006). Since property taxes are assessed at nominal values (and assessed values normally never go down), the average property tax liability could have easily gone up by a factor of eight or more from the property value increases alone (ignoring higher tax percentages on assessed values) in a 30-year period. These substantial unanticipated increases would be more of a burden in high property tax states than low property tax states. Figure 1 also shows the median home price fell to $180,131 by 2012.

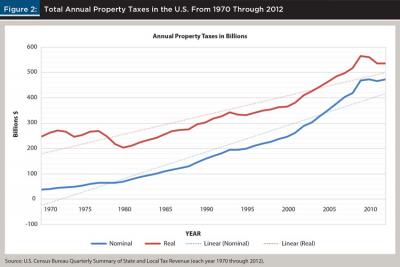
In Figure 2, one can see that taxes did not trend downward as much as median home prices after the housing market bust in 2008; instead, the level of taxes increased. In 1970, total property tax collections in the United States were $37.5 billion versus $377 billion (10 times higher) in 2006 at the height of the bubble. Despite a short time of tax decreases, by 2012, property tax collections hit $474 billion. In other words, even though median house prices fell from the 2006 peak values, property taxes continued to rise by nearly $100 billion. The most important takeaway from these two graphs is that the annual compounded growth rate in house prices during the 42-year period from 1970 through 2012 was 4.6 percent per year, while property taxes had an annual compounded growth rate of 6.2 percent per year for the same period. This shows that property taxes have increased by a greater rate than that of home values. The reason for disproportional changes is that, like Federal Insurance Contributions Act (FICA) taxes, there is a tax rate and a taxable amount—both of which can change (though in the case of FICA, the rate has remained unchanged for decades, but the taxable earnings ceiling goes up each year). Also, though some taxing authorities may reassess real estate values to a lower level or freeze taxes, some do not. While the two figures stop shortly after the bubble impacts in 2008, according to U.S. Census Bureau data, by 2020, total U.S. property tax collections totaled nearly $650 billion, while the median home value in the U.S. hit a record high of $295,000 (after interest rates were slashed once again). The inflation-adjusted trend line in Figure 1 shows that house prices tend to increase at a higher rate than inflation in the economy. Also, the steeper trend line for inflation-adjusted U.S. property tax collections in Figure 2 shows property taxes increase at a higher rate than house prices and inflation.
Many retirees like to stay close to relatives and, therefore, may choose to endure higher costs of living and taxes. Some retirees have to live with relatives to afford retirement, while some have the freedom to move. Much attention has been put on retirees fleeing states with higher overall taxes like New York and settling in states with lower overall taxes like Florida. Similarly, Colorado and Texas have been the main recipients of those fleeing California. When looking solely at tax consequences, states and localities with higher property taxes are worse for low-income people, while high-income households suffer more from high-income taxes. Of the two groups, high-income households tend to have more flexibility to move to another state or locality.
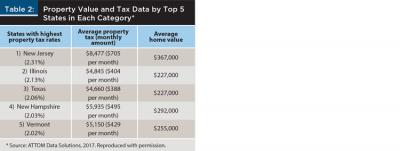
Table 2 provides information about states with high property tax rates and property tax revenues. In the first column, New Jersey has both the highest property tax rate (2.31 percent) and the higher average home value ($367,000), as well as the highest average property tax paid ($8,477 per year or $705 per month). Texas derives much of its state revenue from property taxes (with average rates of 2.02 percent and average taxes of $4,660 per year or $388 per month) but does not have a state income tax like the other high property tax states. Texas also has lower average home values than other states in the top five list. High property taxes would probably be more of a burden in localities where retiree incomes tend to be lower.
Based on the data provided in Tables 1 and 2 and Figures 1 and 2, the impact of property taxes on retirees would be based mostly on where the retiree lives and on how much income the retiree has to live on. Also, there has been a growing demand for reverse mortgages by retirees who choose to live off the equity they have in their home. These products normally do not have very favorable terms.
Another factor—low interest rates—tends to drive up home values, as shown by Schaub (2013). The same has happened again due to the response of the Federal Reserve to COVID-19. These low interest rates, which have fallen below 3 percent for the first time ever for 30-year mortgages, have fueled tremendous inflation in housing markets. Higher home values will eventually translate into even higher property taxes. According to the U.S. Census Bureau’s Quarterly Summary of State & Local Tax Revenue for 2020, annual property tax collections in the U.S. have reached nearly $650 billion while, at the height of the housing bubble in 2006, they totaled $377 billion. This represents a substantial increase in property taxes in a short period of time. While those who are not retired may benefit from investing in homes, selling them, and then moving to places that are more affordable to live when home prices increase, retirees who desire to stay in their homes to be near family and friends could suffer the consequences of living in areas where property tax increases are larger due to higher assessed home values for tax purposes.
Considerations/Recommendations
Many retirees rely only on Social Security as their source of income. The monthly SS payment depends on when someone retires and how much they made while working. According to the Social Security Administration, the maximum possible initial monthly benefit in 2020 for someone retiring at age 62 was $2,265. Those who retired at full retirement age (between 66 and 67 in most cases) could get up to $3,011, and those who waited until age 70 could get a maximum of $3,790. While not many retirees on Social Security receive the maximum benefit, most receive more than the minimum benefit of $897.90 per month (for those working at least 30 years). Social Security payments are also reduced by Medicare premiums.
According to Centers for Medicare & Medicaid Services, most workers have paid into the program for 40 or more quarters and receive Medicare Part A insurance at no cost. The amounts for Medicare Part B range from $144.60 per month for those who make less than $87,000 annually (which is the majority of Social Security beneficiaries) and goes up to $491.60 per month for those making over $500,000 per year (very few make this much after retiring). There are also deductibles and coinsurance amounts that must be paid when using Medicare Part B insurance. Many retirees also purchase supplemental insurance to pay the amounts that Medicare does not pay. Obviously, those depending more on Social Security, or with below median income levels from pensions, will have a much harder time paying the bills and can ill afford higher property taxes manufactured by housing market bubbles.
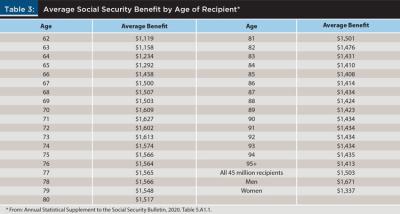
Considering the above, net of Medicare deductions and medical expenses, many retirees have less than $2,000 per month in disposable income. In fact, if the retiree is living on Social Security alone, Table 3 shows the average retiree only receives about $1,500 per month. Even living in a low-cost state, as far as food and necessities are concerned, a below-average to average property tax of $300 to $400 per month can eat up a considerable amount of the money retirees have to live on. Often, retirees who desire to remain independent have three options if taxes become unaffordable: (1) move to another city or state that is more affordable; (2) if the desire is to stay in the same town near relatives, downsize by selling the bigger home and buying a smaller one; and (3) do a reverse mortgage to help pay the higher tax bills while additionally eliminating the monthly mortgage payment (if the house hasn’t been paid off yet).
The three states with the highest total real estate values (California, Texas, and Florida due mostly to their size and housing markets) also lead the nation in the number of reverse mortgages. A reverse mortgage allows the retiree to live in the home, cease paying the monthly mortgage if the house was not yet paid off, and receive payments against the accumulated equity in the home. Before doing a reverse mortgage, the agreement should be thoroughly researched and understood because, depending on the details of the mortgage agreement, these can be predatory. If moving to another state or taking out a reverse mortgage are undesirable, then selling the current home and buying a smaller one can make inflated property values that influence property taxes easier to deal with. Also, if the current city or town of residence has unusually inflated home values, then the retiree can also move to a nearby city or town where lower property values equate to lower taxes.
A final consideration would be to research different counties (or parishes in Louisiana) to determine which offer the best reductions for older residents. For example, Bird (2020) comments that Houston allows residents in Harris County an extra $160,000 exemption above the normal state exemption of 20 percent for those 65 and older. New York allows a senior citizen exemption of 50 percent of the home’s appraised value if the resident is 65 or older and has a limited annual income (below $29,000). Anchorage, Alaska, and Honolulu also offer very large exemption increases based on the age of the resident. The above examples show that a retiree may be able to relocate to a different city in their current state of residence and receive a much-desired reduction in property taxes after retiring.
Conclusions
Many costs are anticipated by retirees. One expects higher medical bills. Also, retirees understand that inflation generally tends to be the biggest enemy of a retirement plan. However, inflation in home values that has been fueled by historically low interest rates tends to be much higher than average inflation rates in the economy overall. A retiree can simultaneously experience an extreme decrease in anticipated risk-free income from CDs, as many have seen with the drastic near-zero interest rates currently paid on deposits, as well as an ever-increasing property tax bill if the retiree lives in a high property tax state or locality. Many have not anticipated the dramatic increase in home values and property taxes when doing their retirement planning. This topic, as discussed in this article, therefore should become a normal component when advising retirees as to types of costs that can increase unexpectedly and cause a shortfall in disposable income needed to make ends meet.
Further research is needed to determine whether there are specific investments that could easily hedge against unexpected increases in property taxes due to higher assessments. Perhaps there are certain real estate investment trusts (REITs) with values and dividend rates tracking the housing market that can meet this need. Another option may be to move some money from low-interest-paying CDs to insured general obligation municipal bonds that generate tax-free income. Obviously, the ability to offset extra property taxes will depend on the economy and types of investments and returns available that also consider the risk tolerance of the retiree.
References
Annual Statistical Supplement to the Social Security Bulletin. 2020. Table 5.A1.1. www.ssa.gov/policy/docs/statcomps/supplement/2020/index.html. Accessed April 2021.
ATTOM Data Solutions. 2017, April 4. “States With Lowest and Highest Property Tax Rates.” www.attomdata.com/news/heat-maps/2016-property-tax-analysis/. Accessed April 2021.
Bird, Beverly. 2020, December 18. “Property Tax Exemptions for Older Adults.” The Balance. www.thebalance.com/property-tax-exemptions-for-seniors-4175584. Accessed April 2021.
Board of Governors of the Federal Reserve. 2019. Survey of Consumer Finances (SCF). www.federalreserve.gov/econres/scfindex.htm. Accessed April 2021.
Federal Housing Finance Agency. 2019. House Price Index. www.fhfa.gov/DataTools. Accessed November 2020.
S&P/Case-Shiller U.S. National Home Price Index. 2019. Federal Reserve Economic Data (FRED). https://fred.stlouisfed.org/series/csushpinsa. Accessed November 2020.
Schaub, M. 2011. “Bubbles, Bubbles, Toil and Troubles.” International Journal of Business Disciplines 22 (1): 15–17.
Schaub, M. 2013. “An Illustration of Home Affordability and Borrower Costs Associated with Mortgages Using Historical Rates.” Texas Business and Technology Educators Association Journal 12 (1): 85–92.
Social Security Administration. n.d. “Workers With Maximum-Taxable Earnings.” www.ssa.gov/oact/cola/examplemax.html. Accessed April 2021.
U.S. Bureau of Labor Statistics. 2019. Consumer Price Index for All Urban Consumers. Federal Reserve Economic Data (FRED). https://fred.stlouisfed.org. Accessed November 2020.
U.S. Census Bureau. 2020. Quarterly Summary of State & Local Tax Revenue, 1970–2020. www.census.gov/programs-surveys/qtax. Accessed February 2021.
Citation
Schaub, Mark, and H. Banker Phares. 2021. “Housing Bubbles and Near-Zero Interest Rate Environments That Inflate Property Taxes: An Unexpected Expense for Retirees?” Journal of Financial Planning 34 (9): 78–86
Acknowledgements: The idea for this paper was derived from consultations of the Stephen F. Austin State University Director of Financial Planning Programs with anonymous retirees in Texas who saw their property taxes get higher than their original mortgage payments. Based on the hardships communicated, we felt this issue to be an important one to address as part of the financial planning process. The authors thank Ana Trujillo Limón, former editor-in-chief, FPA Publications, for patient guidance and assistance throughout multiple revisions. The authors also thank three anonymous peer reviewers for helpful comments on earlier drafts of the paper. Likewise, we thank ATTOM Data Solutions for permission to utilize its data to help make the case for this work. Finally, the authors thank Madison Bowers of SFA’s Chadwick Student Financial Advisors and the firm of Fields Wealth Management for writing the five objective continuing education (CE) questions based on this paper. All errors are ours.