Journal of Financial Planning: November 2021
Executive Summary
- The most important financial issue retirees have to deal with is whether their strategy will be able to sustain all the withdrawals they expect to make and a bequest they aim to leave.
- It is critical to periodically monitor the evolution of a financial plan in order to detect early signs of trouble, which may lead a retiree to introduce dynamic adjustments to a strategy.
- To that purpose, this article features two tools, a sustainability test and the sustainable withdrawal, and shows how to apply them.
- This article also discusses the empirical evidence on both tools based on a comprehensive sample of 22 markets over a 120-year period.
Javier Estrada, Ph.D., is a professor of finance at IESE Business School in Barcelona, Spain. He is also a partner at Sports Global Consulting Investments, an independent financial advisory company; and he is the sole adviser of the investment strategy of Alpha Investments fund, a publicly traded mutual fund.
NOTE: Please click on images below for PDF versions.
JOIN THE DISCUSSION: Discuss this article with fellow FPA Members through FPA's Knowledge Circles.
FEEDBACK: If you have any questions or comments on this article, please contact the editor HERE.
The sustainability of a withdrawal strategy is arguably the most important financial issue that retirees have to deal with. If the withdrawals needed to sustain a desired lifestyle and bequest are not consistent with a retiree’s portfolio and its expected return, given the retiree’s life expectancy, then something must adjust. In fact, the most important goal of a financial plan should be to ensure that the withdrawals planned for the retirement years, including a target bequest, are consistent with a portfolio’s capacity to satisfy them.
Bengen’s (1994) seminal article on safe withdrawal rates inspired a massive literature that debates his 4 percent rule as well as many other withdrawal strategies subsequently proposed.1 Ultimately, Bengen aimed to highlight the importance of implementing a withdrawal strategy that does not deplete a portfolio earlier than a retiree planned. A strategy that is expected to sustain all the withdrawals a retiree expects to make during retirement, as well as the bequest they aim to leave, is referred to here as a sustainable strategy.
Typically, the way to evaluate the feasibility of a withdrawal strategy is to select a metric and evaluate its performance over a large number of historical or simulated retirement periods. For example, a strategy of withdrawing 4 percent from a 60–40 stock-bond portfolio at the beginning of retirement, followed by 29 annual inflation-adjusted withdrawals, has a historical failure rate of less than 5 percent in the U.S. and over 65 percent in Italy. That evidence may lead an American investor to embrace the strategy with confidence and an Italian investor to reject it outright.
The two approaches proposed here are different from that in the previous example in a critical way: They both aim to be dynamic and forward looking in the sense that a retiree can use them during retirement to periodically evaluate whether the withdrawal strategy implemented is sustainable (the sustainability test); or to periodically determine a sustainable level of inflation-adjusted withdrawals (the sustainable withdrawal). Importantly, both the sustainability of the strategy and the sustainable withdrawal can, and most likely will, change from period to period depending on the performance of the retirement portfolio.
To be clear, this article does not aim to develop an optimal withdrawal strategy. Rather, it aims to provide retirees and their advisers with two tools they can use periodically during retirement: One to calculate the sustainability of whatever withdrawal strategy they have chosen to implement; and another to calculate a sustainable level of inflation-adjusted withdrawals, which could be compared to whatever withdrawals they have chosen to make. Both tools, the sustainability test and the sustainable withdrawal, can be used as a signal to consider the introduction of dynamic adjustments aimed at reducing the probability of failure.
This article also explores the evidence, using a sample of 22 markets over 120 years, on the sustainability of different strategies and on sustainable withdrawals. The tables in the text and the appendix provide a comprehensive historical perspective on several variables related to both issues. In a nutshell, the following are some relevant results that stem from the evidence. First, and perhaps unsurprisingly, both failure rates and unsustainability rates have differed widely across countries; both rates also differed widely, for any given country, across initial withdrawal rates and asset allocations. Second, sustainable withdrawals have varied widely over time, across asset allocations, and across countries; the variability over time, in particular, renders the periodic level of sustainable withdrawals an implausible withdrawal strategy.
The rest of the article is organized as follows: The next section motivates the two tools featured here, the sustainability test and the sustainable withdrawal, with an example based on a global portfolio of stocks and bonds; introduces the analytical framework; and discusses some related literature. The section after that discusses the evidence for the 22 markets in the sample, with special emphasis on the World market and the U.S. market. The last section provides an assessment.
The Issue
Motivation
Just as important as having a good retirement plan is monitoring periodically whether the plan remains on track. Because the actual returns experienced by a retiree hardly ever will be those expected in the plan, it is critical to evaluate over time whether the plan remains feasible. This is precisely what the first tool featured in this article aims to do.
Table 1 shows the evolution of four portfolios (P), all starting with $1,000; having a 60–40 allocation to globally diversified stocks and bonds (essentially consisting of the World market in both asset classes), with an expected annualized real return of 4.2 percent; and subject to 30 annual withdrawals.2 All figures in the table are in real (inflation-adjusted) dollars. Panels A through C are based on a 4 percent initial withdrawal rate (IWR), followed by 29 annual inflation-adjusted withdrawals.
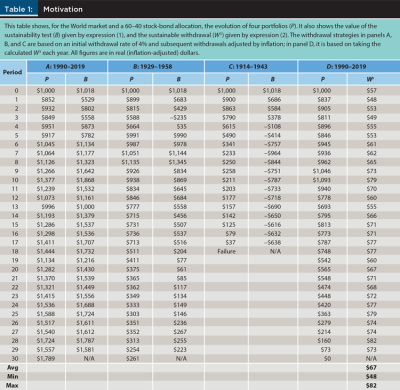
The first column of panel A, which focuses on the 1990–2019 retirement period, shows the evolution of the portfolio subject to the withdrawal strategy just mentioned; as the last row shows, the returns during this period were such that, besides satisfying all withdrawals, the strategy made it possible to leave a bequest of $1,789.
The second column of panel A shows the first tool featured here: the sustainability test. In words, this test asks, at the beginning of each year in retirement, what is the expected bequest (B), given a sequence of annual inflation-adjusted withdrawals from that point on, and given the size (and expected return) of the portfolio at that point? If the expected bequest is not negative (B ³ 0), then the strategy is sustainable; that is, it is expected to sustain all the withdrawals planned. The expression used to calculate B is discussed in the next section.
Panel B, based on the 1929–1958 retirement period, illustrates that it is possible for a strategy to become unsustainable, as it happens in period 3 (B = –$235 < 0), but eventually become sustainable again, as it happens in period 4. To elaborate, the situation at some point during retirement may be such that the strategy is expected to fail, but subsequent strong returns make the strategy feasible again. In this case, the strategy becomes sustainable again just one year after it first became unsustainable, even though the retiree did not adjust their withdrawals in response to the signal from the sustainability test (that is, they still withdrew $40).
Panel C, on the other hand, based on the 1914–1943 retirement period, illustrates that it is also possible for a strategy to become unsustainable (as it happens in period 4), to never become sustainable again, and to eventually fail (as it happens in period 18). Unlike the previous case, in which ignoring the signal from the sustainability test still enabled the retiree to make it through the end of their retirement and leave a bequest, in this case, ignoring the signal and not adjusting the withdrawals eventually leads to portfolio failure.
Panels B and C highlight that a strategy deemed to be unsustainable may or may not lead to portfolio failure. Put differently, failing the sustainability test provides a warning signal that a retiree may or may not decide to act upon. Cautious retirees may adjust their strategy right away, or at least keep a close eye on sustainability going forward; more adventurous retirees may refrain from adjusting their strategy and hope for a good run of returns that may restore the sustainability of their portfolio.
Finally, panel D, based on the 1990–2019 retirement period, illustrates the second tool featured in this article, the sustainable withdrawal (WS). The first column of the panel shows the evolution of the portfolio, which by design should end with an amount equal to the target bequest, which in this case is $0. The second column shows the sustainable withdrawal; that is, the level of inflation-adjusted annual withdrawals that, given the size (and expected return) of the portfolio at the beginning of each period, leaves the target bequest at the end of retirement.
To illustrate, in period 15, the retiree has an $813 portfolio. Thus, if over the 15 years left in their retirement, they withdraw an inflation-adjusted $71 every year, and their portfolio obtains its expected return (4.2 percent) every year, they will exhaust their portfolio by the end of 30 years, thus leaving their target bequest ($0 in this case). Importantly, note that this could hardly be an acceptable withdrawal strategy; the very large variability in the withdrawals calculated amounts to very large variability in purchasing power during retirement. The expression used to calculate WS is discussed in the next section.
That said, the sustainable withdrawal can help a retiree evaluate how much they may need to adjust their withdrawals if their strategy is deemed to be unsustainable. To illustrate, if the sustainability test determines that a strategy of withdrawing $50 every year is unsustainable, and the sustainable withdrawal calculated is $51, then the retiree may hope that future returns are somewhat higher than they expect and refrain from adjusting their strategy. If, on the other hand, the sustainable withdrawal is calculated at $25, then hoping for somewhat better returns in the future may not save this retiree from portfolio failure; they may need to adjust their strategy or will eventually deplete their portfolio earlier than planned.
Related Literature
The issues addressed in this article are broadly related to the literature on the evaluation of retirement strategies. Although the sustainability test and the sustainable withdrawal featured here are not really evaluation metrics, a historical (or simulation-based) perspective of their values, such as that provided below, can help to evaluate the feasibility of a withdrawal strategy.
The literature on the evaluation of retirement strategies began with Bengen’s (1994) seminal article, in which he aimed to determine a safe withdrawal rate. He found that an IWR of 4 percent, with subsequent annual withdrawals adjusted by inflation, is safe in the sense that (historically) it never depleted a balanced portfolio before 30 years, which he considered a minimum requirement for portfolio longevity. Bengen’s groundbreaking article marked the beginning of both the 4 percent rule as a withdrawal strategy and the failure rate as an evaluation tool; subsequent research expanded Bengen’s scope to different assets, time periods, countries, types of withdrawal strategies, and evaluation metrics.
Regarding evaluation metrics, it is important to note that however intuitive and widely used it may be, the failure rate is flawed in more than one way (Milevsky 2016), which has led to the development of several alternatives. Blanchett (2007) proposed the success-to-variability ratio; Blanchett, Kowara, and Chen (2012) proposed the sustainable spending rate; Suarez, Suarez, and Walz (2015) and Clare, Seaton, Smith, and Thomas (2017) proposed the perfect withdrawal amount; Estrada (2017, 2018a, 2018b, 2018c) proposed shortfall years, risk-adjusted success, the maximum withdrawal rate, and downside risk-adjusted success; and Estrada and Kritzman (2019) proposed the coverage ratio.
Frank and Blanchett (2010) are perhaps the closest reference to the issues discussed in this article. Although they propose a different metric (the probability of failure), their goal is, as it is here, to evaluate periodically during retirement whether a given strategy will be able to meet all the withdrawals and bequest contemplated in a financial plan.
Formal Background
This section borrows from the analytical framework developed by Estrada (2021).3 The analysis is based on a retirement portfolio P with an expected annualized real return R, a T-year retirement period, and T annual inflation-adjusted withdrawals (W) made at the beginning of each of the T years in retirement. After the last withdrawal, the portfolio compounds for one more year, and its terminal value becomes the bequest (B). Formally, at each time t, the relationship between the portfolio, its expected return, the withdrawals, and the bequest is given by
This expression yields the expected bequest and is the basis for the sustainability test; as long as the calculated value is not negative (Bt ³ 0), the strategy evaluated is deemed to be sustainable at the time (t) the evaluation is made.
To illustrate, in panel A of Table 1, at the end of the 10th year in retirement, with a $1,377 portfolio, an expected real return of 4.2 percent, and 20 inflation-adjusted withdrawals of $40 to be made, the expected bequest is equal to
which is the figure for period 10 in the second column of the panel. In words, at the end of their 10th year in retirement, the retiree’s withdrawal strategy is sustainable in the sense that the portfolio is not expected to be depleted before the end of the retirement period; in fact, the strategy is expected to leave a bequest of $1,868.
The calculation of the sustainable level of inflation-adjusted withdrawals (WS) follows from expression (1) after solving for W, which for any time t yields
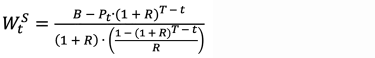
To illustrate, in panel D of Table 1, at the end of the 10th year in retirement, with a $1,093 portfolio, an expected real return of 4.2 percent, 20 inflation-adjusted withdrawals to be made, and a target bequest of $0, the sustainable inflation-adjusted withdrawal is equal to
which is the figure for period 10 in the second column of the panel. In words, at the end of their 10th year in retirement, the retiree can expect to make 20 inflation-adjusted withdrawals of $79 every year, exhaust their portfolio, and leave no bequest (which is what they intended).
Expressions (1) and (2) are the backbone of the two tools featured here. The former aims to periodically evaluate the sustainability of a withdrawal strategy, and the latter aims to periodically calculate the sustainable level of inflation-adjusted withdrawals. Importantly, both are expected to change over time depending on the value of the portfolio and the number of years left in retirement. Evidence on the sustainability of different withdrawal strategies, as well as on sustainable withdrawals, is discussed below for the 22 markets in the sample.
Evidence
Data and Methodology
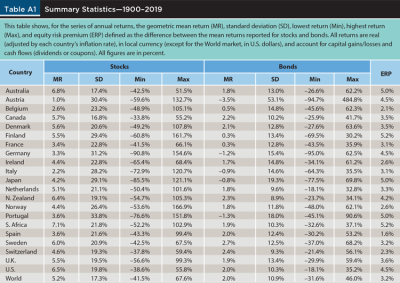
The sample is the Dimson-Marsh-Staunton (DMS) database, described in detail in Dimson, Marsh, and Staunton (2002) and in the annual updates of the database documentation. It contains annual returns for stocks and government bonds over the 1900–2019 period for 21 countries and the World market. Returns are real (adjusted by each country’s inflation rate), in local currency, and account for both capital gains/losses and cash flows (dividends or coupons). Real returns for the World market are in dollars and adjusted by the U.S. inflation rate. Table A1 in the appendix reports some summary statistics for all the series of stock and bond returns in the sample.
The analysis is based on a portfolio of 1,000 units of local currency at the beginning of retirement, a 30-year retirement period, and 30 annual withdrawals made at the beginning of each year in retirement. After the last withdrawal, the portfolio compounds for one more year, and its terminal value becomes the bequest. All returns and portfolio values are expressed in real (inflation-adjusted) terms. The first retirement period considered is 1900–1929 and the last one is 1990–2019, for a total of 91 rolling (overlapping) retirement periods.
The discussion of the sustainability test is based on a given IWR from the portfolio of 1,000 units of local currency and 29 subsequent inflation-adjusted withdrawals. The discussion of the sustainable withdrawal is based on 30 withdrawals, each calculated at the beginning of each year in retirement, and a target bequest of $0. In both discussions, several asset allocations are considered, consisting of fixed proportions of stocks and bonds, with annual rebalancing. The expected return for each asset allocation considered is set equal to the allocation’s long-term annualized return over the whole sample period (more on this in the “Some Further Comments” section).
The Sustainability Test—Base Case
Table 2 provides a historical perspective, over a 120-year period and for the 22 markets in the sample, of failure rates (F) and unsustainability rates (U) for a base-case scenario consisting of a 60–40 stock-bond portfolio and a 4 percent IWR. The unsustainability rate is simply defined as the number of retirement periods in which a strategy became unsustainable relative to the total number of retirement periods evaluated. The table also reports the average year in which a strategy first became unsustainable (Y) and the proportion of times in which the new sustainable withdrawal was at least 10 percent (D10) or 20 percent (D20) lower than the initial withdrawal.4
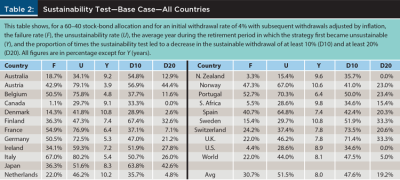
It should not be surprising that the failure rate varies dramatically across countries, from a low of 1.1 percent in Canada to a high of 67 percent in Italy. Among other reasons, this is because, as Table A1 shows, the equity risk premium also varies dramatically across countries, with a low of 1.6 percent for Spain and a high of 5.2 percent for Finland and South Africa, with an average of 3.7 percent across countries and 3.2 percent for the World. The average failure rate across countries is 30.7 percent and that for the World is 22 percent.5
The unsustainability rate also varies widely across countries, between a low of 15.4 percent for New Zealand to a high of 80.2 percent for Italy, with an average of 51.5 percent across countries and 44 percent for the World. Importantly, note that the unsustainability rate is based on when the strategy first became unsustainable. As panel B of Table 1 shows, that event does not necessarily imply that the strategy remained unsustainable from that point on, even if a retiree did not adjust their withdrawals. The goal of this part of the analysis is just to assess how often a given strategy first became unsustainable, and how long it took for that to happen.
Regarding this second point, note that the strategy considered in Table 2 became unsustainable, on average across countries, eight years into the retirement period, although that happened far sooner in Austria (after less than four years) and much later in Denmark and Sweden (where the strategy remained sustainable for almost 11 years). Finally, note that, on average across countries, 47.6 percent (19.2 percent) of the times that the strategy became unsustainable, a return to sustainability required lowering the initial withdrawal by at least 10 percent (20 percent).
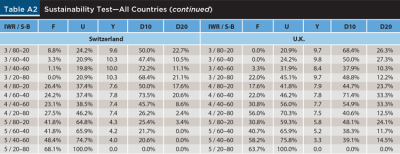
The Sustainability Test—Sensitivity Analysis
Table 3 expands the previous analysis, based on a 60–40 stock-bond portfolio and a 4 percent IWR, to several asset allocations and IWRs for both the World and the U.S. Unsurprisingly, for both markets, it is the case that, all else equal, higher IWRs and more conservative asset allocations lead to higher failure rates and unsustainability rates.
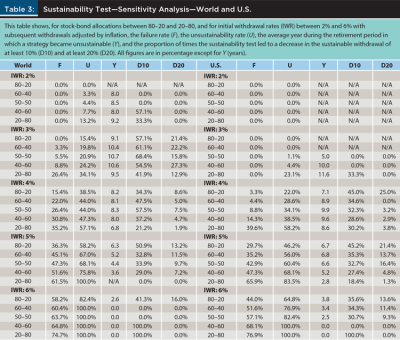
IWRs of 5 percent and 6 percent have what most retirees would consider unacceptable failure rates and unsustainability rates, even for aggressive portfolios. For the 80–20 allocation, a 5 percent IWR has a failure rate higher than 36 percent in the World and just under 30 percent in the U.S. For the same allocation and IWR, the unsustainability rate is over 58 percent in the World and over 46 percent in the U.S. In both markets, the strategy first became unsustainable six to seven years into retirement, requiring a decrease in withdrawals of at least 10 percent about half the time (over 50 percent in the World and over 45 percent in the U.S.) in order to restore sustainability.
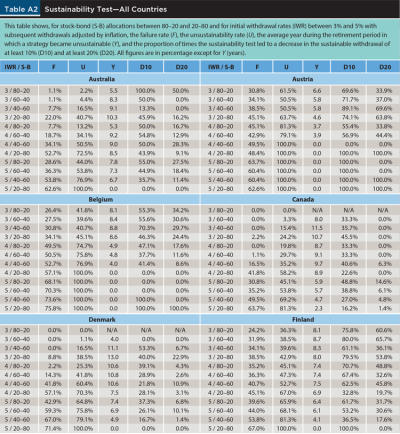
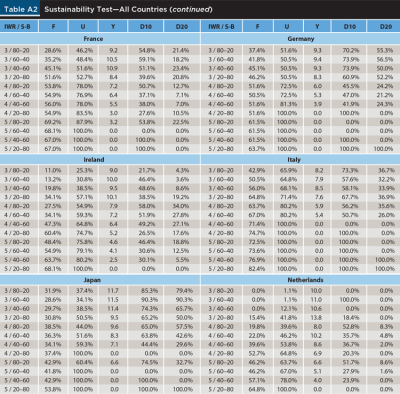
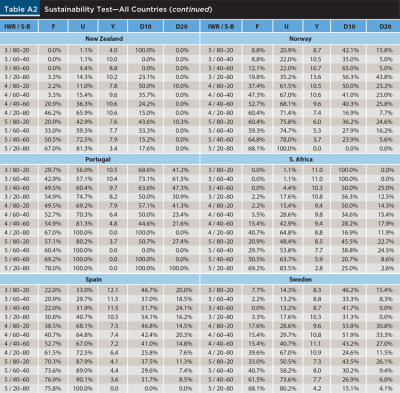
Table A2 in the appendix shows a similar sensitivity analysis for the rest of the countries in the sample. The results are obviously many and varied, but an interesting fact that the figures in the table highlight is that the experience of retirees has been substantially different across countries, being far better in countries like Canada, Denmark, and New Zealand than in countries like Austria, Germany, or Italy.
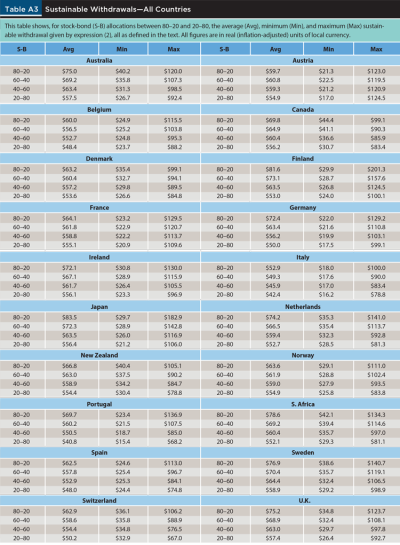
The Sustainable Withdrawal
When the sustainability test deems a strategy unsustainable, a retiree can easily calculate the new sustainable withdrawal (WS) with expression (2). In fact, they could even calculate it periodically in order to benchmark the withdrawals in their selected strategy to the sustainable level at each point in time. For the World and the U.S., Table 4 reports three figures that summarize historical levels of sustainable withdrawals for several asset allocations.
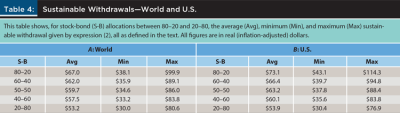
The numbers reported need some explanation. For any given market, 30 sustainable withdrawals are calculated, one per year, for each of the 91 retirement periods considered. Then, for each of those retirement periods, the 30 WS calculated are collapsed into three figures: the minimum, the maximum, and the average. The same is done for all the retirement periods considered, which leads to three series of 91 minimum, maximum, and average figures. The average of the minimum values (Min), the average of the maximum values (Max), and the average of the average values (Avg) are the figures reported in the table.
Unsurprisingly, the sustainable withdrawal increases with the proportion of stocks in the portfolio; more aggressive allocations deliver higher (long-term) returns, which translate into higher withdrawals. For example, just moving from a 40–60 to a 60–40 stock-bond portfolio would enable a retiree to increase their average sustainable withdrawal by almost 8 percent in the World and by over 10 percent in the U.S. Because the whole analysis is based on real returns, these figures imply an increase by the same amounts in purchasing power throughout retirement.
Table A3 in the appendix reports a similar analysis for the rest of the countries in the sample. As in Table A2, the results are many and varied. Perhaps an interesting result to highlight is that countries that were highlighted before as having provided a better experience for retirees (Canada, Denmark, and New Zealand) have a relatively small gap between the Min and Max sustainable withdrawals, implying less difference between good and bad retirement periods. On the other hand, countries highlighted before as having provided a worse experience for retirees (Austria, Germany, and Italy) have a much larger Min-Max gap, indicating the opposite.
Some Further Comments
The framework proposed in this article could be used by retirees and financial planners to periodically evaluate the sustainability of a financial plan during retirement. Because plans hardly ever develop as expected, this dynamic evaluation is critical to determine whether it is necessary to introduce adjustments aimed at restoring the viability of a plan. Estrada (2020a) shows that when adjustments need to be made, it is better to adjust withdrawals than to adjust the portfolio’s asset allocation; that result applies to the issues discussed in this article.
The analytical framework summarized by expressions (1) and (2) is based on an expected annualized return for the portfolio, which in the empirical implementation was set equal to the annualized historical return of the asset allocation considered. Obviously, this figure could be replaced by any expected return a retiree considers more plausible. It could also be replaced by sequences of (Monte Carlo) simulated returns, although that would imply changes in expressions (1) and (2) that would make them more cumbersome.
Finally, although part of the analysis is based on inflation-adjusted withdrawals that aim to keep purchasing power constant over time, this could be replaced by other policies, including dynamic strategies that periodically adjust withdrawals. The price to pay, again, would be having to deal with expressions more complicated than those discussed here.
Assessment
The main financial concern of retirees arguably is being able to sustain their desired standard of living in retirement, including a bequest they may want to leave. Because plans never go exactly as expected, retirees would be wise to periodically evaluate the sustainability of their plan and consider whether adjustments need to be made.
To that purpose, this article offers retirees and financial planners two tools: the sustainability test and the sustainable withdrawal. The former can be used to periodically test whether the strategy in place is expected to sustain all the withdrawals and bequest planned; the latter can be used to periodically determine the inflation-adjusted withdrawal that is expected to leave the retirement portfolio with the target bequest. Unlike other evaluation tools, such as the failure rate, these two tools can be used during retirement for periodic evaluations.
This article also provides an empirical perspective on both tools, using a comprehensive database of 22 markets over a 120-year sample period. For a base case consisting of a balanced 60–40 stock-bond portfolio and a 4 percent initial withdrawal rate, the evidence shows, on average across all the countries in the sample, a failure rate of 30.7 percent and an unsustainability rate of 51.5 percent. Clearly, these figures vary considerably across countries, as they do across initial withdrawal rates and asset allocations.
The evidence also shows that the base-case strategy first becomes unsustainable on an average of eight years into the retirement period, and that in 47.6 percent (19.2 percent) of those times, the decrease in withdrawals that would restore sustainability is at least as large as 10 percent (20 percent). It also shows that retirees in some countries had much better experiences than those in other countries, and that the former also had to bear less uncertainty as measured by the difference between good and bad retirement periods.
Retirees should always keep in mind that plans are unlikely to work as expected and that adjustments may need to be made along the way. The only way to detect departures from what was planned is to periodically monitor a financial plan using tools that provide an early signal of trouble down the road. The two tools featured in this article can hopefully help retirees and financial planners to deal with this problem.
Citation
Estrada, Javier. 2021. “The Sustainability of (Global) Withdrawal Strategies.” Journal of Financial Planning 34 (11): 82–98.
Endnotes
- The 4 percent rule refers to a strategy that withdraws 4 percent of the portfolio at the beginning of retirement and then adjusts all subsequent withdrawals by inflation, thus keeping purchasing power constant over time.
- The World market is a cap-weighted index of the 21 countries in the Dimson-Marsh-Staunton (DMS) database. Real returns are based on nominal returns and inflation rates as reported in the DMS database. (More on the data later.)
- That framework, in turn, borrows from the analytical frameworks developed in Estrada (2019, 2020a, 2020b) for the accumulation period, the withdrawal period, and the lifecycle.
- For any given country, a value of Y is calculated for each of the 91 retirement periods considered; the figure reported in the table is the average across those 91 retirement periods. D10 and D20 are calculated relative to the number of periods in which a strategy became unsustainable.
- Both Pfau (2010) and Estrada (2016) also provide a global perspective on failure rates across several countries.
References
Bengen, William. 1994. “Determining Withdrawal Rates Using Historical Data.” Journal of Financial Planning 7 (4): 171–180.
Blanchett, David. 2007. “Dynamic Allocation Strategies for Distribution Portfolios: Determining the Optimal Distribution Glide Path.” Journal of Financial Planning 20 (12): 68–81.
Blanchett, David, Maciej Kowara, and Peng Chen. 2012. “Optimal Withdrawal Strategy for Retirement Income Portfolios.” Retirement Management Journal 2 (3): 7–20.
Clare, Andrew, James Seaton, Peter Smith, and Stephen Thomas. 2017. “Reducing Sequence Risk Using Trend Following and the CAPE Ratio.” Financial Analysts Journal 73 (4): 91–103.
Dimson, Elroy, Paul Marsh, and Mike Staunton. 2002. Triumph of the Optimists: 101 Years of Investment Returns. Princeton University Press.
Estrada, Javier. 2016. “The Retirement Glidepath: An International Perspective.” Journal of Investing 25 (2): 28–54.
Estrada, Javier. 2017. “Refining the Failure Rate.” Journal of Retirement 4 (3): 63–76.
Estrada, Javier. 2018a. “From Failure to Success: Replacing the Failure Rate.” Journal of Wealth Management 20 (4): 9–21.
Estrada, Javier. 2018b. “Maximum Withdrawal Rates: An Empirical and Global Perspective.” Journal of Retirement 5 (3): 57–71.
Estrada, Javier. 2018c. “Replacing the Failure Rate: A Downside Risk Perspective.” Journal of Retirement 5 (4): 46–56.
Estrada, Javier. 2019. “Managing to Target: Dynamic Adjustments for Accumulation Strategies.” Journal of Financial Planning 32 (8): 46–53.
Estrada, Javier. 2020a. “Managing to Target (II): Dynamic Adjustments for Retirement Strategies.” Journal of Retirement 7 (4): 28–38.
Estrada, Javier. 2020b. “Retirement Planning: From Z to A.” Journal of Retirement 8 (2): 8–22.
Estrada, Javier. 2021. “Sequence Risk: Is It Really a Big Deal?” Journal of Investing 30 (6): 47–69.
Estrada, Javier, and Mark Kritzman. 2019. “Toward Determining the Optimal Investment Strategy for Retirement.” Journal of Retirement 7 (1): 35–42.
Frank, Larry, and David Blanchett. 2010. “The Dynamic Implications of Sequence Risk on a Distribution Portfolio.” Journal of Financial Planning 23 (6): 52–61.
Milevsky, Moshe. 2016. “It’s Time to Retire Ruin (Probabilities).” Financial Analysts Journal 72 (2): 8–12.
Pfau, Wade. 2010. “An International Perspective on Safe Withdrawal Rates: The Demise of the 4% Rule?” Journal of Financial Planning 23 (12): 52–61.
Suarez, Dante, Antonio Suarez, and Daniel Walz. 2015. “The Perfect Withdrawal Amount: A Methodology for Creating Retirement Account Distribution Strategies.” Financial Services Review 24 (4): 331–357.
Appendix