Journal of Financial Planning: February 2022
Executive Summary
- Between 2007 and 2009, American aggregate household wealth declined by 20 percent (Dettling, Hsu, and Llanes 2018). By 2012, however, aggregate household wealth surpassed its 2007 peak and continued to increase through 2016. Although the Great Recession and its subsequent recovery has been extensively studied, little is known about the association between changes in wealth during these periods and changes in bequest expectations.
- Based on Hurd and Smith’s (2001) model of consumption and saving, we expected a positive relationship between changes in wealth and changes in bequest expectations. The purpose of this study was, however, to explore whether a modest or significant decline in wealth that occurred during the Great Recession was linked with a drop in bequest expectations. Similarly, this study investigated the magnitude of wealth increases during the recovery that were associated with a return to expectations held prior to the Great Recession.
- Using data from the Health and Retirement Study (HRS), this research found that during the Great Recession, both significant and modest declines in wealth were associated with a drop in bequest expectations. However, no relationship was found between increases in wealth and a rise in bequest expectations. Following the Great Recession, only wealth increases at the highest end of the distribution were associated with a return to previously held bequest expectations.
- Financial planners can use these results to better understand shifts in bequest expectations during various economic cycles and provide the necessary interventions to help clients meet their long-term wealth transfer goals and objectives.
Matthew Sommer, Ph.D., CFP®, CFA, is the head of Janus Henderson Investors’ Defined Contribution and Wealth Advisor Services group. He received his B.S. from the University of Rhode Island, M.B.A. from Pace University, and Ph.D. from Kansas State University. He can be contacted at 151 Detroit St., Denver, CO 80206; Email HERE; (303) 336-4046.
HanNa Lim, Ph.D., CFP®, is an assistant professor at Kansas State University. She received her B.A. from Seoul National University, M.A. from Seoul National University, and Ph.D. from the Ohio State University. She can be contacted at Justin Hall, Manhattan, KS 66506; Email HERE; (785) 532-5510.
JOIN THE DISCUSSION: Discuss this article with fellow FPA Members through FPA's Knowledge Circles.
FEEDBACK: If you have any questions or comments on this article, please contact the editor HERE.
Although the exact number is elusive, making a bequest is an expectation shared by many Americans. Bank of America Merrill Lynch (2020) estimated that nearly six out of 10 adults ages 55 and older plan to make a bequest to their heirs. Among single retirees ages 70 and older, Kopczuk and Lupton (2007) found that nearly 75 percent had a bequest motive and compared to those with no intention of making a bequest spent, on average, 25 percent less annually. Ellis (2013) reported that parents expected to leave an average inheritance of $177,000. While individuals may leave their wealth to whomever they wish, children appear to be the primary beneficiaries. Almazora (2018) reported that over the next 25 years, 88 percent of wealth transfers will be made to children, while 12 percent will be made to other family members, friends, and charities.
Expectations regarding bequests may change over time for various reasons including a shift in intra-family relationships, a growing desire to leave more assets to charity, or an increase or decrease in wealth. Financial planners can be instrumental in helping clients understand how changes in financial and nonfinancial assets may impact their future plans. In the case of bequests, if a client fails to reasonably adjust their expectations following a dramatic change in wealth, the financial planner may need to intervene. Potential strategies may include providing additional education or reviewing the client’s previously stated wealth transfer goals and objectives.
Even for clients who recognize the need to reassess their original intentions, assistance may be needed to decide whether and how to communicate a potentially difficult message to their children. This communication can be critical because children’s expectations regarding bequests do not always match reality. Ameriprise (2017) found that among respondents who received a bequest, the majority expected more than $100,000, when in fact the majority received less than $100,000. The misalignment between parent and child bequest expectations can lead to hurt feelings, resentments, and strained relationships (Grant 2016).
This study investigated two research questions. The first research question is, “What was the relationship between changes in wealth and a change in bequest expectations during the Great Recession?” Based upon Hurd and Smith’s (2001) model of consumption and saving, we expected decreases in wealth to be related to a drop in bequest expectations. The purpose of this study, however, was a deeper exploration of whether a modest or significant decline in wealth that occurred during the Great Recession was linked with lower bequest expectations. The second research question is, “What was the relationship between wealth changes following the Great Recession and a return to pre-recession bequest expectations?” Following the Great Recession, wealth levels recovered albeit unevenly (Dettling, Hsu, and Llanes 2018). Based on Hurd and Smith’s (2001) model, we expected that increases in wealth during this period would be associated with a rise in bequest expectations. The research interest of this study, however, was to determine the magnitude of increases in wealth that were associated with a return to bequest expectations held prior to the Great Recession.
While the impact and aftermath of the Great Recession and the relationship with financial well-being have been extensively studied, surprisingly little is known about the potential impact on bequest expectations. This study’s findings may help close the gap within the existing literature, while providing financial planners with additional insights to help guide their clients through various economic cycles.
Theoretical Framework
The theoretical framework used to guide this study was Hurd and Smith’s (2001) model of consumption and saving. According to the model, expected bequests were a function of wealth, the subjective discount rate, and mortality risk. The greater an individual’s wealth and mortality risk, the greater the expected bequest. Conversely, the higher the discount rate, the lower the expected bequest. This model may be used regardless of whether or not a bequest motive is present. In the case of an individual without a bequest motive, any received inheritance is purely accidental. For example, a person who is risk averse and thus has a low discount rate may leave a sizeable bequest given their propensity to dissave at a conservative rate. In the case of an individual with a bequest motive, the consumption path over the life cycle would flatten, transferring more resources to wealth. The stronger the bequest motive, the larger the transfer of resources from consumption to wealth.
According to Hurd and Smith (2001), over a multiyear period, anticipated changes of wealth are not related to changes in expected bequests. For example, as retired individuals with no bequest motive age, their wealth decreases. The decrease in wealth is anticipated and therefore, there should be no relationship between a change in wealth and change in bequest expectations. On the other hand, an unexpected increase in wealth will revise bequest expectations upward, while an unexpected decrease in wealth will revise bequest expectations downward. The relationship regarding unexpected changes in wealth is the same for individuals with a bequest motive. The primary difference is that the wealth of individuals with a bequest motive does not necessarily decline with age and may even increase.
To test the model, Hurd and Smith (2001) analyzed data from the 1993 and 1995 waves of the Study of Assets and Health Dynamics Among the Oldest Old (AHEAD) and the 1994 and 1996 waves of the Health and Retirement Study (HRS). The purpose of analyzing two consecutive waves was to identify how changes in certain household characteristics may have been associated with changes in bequest expectations. Overall, changes in wealth had a positive relationship with changes in bequest expectations for both cohorts, but the magnitude was small. To assess the impact of unexpected changes in wealth, the net increase in stock investments between waves was used as a proxy for unexpected capital gains. The relationship between changes in unexpected capital gains was much more substantial than changes in total wealth.
Literature Review
The following literature review covers three major areas. First is a description of how individuals have been found to prioritize bequests as a luxury good and, relatedly, how only households at the upper end of the wealth distribution have been associated with expectations of leaving an inheritance. The second part of the literature review explores how the Great Recession impacted individual wealth levels and how the subsequent economic recovery was not experienced similarly among U.S. households. The final part will discuss the relationship between changes in wealth and changes in bequest expectations during the Great Recession.
The Relationship Between Wealth and Bequest Expectations
Research has found that individuals save for multiple goals in a sequential, rather than concurrent, structure (O’Neill et al. 2019). For example, Xiao and Noring (1994) found that individuals prioritize their savings according to a hierarchy. This hierarchy ensures that the most basic needs are satisfied before moving on to the next priority. Xiao and Noring (1994) suggested a normative savings hierarchy that begins with daily expenses before transitioning to large purchases, emergency funds, saving for retirement, gifting to children or grandchildren, and finally achieving a better life. Devaney, Anong, and Whirl (2007) used a similar construct consisting of no savings, basic needs, safety needs, security in the future, love and societal needs, esteem and luxury needs, and self-actualization. Only after all the lower needs are satisfied might individuals self-actualize to reach their fullest potential. Providing for family and charities was included in the self-actualization category. Crook and Baredes (2015) suggested a wealth allocation consisting of three savings buckets: liquidity, longevity, and legacy. In this approach, only “excess assets,” if any, are deployed to the legacy bucket.
Given that most individuals considered bequests a higher order savings priority, research has found, perhaps not surprisingly, that only the wealthiest of individuals were likely to have bequest expectations. Using a sample of 6,051 respondents from AHEAD, McGarry (1997) found that both wealth and income were positively related to the self-reported probability of making any bequest, making a bequest of at least $10,000, and making a bequest of at least $100,000. These OLS regression models controlled for child-level demographics including income, age, and schooling. Across all three minimum bequest amounts, subjective life expectancy was positively related to probability of making a bequest while the number of children was negatively related to the probability of making a bequest. A similar study pooled the 2012 and 2014 waves of the HRS (Fan and Chatterjee 2018). In this analysis, the wealth variables included business equity, retirement assets, checking and savings accounts, CDs, bonds and T-bills, investments, and primary residence. All the wealth variables and income were positively related to the self-reported probability of making any bequest. A sub-analysis that examined six different generational cohorts consistently found a positive relationship between checking and savings assets and income with the self-reported probability of making any bequest. The sub-analysis also found that mortgage and other debt were negatively related to the self-reported probability of making any bequest for all generations except those born before 1924.
Using five waves of data from the 1998 through 2010 iterations of the Survey of Consumer Finances (SCF), DeBoer and Hoang (2017) found income and net worth were positively associated with the expectation of making a bequest. The results were consistent among restricted samples of married respondents, unmarried respondents, life insurance owners, and non-life insurance owners. Similar findings regarding the relationship between financial resources and bequest expectations were found in Sweden (Erixson and Ohlsson 2019), Ireland (Nivakoski 2018), and Japan (Hamaaki, Hori, and Murata 2018).
Another study investigated the relationship between changes in housing wealth and changes in bequest expectations for the period 1977 through 2011 (Hoang 2016). A fixed effects regression model found an increase in home values was positively related to an increase in life insurance death benefits. Specifically, a 50 percent increase in home values was related to a 13 percent increase in life insurance death benefits. A second analysis accounted for the varying time intervals between changes in home values and changes in life insurance death benefits. The results found that households do not immediately adjust their life insurance policies, but rather, respond over time. A final analysis made a comparison of states above or below the national average regarding the fraction of the population over age 64, housing price growth, gross state product per capita, estate tax revenue per capita, and the married population. The results were consistent with the study’s main findings.
The Impact of the Great Recession and Uneven Recovery
Between 2007 and 2009, American aggregate household wealth declined by 20 percent (Dettling, Hsu, and Llanes 2018). By late 2012, however, aggregate household wealth surpassed its 2007 peak and continued to increase through 2016. A closer examination reveals that the Great Recession and its subsequent recovery was not similarly experienced by all Americans. Using data from the Survey of Consumer Finances (SCF), respondents were divided into four cohorts by permanent income. The categories were bottom 30 percent, middle 30 percent, next 30 percent, and top 10 percent. From the period 2007 through 2010, all four cohorts suffered a decline in inflation-adjusted wealth, however, the top cohort lost, on average, 14 percent. Among the other three income cohorts, the bottom 30 percent lost 10 percent, the middle 30 percent lost 40 percent, and the next 30 percent lost 22 percent. There were two reasons that accounted for this disparity. First, higher income individuals held considerable assets other than housing and stocks, and very few had mortgages that exceed 80 percent of their homes’ value. Second, the recovery from the Great Recession impacted Americans unevenly. From the period 2007 through 2016, the bottom 90 percent cohort had still not recovered from the Great Recession while the top 10 percent cohort’s average inflation-adjusted wealth increased by 11 percent. In sum, the researchers concluded that the outsized gains of the top 10 percent cohort accounted for the increase in the aggregate household wealth measure.
A similar study by the Federal Reserve Bank of St. Louis (2020) divided households into wealth quartiles using data from the Survey of Consumer Finances: the top 1 percent, the next 9 percent, the next 40 percent, and the bottom 50 percent using data from the SCF. This study found that the bottom 50 percent suffered the greatest decline in wealth, approximately 42 percent, primarily due to the collapse of housing prices. This group took a decade to recover but the top 50 percent recovered their wealth in approximately four to five years.
The Great Recession and the Impact on Bequest Expectations
To investigate the impact the Great Recession may have had on bequest expectations, Hurd and Rohwedder (2010) analyzed the 2008 HRS wave and the 2009 HRS Internet Survey. The internet survey was administered between March 2009 and August 2009 to individuals who completed the 2008 interview and who regularly use the internet. The internet survey included a module to assess the impact the economy had on respondents since the 2008 interview. Similar to the 2008 core interview, internet respondents were asked about the probability of leaving a bequest of at least $10,000. Those respondents who answered greater than zero were then asked about the probability of leaving a bequest of at least $100,000. Respondents who answered greater than zero were then asked about the probability of leaving a bequest of at least $500,000. Among 3,061 respondents who completed both surveys, the percentage of those who expected to leave a bequest of less than $100,000 increased from 36.0 percent in 2008 to 44.1 percent in 2009. On the other hand, those who expected to leave a bequest of at least $100,000 decreased from 64.0 percent in 2008 to 55.9 percent in 2009. Hurd and Rohwedder (2010) also estimated the change in expected bequest amounts. For each wealth band, expected bequest amounts were calculated by multiplying the average wealth observed for that wealth band by the probability of making a bequest. Overall, expected bequests declined from $535,517 in 2008 to $435,996 in 2009.
A similar study was conducted among retirees in England (Banks, Crawford, Crossley, and Emmerson 2013). This analysis used the English Longitudinal Study of Ageing, which surveys individuals ages 50 and older. Researchers compared two separate waves: 2006–2007 and 2008–2009. The 2008–2009 wave was divided between two cohorts: those surveyed between June 2008 and December 2008 and those surveyed between January 2009 and June 2009. The sample sizes were 4,046 and 3,254, respectively. Combined, the median respondent wealth in the 2008–2009 wave dropped by 8 percent compared to the 2006–2007 wave, but a larger drop was experienced by respondents who were interviewed in the first half of 2007 and again in the first half of 2009. Among this cohort, the self-reported probability on a scale of zero (absolutely no chance) to 100 (absolutely certain) of leaving a bequest of at least £150,000 declined as a whole. Specifically, 38 percent of respondents reported that the probability had decreased since 2007, while 28 percent reported that the probability increased. The remaining 34 percent reported no change. The average probability declined by 3.5 percent.
Using the 2000 through 2010 waves of the HRS, Begley (2017) assessed how the housing boom and bust impacted bequest expectations. To operationalize the changes in housing values, data were obtained from Zillow and the Federal Housing Financing Agency (FHFA). Zillow provided monthly median market values for homes based on ZIP codes. This information was supplemented by FHFA MSA-level repeat sales indices. The study’s primary dataset was a geocoded Health and Retirement Study (HRS). The geocoded HRS, which is not publicly available, provided the opportunity to investigate how changes in local housing markets affected older adult bequest expectations.
The dependent variables were the changes in the probability of leaving any inheritance, changes in the probability of leaving an inheritance of at least $10,000, and changes in the probability of leaving an inheritance of at least $100,000. A significant positive relationship was found between the changes in home prices and changes in bequest expectations for all three models. The effect was larger for negative shocks than positive shocks and was more pronounced for older respondents. An additional model was specified that used respondents’ self-reported home values as the variable of interest. Similar to the study’s main findings, changes in self-reported home values were positively related to changes in bequest expectations.
Research Questions and Hypotheses
This study’s first research question is, “What was the relationship between changes in wealth and a change in bequest expectations during the Great Recession?” Based upon Hurd and Smith’s (2001) model of consumption and saving, the recession’s adverse and unexpected impact on wealth was anticipated to be related to lower bequest expectations. The hypothesis under investigation, therefore, is:
H1: There is a positive relationship between changes in wealth and changes in bequest expectations during the Great Recession.
This study’s second research question is, “What was the relationship between wealth changes following the Great Recession and a return to pre-recession bequest expectations?” Based on Hurd and Smith’s (2001) model of consumption and saving, a rebound in personal wealth following the Great Recession was anticipated to be associated with a rise in bequest expectations. The hypothesis under investigation, therefore, is:
H2: There is a positive relationship between increases in wealth following the Great Recession and a return to pre-recession bequest expectations.
Methodology
Data
The dataset used for this study was the Health and Retirement Study (HRS). The HRS is a nationally representative longitudinal study of more than 43,000 individuals over age 50 (Fisher and Ryan 2018). The HRS was established to provide a national resource for data on the changing health and economic circumstances associated with aging in the United States (Sonnega et al. 2014). The HRS biannual interview consists of several broad topics including employment history, retirement, earnings, pensions, housing, assets, liabilities, estate planning, expectations of future events, demographic characteristics, and health status. The rich information collected by the HRS makes it an ideal dataset to study the estate planning behaviors of older Americans (James 2015).
The HRS sample is based upon a multistage area probability design involving geographical stratification and clustering. Additionally, African Americans and Hispanics are oversampled. The major implication of this survey design is that individuals and households have different probabilities of being selected into the sample (Sonnega et al. 2014). As a result, inferences to the U.S. population will be biased. To generate accurate point estimates, standard errors, and to generalize the results across the U.S. population, this study used sample weights and sample design information (Nielsen and Seay 2014).
To make the HRS data more accessible to researchers, the RAND Center for the Study of Aging makes available several data products (RAND 2021). This study used the RAND Longitudinal file, which provides a single, user-friendly file derived from all waves of the HRS. The file contains cleaned, respondent-level data with intuitive naming conventions. An imputing methodology is employed by RAND to handle any missing data.
Sample
To capture the impact of the Great Recession and the subsequent recovery, data were utilized from the 2008, 2010, and 2016 waves of the Health and Retirement Study (HRS). Specifically, 2008 was used to mark the beginning of the Great Recession and 2010 to mark the end of the Great Recession. To assess wealth changes after the recession, the period from 2010 to 2016 was used. The 2016 wave was chosen because it was the last wave to include the most recent version of the RAND longitudinal data file. Because this study’s research interest was about the relationship between changes in wealth and changes in bequest expectations, only those respondents who participated in all three waves were included in the analysis. Additionally, only financial respondents with at least one child were included. The final sample was 3,839 respondents.
Dependent Variables
The dependent variable for the first research question was coded as yes or no to indicate whether the respondent’s expected minimum bequest decreased from 2008 to 2010. The dependent variable for the second research question was coded as yes or no to indicate whether the respondent’s 2016 expected minimum bequest was equal to or greater than their 2008 expected minimum bequest.
To calculate the expected minimum bequest, an approach similar to Hurd and Rohwedder (2010) was used. The HRS asked a series of questions regarding bequest expectations. First, respondents were asked, “Think about an inheritance you and your (husband/wife/partner) might leave but not including any inheritance you might leave to each other. Including property and other valuables that you might own, what are the chances that you and your (husband/wife/partner) will leave an inheritance totaling $10,000 or more?” Respondents’ answers ranged from zero for absolutely no chance to 100 for absolutely certain. For respondents who answered greater than zero, the question was repeated, only the bequest target was $100,000 or more. For respondents who answered greater than zero, the question was repeated again with a bequest target of $500,000 or more. For each item, the probability of leaving an inheritance was multiplied by the bequest target, and the sum for the three items represented the respondents’ expected minimum bequest. For example, if a respondent replied that there was a 50 percent chance of leaving an inheritance of at least $10,000, a 25 percent chance of leaving an inheritance of at least $100,000, and a 0 percent chance of leaving an inheritance of at least $500,000, the expected minimum bequest was calculated as $30,000.
Variables of Interest
The variables of interest were the changes in household net worth from 2008 to 2010 for the first research question and from 2010 to 2016 for the second research question. Household net worth was calculated as assets minus liabilities. Assets consisted of real estate, business interests, and investable assets such as stocks, bonds, and cash. Liabilities consisted of mortgages, home equity loans, other debt, and mortgages on second homes. To assess how the varying degrees of net worth changes may have been associated with a change in bequest expectations, the change in net worth was categorized in deciles.
Control Variables
For both research questions, the respondents’ most recent net worth was used as a control variable. To adjust for positive skewness and because of negative values, net worth was transformed using an inverse hyperbolic sine function (Pence 2006). Also, for research question two only, the change in net worth from 2008 to 2010, categorized in deciles, was included to control for the impact of the recession. The respondents’ most recent income was also used as a control variable for both research questions. Income was the sum of household earnings, pensions, annuities, Social Security payments, unemployment benefits, workers compensation, other government transfers, capital income, and other income. The log of income was used because of positive skewness and was coded as a continuous variable.
Age was coded as a continuous variable and age squared was included to allow for a non-linear relationship between age and the dependent variable. Marital status was coded as a categorical variable that included single and couple. Self-reported health was coded as a categorical variable that included poor or fair, good, and very good or excellent. Employment status was coded as a categorical variable that included fully retired, partially retired, and not retired. Education attainment was coded as a categorical variable that included less than high school, high school, some college or college graduate, and postgraduate. Ethnicity was coded as white or non-white, and gender was coded as female or male.
Analysis
To investigate the relationship between changes in net worth and a change in bequest expectations, two logistic regression models were specified. A logistic regression model is appropriate when the dependent variable is binary (Allison 2012). For the first research question, the model can be expressed with the formula:
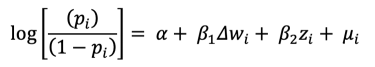
where pi is the probability that the respondent’s expected minimum bequest was lower in 2010 compared to 2008. Further, Dw represents the change in net worth from 2008 to 2010, categorized by deciles, and z is a vector of the control variables. For the second research question, the model can be expressed with the formula:
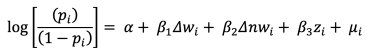
where pi is the probability that the respondent’s expected minimum bequest in 2016 was equal to or greater than the expected minimum bequest in 2008. Further, Dw represents the change in net worth from 2008 to 2010, categorized by deciles, Dnw represents the change in net worth from 2010 to 2016, categorized by deciles, and z is a vector of the control variables.
Results
Descriptive Statistics
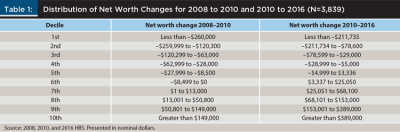
The descriptive statistics for this study are illustrated in Tables 1, 2, and 3. The distribution of changes in net worth from 2008 to 2010 and from 2010 to 2016, categorized in deciles, can be found in Table 1. This table illustrates that the distribution of net worth changes during the Great Recession was negatively skewed, while the distribution of net worth changes for the six-year period following the Great Recession was positively skewed.
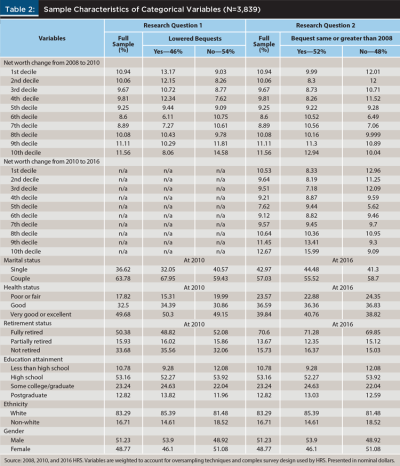
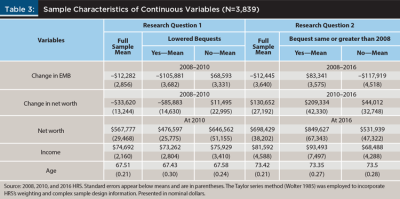
Tables 2 and 3 illustrate the descriptive statistics for the categorical and continuous variables, respectively. Regarding the first research question that investigated the change in bequest expectations from 2008 to 2010, 46 percent of respondents lowered their expected minimum bequest, while 54 percent raised or maintained their expected minimum bequest. Regarding the latter, 31 percent of respondents raised their expected minimum bequest, while 69 percent maintained their expected minimum bequest. The average expected minimum bequest decreased by $12,282. Among those who lowered their bequest expectations from 2008 to 2010, the average expected minimum bequest declined by $105,881. Among those who maintained or raised their bequest expectations from 2008 to 2010, the average expected minimum bequest increased by $68,593.
The distribution of net worth changes from 2008 to 2010 showed that 57 percent of respondents experienced a decrease in wealth, while 43 percent experienced an increase in wealth. The average decrease in net worth was $33,620. Among those whose wealth decreased, 29 percent lowered their expected minimum bequest, while 28 percent maintained or raised their expected minimum bequest. Among those whose wealth increased, 26 percent maintained or raised their expected minimum bequest, while 17 percent lowered their expected minimum bequest.
Almost two-thirds of respondents were married or partnered (64 percent), and half (50 percent) reported very good and excellent health. Approximately one-third of respondents were not retired (34 percent) and attained some level of post-secondary education (36 percent). The sample was overwhelmingly white (83 percent) and evenly split between gender.
Regarding the second research question that investigated the change in bequest expectations from 2008 to 2016, 52 percent of respondents maintained or raised their expected minimum bequest, while 48 percent lowered their expected minimum bequest. Regarding the former, 70 percent of respondents raised their expected minimum bequest, while 30 percent maintained their expected minimum bequest. The average expected minimum bequest decreased by $12,445. Among those who maintained or raised their bequest expectations, the average expected minimum bequest increased by $83,341. Among those who lowered their bequest expectations, the average expected minimum bequest decreased by $117,919.
The distribution of net worth changes from 2010 to 2016 showed that 56 percent experienced an increase in wealth, while 44 percent experienced a decrease in wealth. The average increase in net worth was $130,652. Among those whose net worth increased, 32 percent had a 2016 expected minimum bequest equal to or greater than their 2008 expected minimum bequest, while 24 percent had a 2016 expected minimum bequest lower than their 2008 expected minimum bequest. Among those whose net worth decreased, 21 percent had a 2016 expected minimum bequest equal to or greater than their 2008 expected minimum bequest, while 23 percent had a 2016 expected minimum bequest lower than their 2008 expected minimum bequest.
Logistic Regression Models
The results of the first research question’s logistic regression model are illustrated in Table 4. The model’s Wald chi-squared was 4.80, the adjusted R-squared was 0.058, and the c-statistic was 0.608. Among the variables of interest, any decrease in net worth was positively related to a lowering of bequest expectations compared to the reference group who experienced a relatively unchanged net worth. Specifically, the odds of lowering bequest expectations for respondents in the bottom four deciles (experienced a decrease in net worth of $28,000 or more) were approximately two times greater compared to the reference group. The odds of lowering bequest expectations for respondents in the fifth decile (experienced a modest net worth decrease between $8,500 and $28,000) were 60 percent higher compared to the reference group.
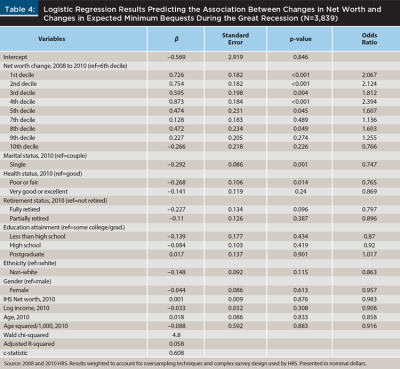
On the other hand, increases in net worth were not associated with maintaining or raising bequest expectations. In fact, marginal evidence found that respondents in the eighth decile (experienced a net worth increase between $13,001 and $50,800) were positively associated with a lowering of bequest expectations. Among the control variables, single respondents and respondents in poor or fair health were more likely to maintain or raise bequest expectations during the Great Recession.
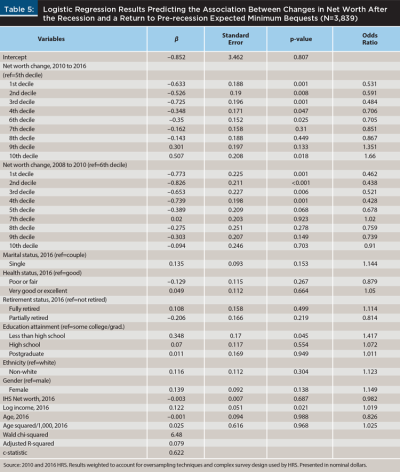
The results of the second research question’s logistic regression model are illustrated in Table 5. The model’s Wald chi-squared was 6.48, the adjusted R-squared was 0.079, and the c-statistic was 0.622. Among respondents who experienced an increase in net worth from 2010 to 2016, only those in the 10th decile (experienced a net worth increase greater than $389,000) were associated with bequest expectations equal to or greater than pre-recession bequest expectations. Specifically, the odds of 2016 bequest expectations being at least as high as those held in 2008 were 66 percent higher for respondents in the 10th decile compared to the reference group who had a relatively unchanged net worth. Respondents in the first six deciles (experienced a decrease in net worth or an increase in net worth no greater than $25,000) were likely to have bequest expectations that were lower than those held prior to the recession. Among the control variables, income was positively related to having a 2016 bequest expectation equal to or greater than the 2008 bequest expectation.
Discussion
During the Great Recession, respondent average net worth decreased by $33,620, while the average expected minimum bequest declined by $12,282. At first glance, these results appear to validate this study’s hypothesis of a positive relationship between changes in wealth and a change in bequest expectations. The first logistic regression model, however, told an interesting story. As expected, a decrease in net worth was associated with a lowering of bequest expectations. The model indicated that even a modest decrease in net worth of between $8,500 and $28,000 was associated with a drop in expectations. The most interesting finding, however, was that no relationship existed between net worth increases of any amount and a rise in bequest expectations. In fact, individuals who experienced an increase in net worth of between $13,000 and $51,000 were likely to lower, rather than raise, their bequest expectations. The asymmetrical nature of this relationship was a key finding and may have significant implications for financial planners. In summary, some evidence was found to support this study’s first hypothesis, conditioned only upon a decrease in net worth.
During the six-year period from 2010 to 2016, respondent average net worth increased by approximately $130,000. On the other hand, the change in the average expected minimum bequest from 2008 to 2016 was a decrease of $12,445, almost the same as the decrease of $12,282 from 2008 to 2010. In other words, respondent average bequest expectations did not rise from 2010 to 2016 despite the rebound in average net worth.
The second logistic regression model found that only individuals whose net worth increased by more than $389,000 in the six-year period following the recession were likely to have a 2016 bequest expectation equal to or greater than their 2008 bequest expectation. More modest increases in net worth had no relationship with a return to pre-recession expectations, offering minimal support for Hypothesis Two.
This study’s conclusion regarding the relationship between a decrease in net worth and a lowering of bequest expectations during the Great Recession confirmed the exploratory findings of Hurd and Rohwedder (2010) and Banks et al. (2013). These studies found that, on average, individuals in the U.S. and U.K., respectively, lowered their bequest expectations during this period. Further, consistent with Devaney, Anong, and Whirl (2007), because bequest expectations are a higher order saving priority, they appeared sensitive to declines in wealth.
This study did, however, offer two surprising results. First, increases in net worth during the Great Recession were not associated with a rise in bequest expectations. Second, only increases in net worth among the 10th decile following the recession were associated with a return to pre-recession expectations. One explanation for these results may be how Hurd and Smith (2001) operationalized increases in wealth. Hurd and Smith (2001) found a marginal relationship between general increases in wealth and a rise in bequest expectations. The magnitude of the relationship increased substantially when individuals experienced unrealized capital gains. In this setting, unrealized capital gains were deemed “unexpected.” Hurd and Smith concluded that only unexpected increases in wealth were associated with a change in bequest expectations. Similarly, unlike Begley’s (2017) study of the housing boom and bust during the 2000s, this research found no association between increases in wealth and a rise in bequest expectations during the Great Recession. Begley (2017) did conclude, however, that the magnitude of the relationship between changes in wealth and changes in bequest expectations was stronger for negative shocks than positive shocks.
Limitations
According to Rich (2013), the Great Recession began in December 2007 and ended in June 2009. The data used for this study’s first research question were from the 2008 and 2010 waves of the Health and Retirement Study (HRS). Because of the timing of when the interviews were conducted, the data were not aligned with the official start and end of the recession. This implication is evident as the average net worth decrease from 2008 to 2010 was $33,620, or approximately 9 percent. The average drop in net worth during the Great Recession, however, was 20 percent (Dettling, Hsu, and Llanes 2018). While the 2010 wave was used to capture an “end” to the recession, the economy was months into its recovery, depending upon when the HRS interview was actually conducted. As a result, the average decrease in net worth may not have reflected the true impact of the Great Recession for some respondents.
Another limitation of this study was that the HRS did not specifically ask respondents for the intended amount earmarked for bequests. Instead, three items were asked regarding the probability of leaving an inheritance of at least $10,000, $100,000, and $500,000. To address this study’s research question, an expected minimum bequest variable was constructed based upon a review of past literature (Hurd and Smith 2001). While helpful, using this approach did have disadvantages. Namely, respondents who answered there was a 100 percent probability for all three items had a maximum bequest expectation of $610,000 ($10,000 + $100,000 + $500,000). Similarly, the range of changes in bequests from one period to another was restricted to –$610,000 to $610,000. These caps may have muted significantly higher bequest expectations and volatile period-over-period changes for higher net worth respondents.
A final limitation of this study was unobserved heterogeneity. Observed heterogeneity describes the effects that cannot be measured, and yet may explain variation in a model’s dependent variable (Woolridge 2016). In the context of bequest expectations, consider a highly altruistic respondent. In this study, altruism cannot be measured, however, it is likely to play a role in explaining how changes in wealth are associated with a change in bequest expectations. Perhaps a highly altruistic respondent would be reluctant to lower their bequest expectations following a decrease in wealth but inclined to raise their expectations following an increase in wealth. Another respondent with a lower level of altruism may adjust their expectations very differently, given the same percentage change in wealth. One method to account for unobserved heterogeneity and an area for future study is to specify a fixed effects model. This method removes effects that cannot be measured, resulting in a more robust analysis. Using the example of altruism, a fixed effects model effectively cancels out altruism across all observations, resulting in a more accurate analysis of how changes in wealth are related to a change in bequest expectations.
Implications and Conclusion
As expected, individuals are likely to lower bequest expectations following a decrease in wealth. This finding is not surprising as individuals often will prioritize their basic and most immediate needs over higher order goals, such as wealth transfer (Devaney, Anong, and Whirl 2007). Quite unexpectedly, however, is that individuals are not likely to raise bequest expectations following an increase in wealth. These results have several implications for financial planners.
First, planners should use a negative economic shock as an opportunity to review their client’s previously stated goals and objectives. For example, this study finds that a modest decrease in net worth is related to a drop in bequest expectations. In some cases, clients may be overreacting to their environment rather than carefully considering whether they are still on track to meet their goals. It is possible that short-term wealth fluctuations will not materially impact a client’s original wealth transfer intentions. Additional education and what-if scenario planning may be helpful to reassure the client that they are still on course and reinforce the importance of taking a long-term perspective. Alternatively, making a bequest may not be an important priority, especially given concerns about how a recent and significant decline in wealth may impact a client’s future standard of living. In these cases, planners and clients are likely to agree to prioritize cash flow generation at the expense of leaving a sizable bequest to children. Similarly, increases in wealth may also have a meaningful impact on a client’s financial plan. This study suggests that individuals do not associate wealth gains with larger bequests. Instead, perhaps individuals use their good fortune to increase consumption (Coskun, Atasoy, Morri, and Alp 2018) or allocate a larger share of their wealth to charitable gifting (Li, Lian, Xu, and Liu 2019). Only a full review of the client’s priorities will help financial planners understand the potential impact a change in wealth may have on bequest expectations.
When helping clients reevaluate their bequest expectations, financial planners might consider sources of wealth beyond net worth. In an analysis of how the stock market crash in 2008 impacted the wealth of U.S. households, Kim and Hanna (2016) operationalized total wealth as the sum of net worth and human wealth. Human wealth was calculated as the present value of future employment, Social Security, and pension income. In the context of bequest expectations, a client who has the ability and willingness to cycle in and out of the workforce during retirement or who can depend on monthly payments from an adequately funded pension plan may have less of a need to alter their bequest plans given changes in the economic cycle compared to individuals whose total wealth is mostly composed of their homes and investable assets.
A final area of consideration is the influence of intra-family relationships. Using Hurd and Smith’s (2001) model of consumption and saving, identifying whether a bequest motive exists and the possible reasons behind a potential bequest motive are not necessary to understand the relationship between changes in wealth and changes in bequest expectations. Nonetheless, wealth transfer goals are likely to reflect, at least in part, the relationship dynamics between parents and children. Using the intergenerational solidarity framework (Bengtson and Roberts 1991), financial planners can further explore how the nature of parent-child relationships may influence bequest expectations. There are six elements in the framework: affection (degree of positive sentiments held about family members), association (frequency and patterns of interaction), consensus (degree of agreement on values and beliefs), resource sharing (degree of helping), the strength of family norms (strength of commitment to familial roles), and the opportunity structure for parent-client interaction (determined by the number, type, and geographical proximity of family members). While changes in wealth are a compelling reason to reevaluate bequest plans, the client’s priorities, human wealth considerations, and parent-child relationship dynamics can also play an important role in how bequest expectations may shift over time.
Planners should also take note that while respondents’ average net worth increased substantially from 2010 to 2016, changes in expected minimum bequests were flat. Further, only respondents who experienced the largest increases in wealth after the recession were likely to reinstate pre-recession bequest expectations. These findings may serve as a helpful reminder that the financial trauma of negative economic shocks such as the Great Recession may linger for many years, even if clients fully recover their losses. Prati and Prati (2010) suggested that financial planners play an important role helping clients who harbor strong emotional reactions to the price swings of financial assets. Only financial planners who built trust and commitment, however, were likely to be able to help clients manage their emotions. Sharpe et al. (2007) offered best practices for planners regarding effective communication and trust building. Recommendations included making eye contact, observing body language, and taking notes. Additionally, financial planners were encouraged to communicate at the client’s level of understanding and ask questions that welcomed the client to share information about themselves. Lawson and Klontz (2017) suggested various tools financial planners can use with clients who displayed strong emotional reactions to money issues. Tools that were highlighted included the Klontz Money Script Inventory, the Klontz-Britt Financial Health Scale, and the Financial Anxiety Scale.
Another consideration for financial planners is what, if any, expectations are held by their client’s children. Ameriprise (2017) estimates that about 20 percent of families have had discussions about bequests. In situations when a client’s expectations change, whether due to fluctuations in wealth or some other reason, a decision may need to be made whether to share this new information with the children. If a decision is made to provide the children with this update, the client may need assistance communicating the prospect of a lower inheritance.
Perhaps more pressing is the approximate 80 percent of families that have not had bequest discussions. In these cases, it is possible that children form expectations based upon their own financial circumstances or those of their parents (Kim et al. 2012). Changes in parent wealth may not be fully observable by the children, and therefore, children are unable to reasonably adjust their expectations. Unmet bequest expectations can cause hurt feelings and resentments, eventually leading to family discord, conflict, and even litigation (Grant 2016). An excellent resource for financial planners and their clients regarding how to communicate bequest intentions to children is Preparing Heirs (Williams and Preisser 2003).
While this research studied the period during and immediately after the Great Recession, clients may need assistance planning for a potential negative shock surrounding two recent events. First, the devastating impact of the coronavirus has caused many Americans to consider contingency plans in the event either spouse becomes ill. As a result, demand for estate planning attorneys has surged across various demographic groups. For example, young families with children are interested in choosing potential guardians and providing for their children (Plohetski 2020). Business owners and corporate executives are concerned about succession planning and the nuances of transferring illiquid wealth (Beaver 2020). With an increased demand for estate planning attorneys, many individuals are turning to online service providers (Borzykowski 2020).
The second event is the election of President Joe Biden. In 2020, the Biden campaign announced plans for higher income, gift, and estate taxes for Americans earning more than $400,000 if elected (Anders 2020). While it is still too soon to know if these proposed tax hikes will become law, many Americans are presently evaluating their options. For example, individuals with highly appreciated securities are seeking advice regarding the immediate gifting of these assets (Winokur-Munk 2020). Other families are establishing trusts now with the intent of transferring property to these trusts should tax hikes become imminent (Frank 2020). According to Frank (2020), estate planning attorneys have seen an “explosion” of client activity. Financial planners are encouraged to leverage the public’s newly found interest in estate planning to reengage their clients. In some cases, previously reluctant clients may be more willing to proceed, while in other cases, a review of existing wealth transfer arrangements may be warranted.
This study found that during the Great Recession, wealth losses were associated with a drop in bequest expectations. A surprising result, however, was that during the same period, wealth gains were not associated with a rise in bequest expectations. Further, only the greatest wealth gains after the recession were related to a return to pre-recession bequest expectations. Clients’ reluctance to revise their expectations upwards following wealth gains is a new element of wealth transfer planning not previously considered. These findings make a contribution to the literature and provide additional insights for financial planners helping to guide their clients through various economic conditions.
Citation
Sommer, Matt, and HanNa Lim. 2021. “A Lasting Legacy of the Great Recession: How Changes in Wealth Were Associated with Changes in Bequest Expectations.” Journal of Financial Planning 35 (2): 64–84.
References
Allison, P. D. 2012. Logistic Regression Using SAS: Theory and Application. Cary, NC: SAS Institute.
Almazora, L. 2018, November 26. “US $68 Trillion Wealth-Transfer Tsunami in the Next 25 Years, Says Cerulli.” Wealth Professional. www.wealthprofessional.ca/news/industry-news/us68-trillion-wealth-transfer-tsunami-in-the-next-25-years-says-cerulli/251066.
Ameriprise. 2017, March 15. “Family Financial Decisions Go Smoother than Anticipated, but Unrealistic Inheritance Expectations Persist.” https://ir.ameriprise.com/news-events/news-releases/press-release/2017/Ameriprise-Study-Family-Financial-Discussions-Go-Smoother-Than-Anticipated-But-Unrealistic-Inheritance-Expectations-Persist/default.aspx.
Anders, M. J. 2020, November. “Individual Tax Planning Following the November 2020 Elections.” National Law Review. www.natlawreview.com/article/individual-tax-planning-following-november-2020-elections.
Bank of America Merrill Lynch. 2020. “Leaving a Legacy: A Lasting Gift to Loved Ones.” https://images.em.bankofamerica.com/HOST-01-19-2701/ML_Legacy_Study.pdf.
Banks, J., R. Crawford, T. F. Crossley, and C. Emmerson. 2013. “Financial Crisis Wealth Losses and Responses among Older Households in England.” Fiscal Studies 34 (2): 231–254.
Beaver, D. 2020, March. “Coronavirus Legal Advice: Get your Businesses and Estate in Order Now.” Kiplinger. www.kiplinger.com/article/retirement/t021-c032-s014-coronavirus-legal-advice-get-your-estate-in-order.html.
Begley, J. 2017. “Legacies of Homeownership: Housing Wealth and Bequests.” Journal of Housing Economics 35: 37–50.
Bengtson, V., and R. Roberts. 1991. “Intergenerational Solidarity in Aging Families: An Example of Formal Theory Construction.” Journal of Marriage and the Family 53 (4): 856–870.
Borzykowski, B. 2020, March 25. “Americans Rush to Make Online Wills in the Face of the Coronavirus Pandemic.” CNBC. www.cnbc.com/2020/03/25/coronavirus-pandemic-triggers-rush-by-americans-to-make-online-wills.html.
Coskun Y., B. S. Atasoy, G. Morri, and E. Alp. 2018. “Wealth Effects on Household Final Consumption: Stock and Housing Market Channels.” International Journal of Financial Studies 6 (2): 1–32.
Crook, M., and M. Baredes. 2015. “Total Wealth Allocation: Liquidity, Longevity, and Legacy.” Journal of Wealth Management 18 (3): 18–26.
DeBoer, D. R., and E. C. Hoang. 2017. “Inheritances and Bequest Planning: Evidence from the Survey of Consumer Finances.” Journal of Family and Economic Issues 38 (1): 45–56.
Dettling, L., J. Hsu, and E. Llanes. 2018, September 13. “A Wealthless Recovery? Asset Ownership and the Uneven Recovery from the Great Recession.” Board of Governors of the Federal Reserve. www.federalreserve.gov/econres/notes/feds-notes/asset-ownership-and-the-uneven-recovery-from-the-great-recession-20180913.htm.
Devaney, S. A., S. T. Anong, and S. E. Whirl. 2007. “Household Savings Motives.” Journal of Consumer Affairs 41 (1): 174–186.
Ellis, B. 2013, December 13. “Average American Inheritance: $177,000.” CNN Money. https://money.cnn.com/2013/12/13/retirement/american-inheritance/.
Erixson, O., and H. Ohlsson. 2019. “Estate Division: Equal Sharing, Exchange Motives, and Cinderella Effects.” Journal of Population Economics 32: 1437–1480.
Fan, L., and S. Chatterjee. 2018. “Bequest Expectations among the U.S. Older Adults: The Roles of Generational Differences and Personality Traits.” Financial Planning Review 2 (2): 1–28.
Federal Reserve Bank of St. Louis. 2020, November 23. “How Recessions Impact Household Net Worth.” www.stlouisfed.org/on-the-economy/2020/november/recessions-impact-household-net-worth.
Fisher, G. G., and L. H. Ryan. 2018. “Overview of the Health and Retirement Study and Introduction to the Special Issue.” Work, Aging, and Retirement 4 (1): 1–9.
Frank, R. 2020, October 14. “Here’s Why Rich Kids Could Get Hundreds of Billions from their Parents if Biden Wins.” CNBC. www.cnbc.com/2020/10/14/rich-kids-could-get-hundreds-of-billions-from-their-parents-if-biden-wins-.html.
Grant, K. 2016, March 20. “Family Feuds Erupt Over Unequal Bequests.” CNBC. www.cnbc.com/2016/03/20/family-feuds-erupt-over-unequal-bequests.html.
Hamaaki, J., M. Hori, and K. Murata. 2018. “The Intra-Family Division of Bequests and Bequest Motives: Empirical Evidence from a Survey of Japanese Households.” Journal of Population Economics 32: 309–346.
Hoang, E. C. 2016. “Housing Prices and Bequests.” Eastern Economics Journal 42: 415–427.
Hurd, M. D., and S. Rohwedder. 2010, November. “The Effects of the Economic Crises on the Older Population (Working Paper 2010–231).” University of Michigan Retirement and Disability Research Center. https://deepblue.lib.umich.edu/bitstream/handle/2027.42/78348/wp231.pdf?sequence=1.
Hurd, M. D., and J. P. Smith. 2001. “Anticipated and Actual Bequests.” In Themes in the Economics of Aging. Edited by D. A. Wise. Chicago, IL: University of Chicago Press: 357–392.
James, R. N. 2015. “The New Statistics of Estate Planning: Lifetime and Post-Mortem Wills, Trusts, and Charitable Planning.” Estate Planning and Community Property Law Journal 8 (1): 1–39.
Kim, Kyoung, and S. Hanna. 2016. “The Impact of the 2008–2009 Stock Market Crash on the Wealth of U.S. Households.” Journal of Financial Planning 29 (2): 52–58.
Kim, Kyungmin, D. J. Eggebeen, S. H. Zarit, K. S. Birditt, and K. L. Fingerman. 2012. “Agreement Between Aging Parent’s Bequest Intention and Middle-Aged Child’s Inheritance Expectation.” The Gerontologist 53 (6): 1020–1031.
Kopczuk, W., and J. P. Lupton. 2007. “To Leave or Not to Leave: The Distribution of Bequest Motives.” Review of Economic Studies 74: 207–235.
Lawson, D. R., and B. T. Klontz. 2017. “Integrating Behavioral Finance, Financial Psychology, and Financial Therapy into the 6-Step Financial Planning Process.” Journal of Financial Planning 30 (7): 48–55.
Li, H., J. Liang, H. Xu, and Y. Liu. 2019. “Does Windfall Money Encourage Charitable Giving? An Experimental Study.” Voluntas 30: 841–848.
McGarry, K. 1997, December. “Inter Vivos Transfers and Intended Bequests (Working Paper 6345).” National Bureau of Economic Research. www.nber.org/papers/w6345.
Nielsen, R. B., and M. C. Seay. 2014. “Complex Samples and Regression-Based Inference: Considerations for Consumer Researchers.” Journal of Consumer Affairs 8 (3): 603–619.
Nivakoski, S. 2018 . “Does the Exchange Motive Influence Intergenerational Transfers? Evidence from Ireland.” Review of the Economics of the Household 17 (3): 1049–1079.
O’Neill, B., Y. Xu, C. Johnson, E. D. Kiss, and S. Buyske. 2019. “As Soon As…Finances: A Study of Financial Decision-Making.” Journal of Personal Finance 18 (1): 37–53.
Pence, K. 2006. “The Role of Wealth Transformations: An Application to Estimating the Effect of Tax Incentives on Savings.” Contributions to Economic Analysis & Policy 5 (1): 1–24.
Plohetski, T. 2020, April 4. “Attorneys See Surge of Requests for Wills as Coronavirus Takes its Toll across the U.S.” USA Today. www.usatoday.com/story/news/2020/04/03/americans-scramble-file-and-update-wills-amid-coronavirus-spread/2939153001/.
Prati, L. M., and R. S. Prati. 2010. “Managing Ups and Downs with Clients: Managing Emotions by Financial Advisors.” Journal of Personal Finance 8: 128–146.
RAND Center for the Study of Aging. 2021, March. “Complementing the Health and Retirement Study: RAND HRS Data Files.” www.rand.org/well-being/social-and-behavioral-policy/centers/aging/dataprod.html.
Rich, R. 2013, November 22. “The Great Recession.” Federal Reserve History. www.federalreservehistory.org/essays/great-recession-of-200709.
Sharpe, D. L., C. Anderson, A. White, S. Galvan, and M. Siesta. 2007. “Specific Elements of Communication that Affect Trust and Commitment in the Financial Planning Process.” Journal of Financial Counseling and Planning 18 (1): 2–17.
Sonnega, A., J. D. Faul, M. Ofstedal, K. M. Langa, J. Phillips, and D. R. Weir. 2014. “Cohort Profile: The Health and Retirement Study (HRS).” International Journal of Epidemiology 43 (2): 576–585.
Williams, R., and V. Preisser. 2003. Preparing Heirs. Brandon, OR: Robert D. Reed Publishers.
Winokur-Munk, C. 2020, November. “A Biden Presidency Could Complicate your Estate Taxes and Planning. Start Preparing Now.” Barrons. www.barrons.com/articles/a-biden-presidency-could-complicate-your-estate-taxes-and-planning-start-preparing-now-51603882801.
Wolter, K. M. 1985. Introduction to Variance Estimation. New York: Springer.
Woolridge, J. M. 2016. “Pooled Cross Sections Across Time: Simple Panel Data Methods.” In Introductory Econometrics: A Modern Approach. Boston, MA: Cengage Learning: 417–420.
Xiao, J., and F. Noring. 1994. “Perceived Saving Motives and Hierarchical Financial Needs.” Journal of Financial Counseling and Planning 5: 25–45.
Disclaimer: All data are based on the research of the authors; therefore, Janus Henderson cannot guarantee the accuracy or completeness of any statement or data contained herein. The opinions and views expressed are those of the author(s) and are subject to change without notice. They do not necessarily reflect the views of Janus Henderson and no forecasts can be guaranteed. Opinions and examples are for illustrative and educational purposes only and should not be used or construed to be legal or fiduciary advice or a full representation of all responsibilities of any financial professional. Reprinted with permission. No reproduction or redistribution without prior authorization.
C-0222-42176 02-15-23