Journal of Financial Planning: February 2023
Executive Summary
- This study was a cross-racial examination of factors that are associated with financial advice-seeking behaviors using data from the 2019 Survey of Consumer Finances.
- Results from a binary logit model indicate that Black respondents are less likely than White respondents to utilize a professional for investment decisions.
- Multinomial regression results indicate that while Black respondents are more likely than White respondents to consult someone other than themselves, they are more likely to seek out a non-professional source compared to otherwise similar White respondents.
- Results indicate that the level of trust may vary among different races, as well as the preferred communication methods for seeking advice.
- Implications focus on interventions and policies aimed toward increasing financial literacy that may lead underserved populations to increase professional advice-seeking behavior.
Eric T. Ludwig, CFP®, is the co-founder and CEO of Stockbridge Private Wealth Management and is currently pursuing a Ph.D. in personal financial planning at Kansas State University. His research focuses on the psychology of financial planning and investor behavior under uncertainty.
Stuart J. Heckman is a CERTIFIED FINANCIAL PLANNER™ and an associate professor of personal financial planning at Kansas State University. His research focuses on professional financial planning and financial decisions involving uncertainty, especially among young adults and college students.
Megan McCoy, Ph.D., LMFT, AFC, CFT-I, is an assistant professor in the personal financial planning department at Kansas State University. She is the co-editor of Financial Planning Review.
NOTE: Please click on the images below for PDF versions.
JOIN THE DISCUSSION: Discuss this article with fellow FPA Members through FPA's Knowledge Circles.
FEEDBACK: If you have any questions or comments on this article, please contact the editor HERE.
Click here to read this article in the DIGITAL EDITION.
The utilization of financial planners has been an increasing trend in the United States, but overall levels of use are still relatively low at about 25 percent of households (Hanna 2011). This is despite research that shows having a financial planner is very advantageous. Having a planner increases the chances of an individual having an emergency fund, being aware of fees and investment costs, regularly rebalancing their portfolio, not carrying a credit card balance, making payments on time, and having no debt (Blanchett 2019; Kim, Pak, Shin, and Hanna 2018; Williams 2022).
The low rate of usage is even more striking among Black and Hispanic households. In a recent study of financial planning clients (McCoy et al. 2022), 84.81 percent of the financial planning clients surveyed identified as White. The underrepresentation of Black and Hispanic households who enlist financial planning services is alarming and could be one of the contributing factors to the wealth disparity between racial/ethnic groups in the United States (Bhutta et al. 2020).
In the past, risk tolerance and financial literacy were commonly used as key predictors of financial planner usage (e.g., Grable and Joo 2001; Hanna 2011; Lim, Heckman, Montalto, and Letkiewicz 2014; Robb, Babiarz, and Woodyard 2012; Seay, Kim, and Heckman 2016). Little research has been conducted on the role trust plays in financial advice-seeking behavior. McCoy et al. (2022) found that trust is an essential element in the use and retention of financial planners and thus may be an oversight in earlier research. This paper seeks to increase understanding of the effects of risk tolerance, financial literacy, and trust on financial planner use. In addition, the relationship between these factors will be examined in light of client racial and ethnic groups to provide insights on potential barriers to using a financial planner in Black and Hispanic households.
Theoretical Framework
Advice-seeking behavior has been researched in other fields such as substance abuse (e.g., Berridge, McCann, Cheetham, and Lubman 2018), mental illness (e.g., Xu et al. 2018), and physical health (e.g., Yousaf, Grunfeld, and Hunter 2015). In financial planning, one of the earliest theoretical lenses applied to why people seek financial planning advice originates from Stigler’s (1961) economics of information theory. The theory assumes that the more information a consumer has, the better decisions they will make, but that the information can be expensive to obtain relative to its benefits. Applying the theory to financial planning suggests it is more efficient for some households to hire a professional to make product recommendations or give financial advice. A disadvantage of the theory is that it assumes all goods and services have the same quality, which is empirically not supported by financial professionals (Blanchett 2019).
More recently, Hanna and Lindamood (2010) used the expected utility theory to quantify the economic benefits of using a personal financial planner. They found that the value received by a client varies with risk tolerance and that those with the lowest risk tolerance place the highest value on the comprehensive financial planning of the largest percentage of wealth that could be gained. A limitation of expected utility theory is that it assumes that individuals have clear and stable preferences, whereas empirical evidence has shown otherwise (Kahneman and Tversky 1979).
Although there are strengths to the theories, the most comprehensive theoretical framework on financial help-seeking was developed by Grable and Joo (2001). They developed their framework based on Suchman’s (1966) healthcare-seeking behavior in the context of a multi-step decision-making process. The five steps the client takes in the framework are to (1) evaluate their symptoms, (2) determine the cause of the symptoms, (3) decide to seek treatment, (4) choose a specific treatment, and (5) decide whether to maintain treatment. The fourth stage is the critical step where individuals decide whether to seek help or not to seek help.
In Grable and Joo’s original paper (1999), they indicated that significant demographic and socioeconomic differences exist between those who do and do not seek personal financial help. Grable and Joo (2001) provided a further examination of the model using additional explanatory variables and found that the decision to seek help from a professional financial planner was most directly associated with risk tolerance, homeownership, financial satisfaction, financial behaviors, and age. Grable and Joo’s (2001) findings have been replicated and supported in several studies (e.g., Chatterjee 2018; Glenn and Heckman 2020; Lim, Heckman, Montalto, and Letkiewicz 2014). Based on the merit of Grable and Joo’s theoretical model (1999), the authors of this paper framed the study utilizing this theoretical framework with slight modification in that we refer to financial advice-seeking behavior rather than financial help-seeking.
Literature Review
Since Grable and Joo’s (1999) pivotal study, studies have examined the precursors and obstacles to financial advice-seeking in college students (e.g., Lim, Heckman, Montalto, and Letkiewicz 2014), young adults (Glenn and Heckman 2020), and retirees (Seay, Kim, and Heckman 2016). Recently Kimiyaghalam, Safari, and Mansori (2016) completed a review of financial help-seeking behaviors. Their findings suggest one’s demographic profile, risk tolerance, and financial literacy influence their financial advice-seeking behaviors. Potential relationships between trust and financial advice-seeking behaviors will also be examined.
Demographic Profile
Advice-seeking behaviors are influenced by demographic variables, which is why it is important to control for them in an empirical analysis. Those who seek out financial planners tend to have a high income (Chang 2005; Grable and Joo 1999), be nearing retirement (DeVaney 2005; Munnell 2015), be married (Chang 2005; Cummings and James 2014), and be male (Gillen and Kim 2014). There is an interesting side note to mention regarding marital status, in that there is an intersectionality component to this demographic profile. When women are single (Chang 2005) or become widowed (Cummings and James 2014), they become more likely to seek out an adviser.
The key demographic profile variable in this study was race. There have been studies that explored the effect of race/ethnicity on advice-seeking behavior. In the original study, Grable and Joo (1999) found that race/ethnicity characteristics did not have a significant relationship with financial advice-seeking behavior. However, later Hanna (2011) found that both Black and Hispanic households had lower rates of financial planning use than White households. Interestingly, when controlling for income, Black households’ rate of financial planner usage surpassed that of White households (e.g., Chang 2005; White and Heckman 2016). This finding is counterintuitive as it is well-documented that there is a low proportion of Black households among financial planning clients (e.g., McCoy et al. 2022). So, it is important to unpack the meaning of this finding in terms of race. In essence, through controlling for education and income, the researchers have found that in a world where there is not a racial wealth gap, then Black households would be more likely to see a financial planner. However, the racial wealth gap persists in the United States (Shapiro 2017). Thus, it is important to understand the role race and ethnicity play in advice-seeking behaviors, which is why race and ethnicity will play a pivotal role in this study. To examine the relationship between race/ethnicity and advice-seeking behavior, the first hypothesis is developed.
H1: When controlling for income and education, Black households will have a higher rate of financial advice-seeking than White households.
The Role of an Individual’s Risk Profile
An individual’s financial risk profile is a key predictor of financial decisions, such as the use of a financial planner (Evans 2009; Grable and Joo 2001; Hanna 2011), asset allocation (Finke and Guillemette 2016), and objective financial outcomes (Kinniry et al. 2016). The terms surrounding risk profiles, risk tolerance, and risk-taking are often used interchangeably (Nobre and Grable 2015). This study will focus specifically on risk tolerance. Cordell (2001) offered one of the first applied definitions of financial risk tolerance by stating it is the maximum degree of uncertainty someone is willing to accept when making a financial decision that entails the possibility of loss. Framed this way, financial risk tolerance contrasts with risk perception, which is the subjective appraisal of the riskiness of an outcome (Grable 2017). Risk need relates to the amount of risk required in an investment portfolio to reach a financial goal (Nobre and Grable 2015). These elements and others combine to form a comprehensive risk profile that shapes an individual’s risk-taking behavior (Carr 2014).
Financial risk tolerance was found to be positively associated with financial advice-seeking behavior by Grable and Joo (1999). This relationship between high risk tolerance and financial advice-seeking has been found in many demographic groups ranging from pre-retiree baby boomers (Rabbani, Yao, and Wang 2019) to college students (Lim, Heckman, Montalto, and Letkiewicz 2014). In other words, researchers have found that advice-seeking behavior was more likely to occur in households with higher levels of financial risk tolerance (Evans 2009; Grable and Joo 2001; Hanna 2011; Warschauer and Sciglimpaglia 2012). This relationship is counterproductive to individual investors with low risk tolerance, as Hanna and Lindamood (2010) found that the more risk-averse the individual is, the larger the economic benefit of having a financial planner. Previous studies have found that higher levels of risk tolerance are associated with higher levels of financial advice-seeking behavior. Perhaps another reason to expect a positive association between risk tolerance and financial planner usage is that risk tolerance is associated with investing behavior, and individuals who invest may be more likely to seek financial advice. Therefore, the second hypothesis is:
H2: Risk tolerance is positively associated with financial advice-seeking behavior.
The Role of Financial Literacy
In addition to risk tolerance, financial literacy is often a precursor to seeking financial advice. Financial literacy has been defined as an individual’s level of knowledge of financial concepts and financial techniques that aid in financial decision-making (Rabbani, Heo, and Grable 2021). One may assume that those with low financial knowledge would be more likely to ask for advice, and that is true in a handful of studies (e.g., Grable and Joo 2001).
However, more recent research has found that this is not always the case. Instead of seeing financial literacy as a substitute for financial advice (e.g., I have inadequate knowledge, so I will delegate to an expert), the results suggest individuals see financial advice as a complement, so individuals who are more financially literate will be more likely to seek financial advice as they are better able to recognize the potential complexities that could arise due to their financial situation (e.g., Barthel and Lei 2021; Calcagno and Monticone 2015; Rabbani, Heo, and Grable 2021). Seay, Kim, and Heckman (2016) examined financial literacy and financial advice-seeking and pointed out that financially literate individuals are more likely to utilize investment vehicles and take more time to weigh their financial decisions, thus they may be more likely to seek formal financial advice to weigh these options more thoroughly.
The research on the relationship between financial literacy and financial advice-seeking behavior is inconclusive. However, since the trend in the literature has been pointing to financial literacy increasing financial advice-seeking behavior, the next hypothesis will be in line with those early findings.
H3: Financial literacy is positively associated with financial advice-seeking behavior.
The Role of Trust
One often omitted variable in the examination of advice-seeking behaviors is trust. This is despite two strong studies indicating that trust plays a role in financial advice-seeking behavior (Lachance and Tang 2012; Burke and Hung 2021). However, it appears that financial literacy impacts trust and may mediate the relationship between trust and advice-seeking. The researchers in both studies found a parabolic relationship between trust and financial literacy, where trust increased with financial literacy to a point. But, beyond that point trust decreased with financial literacy (Lachance and Tang 2012; Burke and Hung 2021). Thus, the final hypothesis is:
H4: Trust is positively associated with financial advice-seeking behavior.
Conceptual Model
Grable and Joo’s (1999) original framework explored the effect of a person’s demographic and socioeconomic profile, the number of financial stressors they have experienced, financial knowledge, and attitudes on financial advice-seeking behavior. Since risk tolerance, financial literacy, and demographic factors have been repeatedly shown to impact financial advice-seeking behavior (Grable and Joo 2001; Lim, Heckman, Montalto, and Letkiewicz 2014; Hanna 2011; Robb, Babiarz, and Woodyard 2012; Seay, Kim, and Heckman 2016), these independent variables remain in the model. Additionally, trust is used as a key predictor in the model because it has been shown to impact the financial decision-making process (Burke and Hung 2021). Thus, the research question is: what is the influence of race/ethnicity, risk measures, financial literacy, and trust on financial advice-seeking behavior for saving and investing decisions?
In addition to the hypotheses stated above, previous literature informed the expectations about the source of information used to make investing and saving decisions (professional versus non-professional sources, both, or neither) tested in a multinomial model. Because there is a lack of empirical research that identifies the factors that shape preference for different information sources, we use the results of the multinomial model to perform exploratory analysis. There was an expectation to see a difference between those who use a professional source of information and those who use a non-professional or no source. It is expected that respondents with high risk tolerance are more likely to use a financial professional versus a non-professional source, and more likely to use a financial professional over no source of information. In addition, we expected those with high financial literacy to use a financial professional versus a non-professional source, and more likely to use a financial professional over no source of information. Since income and education are controlled for, the expectation is that Black respondents will be more likely to use a professional source to a non-professional source than White respondents, and Black respondents will be more likely to use a non-professional source to no source of information.
Method
This study used data from the 2019 Survey of Consumer Finances (SCF) sponsored by the Federal Reserve Board. The SCF dataset has been collected triennially since 1983 and contains information about household finances, demographics, and attitudinal characteristics. Additionally, the SCF contains a debriefing section where the interviewer provides subjective responses about the survey respondent. No sample restrictions were made, so the full SCF sample was analyzed (N = 5,777).
Due to the complex sampling and multiple imputation approach of the SCF (Lindamood, Hanna, and Bi 2007; Montalto and Sung 1996; Nielsen and Seay 2014), analyses used the Stata command “scfcombo.” The command uses the replicate weights file from the Fed to bootstrap the standard errors and uses the repeated-imputation inference (RII) technique to account for the multiple imputations in the SCF (Montalto and Sung 1996). Weighting information is provided from the SCF to researchers to make statistics from the sample representative of the U.S. population. We used the sampling weights in all analyses and tables to provide more representative and generalizable results (Deaton 1997). The Stata command “scfcombo” does not work for multinomial logistic regression, so the next best alternative is to run an unweighted multinomial regression with Stata’s “mi estimate” command to use the RII method (Shin and Hanna 2017).
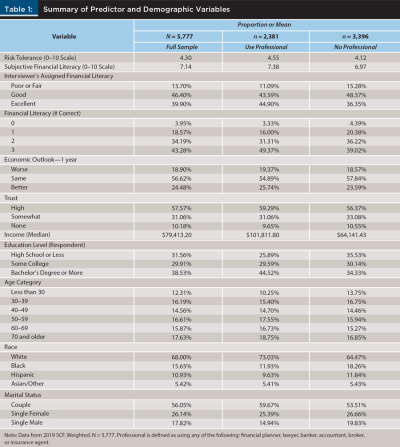
Tables 1 and 2 provide descriptive statistics for the full weighted sample, as well as for those who use a professional, and those who do not use a professional. The majority of the sample is White (68.00 percent), married (56.05 percent), and has a bachelor’s degree or higher (38.53 percent). The subsample that uses a financial professional appears to have a higher proportion of White respondents and higher median income and education. For example, the median income for financial planner users is $101,811 compared to $64,141 for non-users (see Table 1). These demographics are important as the study controls for level of education, age, race, marital status, and log income.
Measures
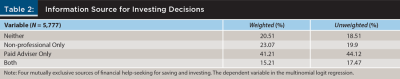
Dependent Variables. In the binary logit model, the dependent variable distinguishes respondents who have sought financial advice from a professional, coded 1, compared to those who have not, coded 0. Sources of professional advice include financial planners, bankers, lawyers, accountants, brokers, and agents.1 In the multinomial regression, the dependent variable has four categories: non-professional, professional, both professional and non-professional, and self, where self includes online sources.
Independent Variables. Risk tolerance is measured by asking “On a scale from zero to 10, where zero is not at all willing to take risks and 10 is very willing to take risks, what number would you (and your {husband/wife/partner}) be on the scale?” (SCF Staff 2019). Our measure for risk perception in the SCF is operationalized as the respondent’s one-year economic outlook compared to the previous year (same, better, or worse).
The three measures used for financial literacy are objective, subjective, and interviewer assigned. Objective financial literacy is the aggregate score of three questions. The questions ask about concepts of inflation, diversification, and compound interest. Subjective financial literacy is assessed by asking the respondent their level of knowledge about personal finances on a scale from zero to 10. A unique additional measure of financial literacy that was included is the interviewer’s subjective opinion as to how much difficulty the respondent had when answering the survey questions. The purpose of including this additional measure is to see if the interviewer’s assessment of the respondent’s financial literacy has a similar relationship to financial advice-seeking behavior as the respondent’s self-assessment of financial literacy.
The SCF asks the interviewer to assess the respondent’s level of trust at the beginning and end of the interview session. This study operationalizes the trust variable as the interviewer’s opinion of the respondent’s level of trust at the beginning of the survey session. This study uses the pre-interview level of trust because, conceptually, it resembles the level of trust an individual may have when seeking new information about savings or investing. Overall, the sample has moderate levels of risk preference, high levels of financial literacy, and low trust. Risk tolerance and financial literacy appear to be higher for those who had a financial professional, whereas risk perception and trust appear to be similar in both sample groups (see Table 2).
Analysis
Two regression models are used to test the hypotheses and expectations. To test Hypotheses 1 through 4, a binomial logistic regression is conducted to establish a relationship between the components of risk, financial literacy, trust, and demographics and the use of paid professionals for saving and investing decisions. The odds ratio was used to assess the magnitude and direction of the effect.
To investigate the expectations about the sources of information used to make investment decisions, a multinomial logit regression model is utilized to compare four mutually exclusive sources: (1) those who rely on no outside source of information (neither); (2) those who use only non-professional sources; (3) those who use a paid adviser only; and (4) those who use both a paid adviser and non-professional sources (both). We expect those who use a paid adviser will have higher risk preferences, high financial literacy, and less trust, as compared to those who use only non-professional sources or neither source.
Logit Model Results
Results from the logit regression model are presented in Table 3. The analysis provides data to support the relationship between risk measures and financial literacy to professional adviser usage. The odds of having a professional adviser were 6.8 percent higher for each unit increase in risk tolerance (OR = 1.068, p <.001).
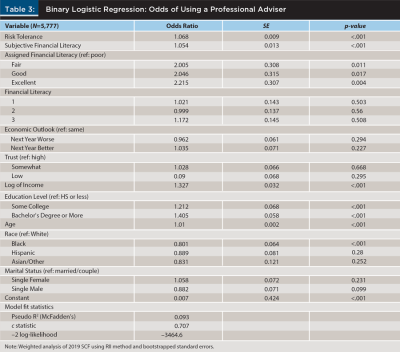
This study is unique in that it measured financial literacy under three different variables: subjective, assigned, and objective. The odds of having a professional adviser were 5.4 percent higher for each unit increase in subjective financial literacy (OR = 1.054, p <.001). As compared to having poor assigned financial literacy, having fair, good, or excellent assigned financial literacy increases the odds of using a professional adviser. Scores from the objective financial literacy test were not statistically significant predictors of professional financial adviser usage.
Risk perception was operationalized in terms of an investor’s economic outlook. Compared to those who expect the economy to perform the same over the next year, those who expect the economy to improve had higher odds to use a professional, and those with pessimistic expectations had fewer odds, but the results were not statistically significant.
For those who exhibit low trust, those who were assessed as being very suspicious had 11 percent lower odds of consulting a professional adviser. This aligned with Hypothesis 4, but the results were not statistically significant (p = .295).
Income is positively associated with and significant for predicting the use of a financial planner. For example, a 10 percent increase in income is associated with a 3 percent increase in using a professional adviser, and a 50 percent increase in income is associated with a 12 percent increase in usage. In terms of education, as compared to having a high school diploma or less, having some college or a college degree increased the odds of using a professional adviser. As age increases each year, financial planner usage was associated with 1.0 percent higher odds (OR = 1.010, p <.001). As compared to White respondents, Black respondents had roughly 19 percent lower odds of using a professional financial adviser (OR = .801, p <.001). Single males were associated with having lower odds of using a professional adviser as compared to married or couples, but the result did not achieve statistical significance (p = .071).
Multinomial Regression Results
The dependent variable of the multinomial logistic regression consisted of four categories of information sources used for saving and investing decisions: self-reliant, non-professional sources only, paid adviser, or both sources. Paid adviser includes possible choices of financial planner, broker, banker, lawyer, accountant, and insurance agent. Non-professional includes possible selections such as friends and family, magazines, newspapers, books, TV, radio, and work colleagues. Since one objective of this research was to understand if respondents are using other people or not, we coded self-reliant to include searching the internet since online information sought will likely be more general and not tailored to their financial situation. Figure 1 illustrates the proportion of respondents in each category.

Results from the multinomial logit model are presented in Table 4, which shows the results of all six comparisons of the four sources of information used for investing. In terms of risk tolerance, individuals who have higher risk tolerance have higher odds to use both sources versus a paid adviser or a non-professional, higher odds of using a paid adviser to a non-professional, and both sources or a paid adviser only to no source. The only comparison that was not significant for risk tolerance is when comparing non-professional sources to no source, implying that the likelihood of using some type of information source increases as risk tolerance increases.
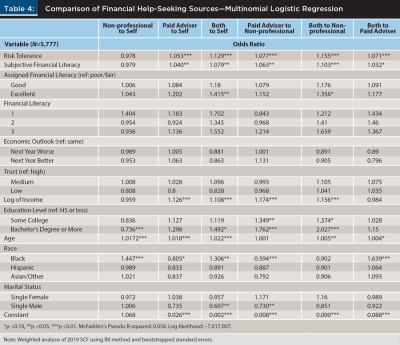
Subjective financial knowledge was positively associated with the odds of using a paid adviser versus using no sources and positively associated with using both sources versus none. Further, subjective financial knowledge was positively associated with using a paid adviser versus using non-professional sources, and with using both sources versus non-professional sources. Neither objective financial literacy nor interviewer-assessed financial literacy was a significant predictor in this model.
Similar to the results from the logit model, investors with a more optimistic economic outlook were more likely to use a professional versus a non-professional, but it was not statistically significant. Trust was also not a significant predictor in the multinomial model.
Income was found to be negatively associated with seeking a non-professional source versus no sources. This suggests that investors with higher incomes have higher odds of relying on themselves for investing information as opposed to a non-professional source. Income was positively associated with using a paid adviser to no source, both sources to none, paid advisers to non-professional sources, and both sources to non-professional sources. Overall, this reveals a similar relationship to the binary regression that income was positively associated with financial planner usage.
Education exhibited a significant positive relationship with using both sources versus none, as well as using a paid adviser versus a non-professional, and both sources versus a non-professional source.
Age showed a similar relationship to the binary model in that it was positively related to using a paid adviser to no source, or to using both sources compared to no source, and relying on non-professional sources to none. The relationship between age and investment sources was not significant when compared to one another, such as when comparing paid advisers only to non-professional sources, both sources versus non-professional, and both sources to only using a paid adviser. Marital status was not a significant predictor in the multinomial model.
As compared to White respondents, Black respondents had higher odds of using a non-professional source to no sources and using both sources to none. Black respondents, as compared to White respondents, have higher odds of using both sources as compared to using a paid adviser, and higher odds of using both sources to no source. Black respondents have lower odds of using a paid adviser versus relying on a non-professional source, and lower odds of using both sources compared to using a professional adviser. Black respondents also have lower odds of using a financial professional than using a non-professional. The lower odds of Black respondents using a financial professional can also be illustrated by the non-significant relationship of using a professional versus no source. It was hypothesized that Hispanic respondents would follow a similar pattern, but those results were not significant.
Discussion
The purpose of this paper is to expand the body of knowledge related to the effects of risk preferences, financial literacy, trust, and financial advice-seeking behavior and to examine any racial or ethnic differences. We used the broad framework put forth by Grable and Joo (1999) and modified it by adding measures of risk perception and trust as key predictor variables to develop four hypotheses, as well as expectations around the source of information individuals use to make investing decisions.
Racial identity was a significant predictor in both models (i.e., seeking advice and type of advice). This illustrates that race plays an important role in financial planner utilization. Burke and Hung (2021) find that non-White participants have less trust in stockbrokers and investment advisers as compared to White participants. Our analysis reveals a similar finding. White et al. (2021) show that Black and Hispanic households had lower odds of having conversations about financial matters as compared to White households, but that they were more likely to have a financial conversation with a friend as compared to spouses/partners or family. We found no statistically significant difference in financial advice-seeking behavior between the reference group (White respondents) and Hispanic or Asian/other respondents. Contradictory to Hypothesis 1, results indicate that when controlling for income and education, Black respondents were less likely than White respondents to display financial advice-seeking behavior.
Our multinomial model does not separate the various non-professional sources, rather the model compares non-professional sources to paid advisers. Black respondents, as compared to White respondents, had 40.6 percent lower odds of using a paid adviser to a non-professional source. Findings add to the work of White et al. (2021) in that results indicate Black respondents have higher odds of using a non-professional source as compared to no source at all. This implies that Black respondents may prefer to seek a source of information as compared to no source at all, but that source has lower odds of being a non-professional when controlling for income and education.
We found evidence to support Hypotheses 2 and 3, as both risk tolerance and financial literacy were found to be associated with higher odds of seeking professional advice for saving and investing decisions. The results of Hypothesis 4 reveal that those with low trust (high suspicion) were less likely to use a financial professional, but the results were not statistically significant. The SCF measure of trust asks the survey provider about the respondent’s level of suspicion about the interview, so trust may be domain-specific such that individuals could be suspicious about surveys but trusting in other areas.
In terms of control variables, income, education, and age were statistically significant and positively associated with financial advice-seeking behavior, whereas marital status was not found to be significant. These results are similar to what Seay, Kim, and Heckman (2016), Collins (2012), and Grable and Joo (2001) found when measuring subjective financial literacy as a predictor of retirement planning advice-seeking and financial advice-seeking behavior, as the study expands on their work by using a more nuanced measure of financial literacy by including the interviewer’s assessment of individual’s financial literacy. Including the variable for the interviewer-assessed financial literacy was a significant predictor of financial professional use in the binary model. This is interesting because it provides evidence that an interviewer may provide a valid measure of financial literacy. Seay, Kim, and Heckman (2016) use each objective financial literacy question as a separate predictor whereas the current study uses the sum score, as Robb, Babiarz, and Woodyard (2012) and Lim, Heckman, Montalto, and Letkiewicz (2014) have done. Surprisingly, the analysis revealed that objective financial knowledge was not a statistically significant predictor of financial professional use in either model. Supporting evidence was also found for expectations around information sources. As compared to those who rely on themselves for investing information, risk tolerance is positively associated with using a paid adviser or including non-professional sources. It is worth noting that the mean risk tolerance score of those who use a professional is 4.55 and for those who do not use a professional is 4.12 on a 10-point scale.
Limitations
While this study included key predictor and control variables in conjunction with the theoretical framework of financial advice-seeking, it is plausible that there are omitted variables that would otherwise explain variation in the outcome variables. Financial stress and financial self-efficacy were included in previous financial advice-seeking models (Grable and Joo 2001; Letkiewicz, Robinson, Domian, and Uborceva 2015; Lim, Heckman, Montalto, and Letkiewicz 2014). In addition, the present analysis analyzes the key predictors of financial advice-seeking behavior, but it does not seek to determine the objective and subjective financial outcomes of a household’s decision to use various information sources. The financial planning profession would benefit from additional research that tests the impact of financial information sources on subjective outcomes such as financial confidence, financial satisfaction, and financial well-being, as well as objective financial outcomes of saving behavior, retirement preparedness, and net worth.
Implications
Despite the limitations of this study, there are important implications for both practitioners and researchers in the field of financial planning. Based on the findings in this study, which of the main predictors can a financial planning practitioner influence to increase financial planner usage? A positive relationship was found between trust and risk tolerance, trust and financial literacy, and risk tolerance and financial literacy. While this study was not an experimental design, the results show that financial literacy results in a higher likelihood of using a financial planner. This finding provides support for financial professionals to support financial literacy programs in their communities. Through volunteering to teach about financial literacy at local schools, clubs, or other community events, planners can grow both the financial literacy of their communities but also grow the profession.
For those interested in increasing financial planner usage among Black households, the results of this study highlight the importance of understanding the varying advice-seeking preferences found through a race/ethnicity lens. As compared to White households, Black households preferred a non-professional source (i.e., friends and family, the internet). Financial planners may wish to reach Black households by using less formal and less traditional communication channels and instead reach Black households by using various online chat groups, podcasts, and blog posts. It is also possible that Black households may rely more heavily on being referred from a friend or family member to a financial planner, and therefore, financial planners of Black households may need to be more explicit in asking for referrals.
Financial planners can also use this information to focus their marketing messages on those who are more likely to use their services. Since there is evidence that those with higher income and education have greater odds of using a financial professional, they also may be more receptive to marketing messages about financial services. In addition, marketing strategies may want to highlight firms’ trustworthiness based on planners’ credentials or other signals of trustworthiness.
Planners who are interested in the racial differences in financial advice-seeking behavior can apply research from the findings. The financial planning professional faces diversity challenges. For example, less than 3.5 percent of the CFP® professionals in the United States are racially diverse, far less than the percentage in the United States, which is approximately 38.4 percent (Beverly 2019; U.S. Census Bureau 2020). Financial planner usage may increase among non-White clients if more non-White financial professionals were serving the industry. It was interesting that there were significant differences between Black and White respondents but not among other racial/ethnic groups. This may indicate that more research needs to explore the unique differences between Black, Hispanic, and Asian households rather than exploring them as a ubiquitous group compared to White households.
Conclusion
Financial planning firms are often interested in growing their client base and market share. This paper highlights some predictors around financial advice-seeking behaviors to aid firms in targeting their marketing to reach those individuals. In addition, the Financial Planning Association (FPA n.d.) and the Certified Financial Planner Board of Standards (CFP Board n.d.) have both developed initiatives to increase diversity in both planners and clients. Our study highlights potential obstacles financial planning firms face in increasing their client base diversity. Finally, this study provides additional insights on the sources of financial information (i.e., professional or non-professional sources) that can provide more value to financial professionals in reaching potential clients.
Endnote
- The Survey of Consumer Finance asks respondents which sources of information they use for savings/investing decisions. Of the professional sources a respondent has to choose from, financial planner is the most common answer (33.4 percent), but some people select banker (30.4 percent), lawyer (5.9 percent), accountant (15.6 percent), broker (13 percent), or insurance agent (0.1 percent). We decided to pool the responses of all of those as “Professionals.” Since financial planner is the most common answer of the various professional sources, we did not think the results would change. Additionally, we pooled the responses because some respondents may not know the difference between a broker and a financial planner.
A cross-tabulation was performed between race and professional (all categories) and compared to the cross-tabulation of race and planner. The relative weights between them remain similar (i.e., the proportion of White respondents using a professional versus a financial planner remains stable, as does the proportion of Black respondents using a professional versus a financial planner).
As a final robustness check, we regressed “professional” on the predictor variables (as in the paper) and compared results to regressing just “financial planner” on the same predictor variables. All results remain similar in terms of direction and statistical significance. (Output available upon request.)
Citation
Ludwig, Eric T., Stuart J. Heckman, and Megan McCoy. 2023. “The Influence of Risk, Financial Literacy, and Trust on Financial Advice-seeking Behavior in a Cross-racial Examination.” Journal of Financial Planning 36 (2): 68–84.
References
Barthel, Anne-Christine, and Shan Lei. 2021. “Investment in Financial Literacy and Financial Advice-Seeking: Substitutes or Complements?” The Quarterly Review of Economics and Finance 81: 385–396.
Berridge, Bonita J., Terence V. McCann, Ali Cheetham, and Dan I. Lubman. 2018. “Perceived Barriers and Enablers of Help-Seeking for Substance Use Problems during Adolescence.” Health Promotion Practice 19 (1): 86–93.
Beverly, Keith. 2019. “From Awareness to Action: A Model for Closing the Racial Gap Among CFP Professionals.” Journal of Financial Planning 32 (5): 28–30.
Bhutta, Neil, Andrew C. Chang, Lisa J. Dettling, Joanne W. Hsu, and Julia Hewitt. 2020. “Disparities in Wealth by Race and Ethnicity in the 2019 Survey of Consumer Finances.” Feds Notes 2020-09: 28–2.
Blanchett, D. 2019. “Financially Sound Households Use Financial Planners, Not Transactional Advisers.” Journal of Financial Planning 32 (4): 30–40.
Burke, Jeremy, and Angela A. Hung. 2021. “Trust and Financial Advice.” Journal of Pension Economics and Finance 20 (1): 9–26.
Calcagno, Riccardo, and Chiara Monticone. 2015. “Financial Literacy and the Demand for Financial Advice.” Journal of Banking & Finance 50: 363–380.
Carr, Nicholas. 2014. “Reassessing the Assessment: Exploring the Factors That Contribute to Comprehensive Financial Risk Evaluation.” Dissertation. Kansas State University.
CFP Board. n.d. “Diversity and Inclusion.” Accessed January 8, 2022. www.cfp.net/initiatives/diversity-and-inclusion.
Chang, Mariko Lin. 2005. “With a Little Help from My Friends (And My Financial Planner).” Social Forces 83 (4): 1469–1497.
Chatterjee, Swarn. 2018. “An Information Search Perspective of Financial Help-Seeking Behavior.” Consumer Interests Annual 64.
Collins, J. Michael. 2012. “Financial Advice: A Substitute for Financial Literacy?” Financial Services Review 21 (4): 307–322.
Cordell, David M. 2001. “RiskPACK: How to Evaluate Risk Tolerance.” Journal of Financial Planning 14 (6): 36–40.
Cummings, Benjamin F., and Russell N. James III. 2014. “Factors Associated with Getting and Dropping Financial Advisors among Older Adults: Evidence from Longitudinal Data.” Journal of Financial Counseling and Planning 25 (2): 129.
Deaton, Angus. 1997. The Analysis of Household Surveys: A Microeconometric Approach to Development Policy. World Bank Publications.
DeVaney, Kim H. 2005. “The Selection of Partial or Full Retirement by Older Workers.” Journal of Family and Economic Issues 26 (3).
Evans, David A. 2009. “The Predisposition of Women to Use the Services of a Financial Planner for Saving and Investing.” Ph.D. dissertation. The Ohio State University. Available at http://etd.ohiolink.edu.
Financial Planning Association (FPA). n.d. “Diversity and Inclusion.” Accessed January 4, 2022. www.financialplanningassociation.org/connect/diversity-inclusion.
Finke, Michael S., and Michael A. Guillemette. 2016. “Measuring Risk Tolerance: A Review of Literature.” Journal of Personal Finance 15 (1).
Gillen, Martie, and Hyungsoo Kim. 2014. “Older Adults’ Receipt of Financial Help: Does Personality Matter?” Journal of Family and Economic Issues 35 (2): 178–189.
Glenn, Christina E., and Stuart J. Heckman. 2020. “Financial Help-Seeking Behaviors of Young Adults.” Journal of Financial Therapy 11 (1): 3.
Grable, John E. 2017. “Financial Risk Tolerance: A Psychometric Review.” CFA Institute Research Foundation.
Grable, John E., and So-Hyun Joo. 1999. “Financial Help-Seeking Behavior: Theory and Implications.” Journal of Financial Counseling and Planning 10 (1): 14.
Grable, John E., and So-Hyun Joo. 2001. “A Further Examination of Financial Help-Seeking Behavior.” Journal of Financial Counseling and Planning 12 (1): 55.
Hanna, Sherman D. 2011. “The Demand for Financial Planning Services.” Journal of Personal Finance 10 (1): 36–62.
Hanna, Sherman D., and Suzanne Lindamood. 2010. “Quantifying the Economic Benefits of Personal Financial Planning.” Financial Services Review 19 (2): 1–21.
Kahneman, Daniel, and Amos Tversky. 1979. “Prospect Theory: An Analysis of Decision under Risk.” Econometrica 47 (2): 263–91. https://doi.org/10.2307/1914185.
Kim, Kyoung T., Tae-Young Pak, Su H. Shin, and Sherman D. Hanna. 2018. “The Relationship between Financial Planner Use and Holding a Retirement Saving Goal: A Propensity Score Matching Analysis.” Financial Planning Review 1 (1–2): e1008.
Kimiyaghalam, Fatemeh, Meysam Safari, and Shaheen Mansori. 2016. “Who Seeks a Financial Planner? A Review of the Literature.” Journal for Studies in Management and Planning 2 (7): 170–189.
Kinniry, Francis M., Colleen M. Jaconetti, Michael A. DiJoseph, Yan Zibering, and Donald G. Bennyhof. 2016. “Putting a Value on Your Value: Quantifying Vanguard Advisor’s Alpha.” Vanguard white paper. Retrieved from www.vanguard.com/pdf/ISGQVAA.pdf.
Lachance, Marie-Eve, and Ning Tang. 2012. “Financial Advice and Trust.” Financial Services Review 21 (3): 209–226.
Letkiewicz, Jodi, Chris Robinson, Dale L. Domian, and Natallia Uborceva. 2015, September 28. “Behavioral and Wealth Considerations for Seeking Professional Financial Planning Help.” Available at SSRN: https://ssrn.com/abstract=2666727 or http://dx.doi.org/10.2139/ssrn.2666727.
Lim, HanNa, Stuart Heckman, Catherine Phillips Montalto, and Jodi Letkiewicz. 2014. “Financial Stress, Self-efficacy, and Financial Help-Seeking Behavior of College Students.” Journal of Financial Counseling and Planning 25 (2): 148–160.
Lindamood, Suzanne, Sherman D. Hanna, and Lan Bi. 2007. “Using the Survey of Consumer Finances: Some Methodological Considerations and Issues.” Journal of Consumer Affairs 41 (2): 195–222.
McCoy, Megan, Ives Machiz, Josh Harris, Christina Lynn, Derek Lawson, and Ashlyn Rollins-Koons. 2022. “The Science of Building Trust and Commitment in Financial Planning: Using Structural Equation Modeling to Examine Antecedents to Trust and Commitment.” Journal of Financial Planning 35 (12): 68–89.
Montalto, Catherine Phillips, and Jaimie Sung. 1996. “Multiple Imputations in the 1992 Survey of Consumer Finances.” Journal of Financial Counseling and Planning 7: 133–141.
Munnell, Alicia H. 2015. “The Average Retirement Age—an Update.” Notes 1920: 1960–1980.
Nielsen, Robert B., and Martin C. Seay. 2014. “Complex Samples and Regression-Based Inference: Considerations for Consumer Researchers.” Journal of Consumer Affairs 48 (3): 603–619.
Nobre, Liana Holanda N., and John E. Grable. 2015. “The Role of Risk Profiles and Risk Tolerance in Shaping Client Investment Decisions.” Journal of Financial Service Professionals 69 (3): 54–61.
Rabbani, Abed, Wookjae Heo, and John E. Grable. 2021. “The Role of Financial Literacy in Describing the Use of Professional Financial Advisors Before and During the COVID-19 Pandemic.” Journal of Financial Services Marketing 26 (4): 1–11.
Rabbani, Abed G., Zheying Yao, and Christina Wang. 2019. “Does Personality Predict Financial Risk Tolerance of Pre-retiree Baby Boomers?” Journal of Behavioral and Experimental Finance 23: 124–132.
Robb, Cliff A., Patryk Babiarz, and Ann Woodyard. 2012. “The Demand for Financial Professionals’ Advice: The Role of Financial Knowledge, Satisfaction, and Confidence.” Financial Services Review 21 (4): 291–306.
SCF Staff. 2019. Codebook for the 2019 Survey of Consumer Finances. Retrieved from www.federalreserve.gov/econres/scfindex.htm.
Seay, Martin, Kyoung Tae Kim, and Stuart Heckman. 2016. “Exploring the Demand for Retirement Planning Advice: The Role of Financial Literacy.” Financial Services Review 25 (4): 331–350.
Shapiro, Thomas M. 2017. Toxic Inequality: How America’s Wealth Gap Destroys Mobility, Deepens the Racial Divide, and Threatens Our Future. Basic Books.
Shin, Su Hyun, and Sherman D. Hanna. 2017. “Accounting for Complex Sample Designs in Analyses of the Survey of Consumer Finances.” Journal of Consumer Affairs 51 (2): 433–447.
Stigler, George J. 1961. “The Economics of Information.” Journal of Political Economy 69 (3): 213–225.
Suchman, Edward A. 1966. “Health Orientation and Medical Care.” American Journal of Public Health and the Nation’s Health 56 (1): 97–105.
U.S. Census Bureau. 2020, April 1. Economic Annual Surveys, Table CB1700CBP. Generated by Jane Jones using https://data.census.gov/cedsci/.
Xu, Ziyan, Fangfang Huang, Markus Koesters, Tobias Staiger, Thomas Becker, Graham Thornicroft, and Nicolas Ruesch. 2018. “Effectiveness of Interventions to Promote Help-Seeking for Mental Health Problems: Systematic Review and Meta-Analysis.” Psychological Medicine 48 (16): 2658–2667.
Warschauer, Thomas, and Donald Sciglimpaglia. 2012. “The Economic Benefits of Personal Financial Planning: An Empirical Analysis.” Financial Services Review 21 (3): 195–208.
White, Kenneth J., Megan McCoy, Kimberly Watkins, XianYan Chen, Janet Koposko, and Matthew Mizuta. 2021. “‘We Don’t Talk About That’: Exploring Money Conversations of Black, Hispanic, and White Households.” Family and Consumer Sciences Research Journal 49 (4): 328–343.
White, Kenneth J., and Stuart J. Heckman. 2016. “Financial Planner Use Among Black and Hispanic Households.” Journal of Financial Planning 29 (9): 40–49.
Williams, Rob. 2022, January 4. “5 Ways Financial Planning Can Help.” Charles Schwab. www.schwab.com/learn/story/5-ways-financial-planning-can-help.
Yousaf, Omar, Elizabeth A. Grunfeld, and Myra S. Hunter. 2015. “A Systematic Review of the Factors Associated with Delays in Medical and Psychological Help-Seeking Among Men.” Health Psychology Review 9 (2): 264–276.