Journal of Financial Planning: September 2016
Kenneth J. White Jr., Ph.D., is an assistant professor in the Department of Financial Planning, Housing, and Consumer Economics at the University of Georgia. He received his Ph.D. from The Ohio State University.
Stuart J. Heckman, Ph.D., CFP®, is an assistant professor of personal financial planning in the School of Family Studies and Human Services at Kansas State University. His research focuses on financial decisions involving uncertainty, especially among young adults and college students.
Executive Summary
- This study investigated possible explanations for the fact that Black and Hispanic households are underrepresented among financial planning professionals and consumers by determining whether Black and Hispanic households differ from White households in their preferences for financial service professionals.
- Descriptive results highlight the large differences in financial assets and net worth between racial/ethnic groups and other characteristics that are known to be predictors of financial service use.
- Multivariate analyses show that while there are generally not racial/ethnic differences in preferences for type of financial service professionals, Black households are significantly different in their use of financial planners; they are significantly more likely to use financial planners compared to all other racial/ethnic groups when controlling for other household characteristics.
- Results indicate that the popular assets under management (AUM) fee structure may inadvertently be preventing Black and Hispanic households from using financial planners. Adopting alternative fee structures, such as monthly retainers, may be a way to increase financial planner use among Black and Hispanic households.
The United States has one of the most diverse racial/ethnic populations in the world and also happens to have one of the most sophisticated financial industries in the world. Given the complexities of personal financial management, it is often efficient for households to hire financial service professionals to provide specific products or financial advice. However, specific groups within the U.S. population seem to be neglected by the financial service industry, both at the professional level and the consumer level (MacBride 2015). For example, Blacks and Hispanics seem to be underrepresented among the ranks of financial planning professionals. While 2015 Census Bureau data show that Blacks account for 13.2 percent and Hispanics account for 17.1 percent of the U.S. population, data from the U.S. Census Bureau and U.S. Bureau of Labor Statistics’ Current Population Survey (last modified February 12, 2015) indicates that only 8.1 percent of personal financial advisers are Black, and 7.1 percent are Hispanic.
Income gaps, wealth gaps, and differences in financial asset profiles have historically made Black households less attractive and less sought after as clients when compared to White households (Plath and Stevenson 2001; Hanna 2011). Thus, racial/ethnic minorities have been traditionally overlooked as a viable market and underserved by financial planning professionals. An analysis of the Survey of Consumer Finances (SCF) shows lower use of financial planners by racial/ethnic minorities; 12 percent of Hispanic respondents and 21 percent of Black respondents reported using a financial planner, compared to 24 percent of White respondents (Hanna 2011). Understanding cultural differences by studying Black and Hispanic households’ use of financial planning services will be critical for advisory firms seeking to flourish (MacBride 2015).
Researchers have suggested that creating shared value has the potential to be the catalyst for the next wave of innovation (Porter and Kramer 2011). The concept of shared value seeks to expand economic value, not redistribute the current value the firm holds. This is done by emphasizing the interdependent relationship between firms and the local communities they serve—one cannot succeed without the other. Specifically, Porter and Kramer (2011) suggested that societal needs define markets, and that, by reevaluating products and markets, firms can create value for communities in addition to the shareholders. Once firms decide that their product is good for all customers and recognize potential profits in previously overlooked markets, then innovation will create new ways to reach these communities.
This paper sought to increase our understanding of Black and Hispanic households’ financial service use, with particular attention to financial planner use. Specifically, this study sought to determine whether, after controlling for other factors, Black and Hispanic households differed from White households in their preferences for financial service professionals. This study differed from other research involving racial/ethnic differences because it focused on Blacks and Hispanics as the reference groups in comparing the differences, so that Blacks and Hispanics could be compared to each of the other racial/ethnic groups.
After preferences for the use of financial service professionals is determined, the paper concludes with a section on how shared value can create new economic benefits for firms while meeting the needs of previously overlooked communities. Factors influencing the use of financial planners may have important implications for diversifying the financial services industry at both the professional and consumer levels. This knowledge can also be used to promote the creation of shared value by allowing financial professionals to increase the quality and relevance of the financial services they provide. Therefore, the following discussion will seek to review the literature of: (1) financial help-seeking behavior; and (2) racial/ethnic differences in the use of financial services.
Literature Review
Financial help-seeking behavior. Several researchers have explored financial advice-seeking among households. Hanna and Lindamood (2010) used expected utility theory to estimate the economic benefit of using a financial planner and provided a profile of households that should place greater value on financial planning advice. They suggested that households who are risk averse and households who are faced with the possibility of large percentage losses in terms of overall wealth should place the highest value on financial advice.
Grable and Joo (1999) developed a framework for financial help-seeking based on psychological literature and explored financial help-seeking among clerical workers. They found that younger people who experienced more financial stressors and exhibited negative financial behaviors were more likely to seek help. Subsequent research (Joo and Grable 2001) identified two other variables—risk tolerance and financial satisfaction—that distinguish those who seek non-professional versus professional financial help. While Hanna and Lindamood (2010) suggested those with lower risk tolerance should place a higher value on financial advice, several studies (Evans 2009, Joo and Grable 2001, Hanna 2011) found that households with higher levels of financial risk tolerance were more likely to seek help. Joo and Grable (2001) also found that households with higher incomes and more positive financial behaviors were more likely to seek advice regarding retirement decisions.
Racial/ethnic differences in the use of financial services. Among the U.S. population, factors such as age, wealth, gender, education, home ownership, risk tolerance, financial stressors, financial knowledge, and trust have been associated with household use of professional financial services. Several researchers have explored cultural differences in the use of financial services in the U.S.; the majority of these studies compared differences across race/ethnicity groups by using large, secondary datasets. In this section, research concerned with racial differences in topic-specific (e.g., investments) and comprehensive advice is reviewed.
Blacks’ and Hispanics’ average use of advice was lower in decisions about saving, investments, taxes, and loans compared to rates among Whites and Asians (Lachance and Tang 2012). A pooled study of the 1998, 2001, 2004, and 2007 SCF datasets showed that 21 percent of the households with Black respondents and 12 percent of the households with Hispanic respondents used some type of professional when making financial decisions in the past, whereas 24 percent of the households with White respondents used a financial professional (Hanna 2011). Consistent with the descriptive results, the multivariate results showed that Hispanic respondents were less likely than similar White respondents to use financial planners (Hanna 2011). This finding was consistent with Collins’ (2010) conclusion that Hispanics were less likely to seek advice on taxes. Despite Blacks having lower usage rates on a descriptive level, Black households were actually more likely to use a financial planner than White households when controlling for other characteristics (Hanna 2011). This was consistent with Chang’s (2005) conclusion that Black households were more likely than economically similar White households to use paid financial advice when making decisions.
A study using 2008 proprietary data reinforced Chang’s (2005) findings by concluding all minorities were significantly more likely than Whites to pay for financial advice (Finke, Huston, and Winchester 2011). But, Finke et al. (2011) found no evidence to suggest that race had an impact on the type of advice sought, whether comprehensive (holistic) or advice-supported (piecemeal) professional services. However, other research suggested that Blacks were more likely to use both holistic and piecemeal services. Finke et al. (2011) appeared to contradict the findings of Hanna (2011) and Collins (2010) that Hispanics were less likely than similar Whites to use financial professionals. Hanna (2011) suggested that this discrepancy may be the result of a higher immigration rate among Hispanics, since immigrants are underserved by the U.S. financial industry and tend to participate less in U.S. financial markets.
A multivariate analysis of data from the 2009 FINRA National Financial Capability Study (NFCS) revealed that Blacks were more likely than non-Blacks to use insurance advice (Collins 2012). Access to professional financial advice could help Black households and Hispanic households continue to improve economically, because households using financial planners were more likely to be adequately insured than households not utilizing professional advice (Finke, Huston, and Waller 2009). An analysis of the 1998 SCF revealed that, given equal levels of wealth and education, Black households were more likely than otherwise similar households of other races/ethnicities to seek comprehensive or holistic financial advice when making financial decisions (Elmerick, Montalto, and Fox 2002).
Some may argue that the lower usage rates were not related solely to race, but rather characteristics of each race. Research has suggested that Blacks lack sufficient investment knowledge to feel comfortable in acquiring less liquid financial assets such as common stock and corporate bonds (Stevenson and Plath 2002). This may lead to decreased use of financial advice, because financial knowledge is not a substitute for financial advice, but rather a complement (Collins 2012). Thus, increases in financial knowledge could lead to higher investment in less liquid assets and create more need for financial advice.
A study of the General Social Survey data revealed that Blacks lacked generalized trust in people and lacked confidence in banks and financial institutions necessary to use financial advice and invest in more risky assets (Lachance and Tang 2012). However, there seems to be some conflicting results relating to the level of trust that Blacks had of those in the financial industry. In the NFCS dataset, being Black had a significant positive effect on trust in financial professionals (Lachance and Tang 2012). Trust was a significant factor in financial planner use, thus understanding this discrepancy could add additional insight into Black households’ use of professional financial advice. Hispanic households have historically been immigrants to the U.S., which influences participation rates; as more Hispanics are born in the U.S., financial planner usage may increase. Additionally, financial advice use is typically higher among married couples; therefore, the lower usage rates among Blacks and Hispanics may be partially explained by the lower marriage rates among Blacks and Hispanics when compared to White households (Lachance and Tang 2012).
Sample
This study used the 2013 wave of the Survey of Consumer Finances (SCF). The SCF is a cross-sectional, nationally representative dataset produced every three years by the Federal Reserve Board (Fed) and is a comprehensive assessment of the economic wellness and financial behavior of U.S. households. In 2013, the most recent survey, there were 6,015 households in the public dataset. The SCF employs a complex sampling and multiple imputation approach, which complicates variance estimation (Lindamood, Hanna, and Bi 2007; Montalto and Sung 1996; Nielsen and Seay 2014).
This analysis used the Stata command “scfcombo” to account for both the complex sample design and multiple imputation approach.1 This command used the replicate weights file from the Fed to bootstrap the standard errors and applied the repeated imputation inference (RII) technique to improve the accuracy of variance estimates.
The multiple imputation approach provided a means to deal with missing data and privacy issues while limiting bias (i.e., making coefficient estimates as close to the population parameters as possible) (Lindamood et al. 2007). Several challenges exist specific to the race/ethnicity variables in the SCF. For one, race/ethnicity is only collected on the respondent. While this analysis refers to “Black” or “Hispanic” households for convenience, only the respondent’s race couple in households is known. Another challenge of the multiple implicate structure of the SCF for studies involving racial/ethnic differences is that a respondent may be identified with a different race/ethnicity in different implicates if this variable was imputed. In the current study, all five implicates were used, but the sensitivity of results was checked by excluding households in which race varied between implicates.2
Empirical Model
This study sought to explore financial service use among Black and Hispanic households. Therefore, six binary variables indicating use of a financial service professional were each regressed onto a set of independent variables. The SCF asked respondents who the household consulted for either saving/investment or credit/borrowing questions. Four responses were of particular interest in the current study: financial planner, banker, accountant, and broker. Binary indicator variables were created to distinguish households who reported using any of these professionals for either saving or borrowing decisions (coded 1) from households who did not (coded 0). Two additional categories were constructed: professional adviser and comprehensive financial planner. If a household reported using any of the four professionals, the household was considered to use a professional adviser. Comprehensive financial planner use was defined as using a financial planner for both saving and borrowing decisions (Elmerick et al. 2002). Logistic regression was used to (separately) regress each of these dependent variables onto a set of control variables and a set of indicator variables for racial/ethnic identity.
The independent variables included as control variables in the model were age, marital status, risk tolerance, time horizon, access to emergency funds, and socioeconomic control variables. Age and age squared were measured as continuous variables. Three categories for marital status were: married or couple household, single male, and single female. Respondents were asked the level of risk they were willing take for returns, and responses were coded as either no risk, average risk, above-average risk, or substantial risk. Time horizon when saving or investing was categorized as either short (less than a year), intermediate (one to 10 years), or long (greater than 10 years). Access to emergency funds was a binomial measure of whether or not the household could acquire $3,000 from family or friends in case of an emergency.
The measures of socioeconomic status included in the current study were: education, employment status, income, and net worth. Education categories were: less than high school, high school graduate, some college, bachelor’s degree, and graduate/professional school. Employment status was separated into three categories: employed, unemployed, and retired. Income and net worth were both measured in logarithmic terms, log income, and log net worth.
Finally, the primary variable of interest was the racial/ethnic identity of the household. The SCF asked only the respondent for his or her racial/ethnic identity. As previously mentioned, for couple households, this analysis referred to the household being of the same race as the respondent for convenience; data limitations prevent determining the complete racial/ethnic identity of the household. Furthermore, in the public version of the SCF, only four categories are available: White (non-Hispanic), Black, Hispanic, and Asian or other. Corresponding indicator variables were created to identify the race of each respondent.
Results
Descriptive statistics. A total of 6,015 households were included in the 2013 SCF, of which about 15 percent identified as Black, and about 11 percent identified as Hispanic. Table 1 shows the descriptive statistics for Black households and Hispanic households as well as for the other two racial/ethnic groups (White, Asian/other). The average age of Black respondents was 49 years, and the average age of Hispanic respondents was 44 years. A smaller percentage of Black respondents were married. Only about 36 percent of Black households reported being married, compared to White, Hispanic, and Asian/other, which all were above 60 percent. Single females accounted for 49 percent of Black households, while single females represented no more than 24 percent of households in the other three racial/ethnic groups.
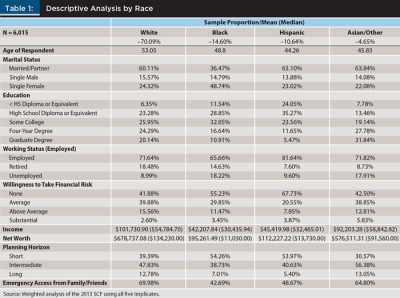
The education status of Black households and Hispanic households was most similar with large proportions of each group reporting the highest education level to be a high school diploma or less. About 40 percent of Black and about 59 percent of Hispanic households reported having a high school diploma or less, compared to 30 percent of White and about 21 percent of Asian/other households. Black households had the highest percentage of respondents with some college education; 32 percent of Black households reported having attended some college, compared to nearly 26 percent of White, 24 percent of Hispanic, and 20 percent of Asian/other households. Black households and Hispanic households had the lowest percentage of respondents having earned a four-year college degree. About 17 percent of Black households and 12 percent of Hispanic households reported having earned a four-year degree, whereas 24 percent of Whites and 28 percent of Asian/other households reported having a bachelor’s degree. The achievement gaps widened for households that had earned graduate degrees. Eleven percent of Black households and less than 6 percent of Hispanic households earned a graduate degree, while 20 percent of white households and 32 percent of Asian/other households earned graduate degrees.
Almost 66 percent of Black households reported being employed; White (72 percent); Hispanic (82 percent); and Asian/other (72 percent) households all reported higher percentages of working households. Unemployment rates were much higher among Black (18 percent) and Asian/other households (18 percent) compared to White (9 percent) and Hispanic households (10 percent). About 15 percent of Black households, while 18 percent of White households, 8 percent of Hispanic households, and 9 percent of Asian/other households were retired.
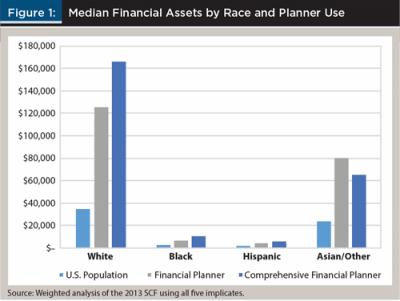
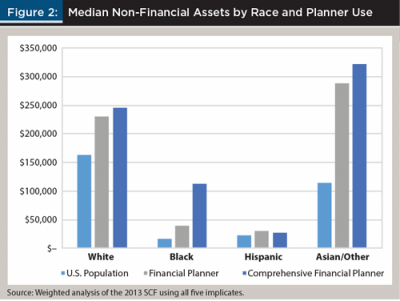
Black and Hispanic households were less willing to take financial risks. More than half of all Black households (55 percent) and Hispanic households (68 percent) were not willing to take any financial risk when saving and investing, compared to about 42 percent for both White and Asian/other households. Thirty percent of Black households and 21 percent of Hispanic households were willing to take an average amount of financial risk, compared to nearly 40 percent of White and 39 percent of Asian/other households. A larger percentage of Blacks (11 percent) versus Hispanics (8 percent) were willing to take an above-average level of financial risk; however, this was less than the percentage of White (16 percent) and Asian/other (13 percent) households. Less than 6 percent of households from any racial/ethnic group were willing to take a substantial amount of risk when saving and investing. This difference in willingness to take risks may explain some of the gap in the median financial assets and median non-financial assets displayed in Figure 1 and Figure 2.
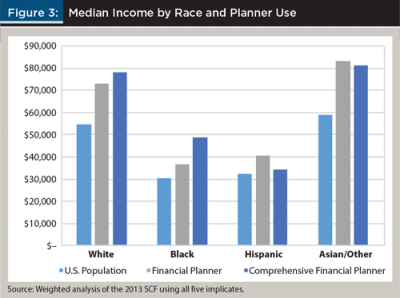
A substantial income gap existed between the racial/ethnic groups, as shown by the medians in Figure 3. Black households ($42,208) and Hispanic households ($45,420) both had mean incomes less than $50,000, while mean incomes for White and Asian/other households were more than twice as large: $101,731 and $92,203 respectively.
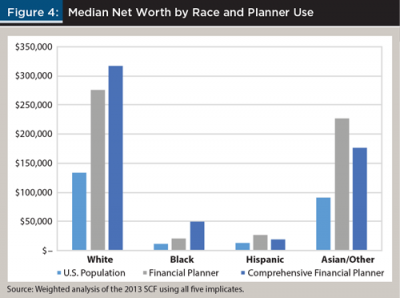
The net worth gap was even more severe. Black households and Hispanic households had the lowest mean net worth at $95,261 and $112,227, respectively. White households and Asian/other households had a mean net worth ($678,737 and $576,511, respectively); that was more than six times that of Black households and five times that of Hispanic households. As seen in Figure 4, the median net worth gap paints an even more severe picture. White households had a median net worth ($134,230) that was more than 12 times the median net worth of Black households ($11,030) and 10 times the median net worth of Hispanic households ($13,730). Asian/other households had a median net worth ($91,560) that was more than eight times the median net worth of Black households ($11,030) and seven times the median net worth of Hispanic households ($13,730).
More than half of all Black households (54 percent) and Hispanic households (54 percent) had a short time horizon when planning their finances, compared to 39 percent of White households and 31 percent of Asian/other households. Nearly 39 percent of Black households and 41 percent of Hispanic households had an intermediate planning horizon. Of all White households, nearly 48 percent had an intermediate-term planning horizon. About 56 percent of Asian/other households reported an intermediate planning horizon. Less than 10 percent of Black households (7 percent) and Hispanic households (5 percent) reported having a long-term planning horizon, while 13 percent of White households and 13 percent of Asian/other households had a long-term planning horizon.
In case of an emergency, 43 percent of Blacks reported being able to get $3,000 from family or friends. Similarly, less than half of Hispanic households (49 percent) reported being able to get $3,000 in emergency funds from family or friends. Nearly 65 percent of Asian/other and 70 percent of White households reported being able to get $3,000 from family or friends for an emergency.
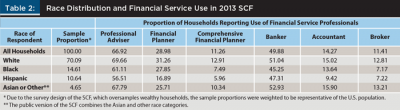
Table 2 shows the proportion of households by racial/ethnic group that reported using each type of financial service professional. Approximately 61 percent of Black households and 57 percent of Hispanic households used a professional adviser, while nearly 70 percent of White households and 68 percent of Asian/other households hired a professional adviser. About 28 percent of Black and 17 percent of Hispanic households reported using a financial planner, compared to 31 percent of White households and 26 percent of Asian/other households. As shown in Table 2, Black and Hispanic households had lower use rates for each type of professional adviser compared to White and Asian/other households with one exception: a larger proportion of Black households reported using a financial planner compared to Asian/other households.
Logistic Regression Analyses
Table 3 shows the results of the logistic regressions of financial service use by race. Black was used as the reference group in order to compare Black households to each of the other racial/ethnic groups. The analysis also ran the models with Hispanic as the reference group, but results were largely the same.3 Table 3 shows that four of the six financial professional categories had significant results. Controlling for other characteristics, Black households were significantly more likely than each of the other racial/ethnic groups to use a financial planner; however, Black households were significantly less likely than White households to take a comprehensive approach when using a financial planner. Blacks were significantly less likely than Asian or other households to use a banker, but Blacks were significantly more likely than Whites and Hispanics to consult an accountant. Although the full logistic regression results are available upon request for each category of financial professional, the current study focused on financial planner use and only reported logistic regression results from the financial planner category.
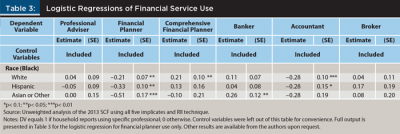
Table 4 provides the full output of the logistic regression results of financial planner use.4 Older respondents were significantly more likely than younger respondents to use a financial planner. Single females were more likely than married respondents to consult a financial planner. Households with less than a high school diploma were significantly less likely than households with a high school diploma to take advice from a financial planner. Education increases the likelihood of using a financial planner, as households with some college, a four-year degree, or a graduate degree were all more likely to use a financial planner than households with a high school diploma only.
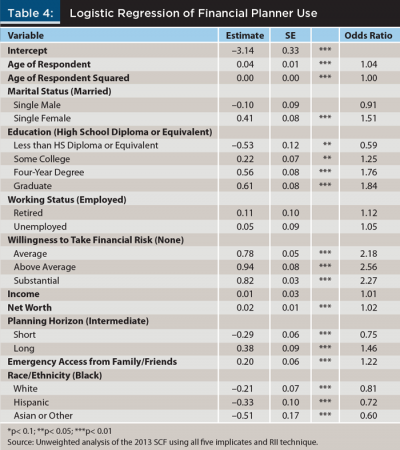
Households willing to take any amount of financial risk were more likely to use a financial planner than households willing to take no financial risk. Net worth had a positive relationship with the likelihood of consulting a financial planner. The planning horizon had mixed results in financial planner usage. Households with a short-term planning horizon were significantly less likely to use a financial planner than households with an intermediate planning horizon, while households with a long planning horizon were more likely to consult a financial planner than households with an intermediate planning horizon. Households with access to $3,000 in emergency funds from family or friends were more likely to use a financial planner than households not able to secure the same amount in emergency funds from family or friends.
Conclusion
The findings revealed significant racial/ethnic differences in the use of financial planners, as well as evidence of differences in other types of financial service professional use. The most salient descriptive results showed that large income and net worth gaps existed across racial/ethnic groups. Black and Hispanic households had substantially fewer financial assets compared to White and Asian/other households. Additionally, Black and Hispanic households had lower levels of education, less willingness to take financial risk, and a shorter horizon when planning for the future. These are all significant predictors of financial planner use in the logistic regression. Nevertheless, controlling for these variables showed that each of the other racial/ethnic groups were less likely than similar Black households to consult a financial planner.
The finding that Black households were more likely to use a financial planner, despite having lower actual usage rates, suggests that usage rates may be higher if the playing field was more level (i.e., if Black households were not systematically different from other racial/ethnic groups in important predictors of financial planning use).
Interestingly, neither income nor employment status were significant in the logistic regression analysis, suggesting that the lack of actual planner use among Black households and Hispanic households is probably less a labor participation issue and more of a wealth issue. This leads into how creating shared value can benefit both firm and community. Two ways to create shared value are: (1) creating innovative products; and (2) developing clusters and collaborations among profit and non-profit organizations (Porter and Kramer 2011).
The substantial racial/ethnic differences in financial assets and net worth have important implications for financial planning fee structures. Given that many firms charge on a percentage of assets under management (AUM), planners have an incentive to seek out households with large financial assets. This fee structure may inadvertently limit access to financial planning services for Black and Hispanic households and may partially explain why Black households have lower usage rates of financial planners. Adopting alternative fee structures, such as monthly retainers, may be an innovative way to increase financial planner use among Black and Hispanic households.
Additionally, many advisers are altruistic and readily do pro bono work. Firms could partner with non-profit organizations that focus on work with households that may not currently benefit from comprehensive planning. This would give firms the opportunity to create economic prosperity among underserved communities and grow a reliable supply of potential clients. In turn, this pipeline of clients could help planners become more efficient and productive as client acquisition costs should lessen.
A final implication of this study is to emphasize the importance of financial planning organizations and firms considering ways to implement long-term strategies to increase the percentages of Blacks and Hispanics who use financial planning services. Aside from considering alternative fee structures, another strategy is to diversify the ranks of financial advice professionals. Employing more Blacks and Hispanics in visible, client-facing positions should send a signal that the profession is supportive of Blacks and Hispanics, values their input, and welcomes their business (Stevenson and Plath 2002). Efforts by the Financial Planning Association, such as its Diversity Scholarship, are an important step in the right direction.
Future research should include studies that specifically consider the factors that influence Black and Hispanic households to use financial planners. This will help financial professionals develop new skills needed to meet the needs of historically underserved communities. A second area of future research is to examine factors that promote the perception of trust in financial planning professionals. When communities perceive that these relationships yield a real benefit, shared value is created, which in turn, helps firms to prosper.
Endnotes
- For step-by-step instructions on how to implement scfcombo, see Nielsen (2016).
- Thirty-three cases in the 2013 SCF contained imputed racial/ethnic identities.
- Hispanic households were less likely than Asian or other households to use a banker (p < 0.1). The other significant findings were reflected in the model with Black households as the reference group. Because no new information relevant to financial professional use was gained by using Hispanic as the reference group, those results were not presented.
- The models excluding the 33 cases in the 2013 SCF that contained imputed racial/ethnic identities were also run, with only one significant difference in the results. In the full dataset, Blacks were more likely than Whites to use a financial planner at p < 0.01 significance level. When the 33 cases that contained imputed race were excluded, Blacks were more likely than Whites to use a financial planner at p < 0.05 significance level.
References
Chang, Mariko Lin. 2005. “With a Little Help from My Friends (and My Financial Planner).” Social Forces 83 (4): 1,469–1,497.
Collins, J. Michael. 2010. “A Review of Financial Advice Models and the Take-Up of Financial Advice.” Center for Financial Security Working Paper 10-5.
Collins, J. Michael. 2012. “Financial Advice: A Substitute for Financial Literacy?” Financial Services Review 21 (4): 307–322.
Elmerick, Stephanie A., Catherine P. Montalto, and Jonathan J. Fox. 2002. “Use of Financial Planner by U.S. Households.” Financial Services Review 11 (3): 217–231.
Evans, David A. 2009. “The Predisposition of Women to Use the Services of a Financial Planner for Saving and Investing.” Ph.D. dissertation, The Ohio State University, available at etd.ohiolink.edu.
Finke, Michael, Sandra Huston, and William Waller. 2009. “Do Contracts Impact Comprehensive Financial Advice?” Financial Services Review 18 (2): 177–194.
Finke, Michael S., Sandra J. Huston, and Danielle D. Winchester. 2011. “Financial Advice: Who Pays?” Journal of Financial Counseling and Planning 22 (1): 18–26.
Grable, John E., and So-hyun Joo. 1999. “Financial Help-Seeking Behavior: Theory and Implications.” Financial Counseling and Planning 10 (1): 13–24.
Hanna, Sherman D. 2011. “The Demand for Financial Planning Services.” Journal of Personal Finance 10 (1): 36–62.
Hanna, Sherman D., and Suzanne Lindamood. 2010. “Quantifying the Economic Benefits of Personal Financial Planning.” Financial Services Review 19 (2): 111–127.
Joo, So-hyun, and John E. Grable. 2001. “Factors Associated with Seeking and Using Professional Retirement-Planning Help.” Family and Consumer Sciences Research Journal 30 (1): 37–63.
Lachance, Marie-Eve, and Ning Tang. 2012. “Financial Advice and Trust.” Financial Services Review 21 (3): 209–226.
Lindamood, Suzanne, Sherman D. Hanna, and Lan Bi. 2007. “Using the Survey of Consumer Finances: Some Methodological Considerations and Issues.” The Journal of Consumer Affairs 41 (2): 195–222.
MacBride, Elizabeth. 2015. “A Diversity Problem.” InvestmentNews, posted online December 14, 2015 at www.investmentnews.com.
Montalto, Catherine P., and Jaimie Sung. 1996. “Multiple Imputation in the 1992 Survey of Consumer Finances.” Journal of Financial Counseling and Planning 7: 133–146.
Nielsen, Robert B. 2016. “SCF Complex Sample Specification for Stata.” ResearchGate, posted January 2015 at www.researchgate.net.
Nielsen, Robert B., and Martin C. Seay. 2014. “Complex Samples and Regression-Based Inference: Considerations for Consumer Researchers.” The Journal of Consumer Affairs 48 (3): 603–619.
Plath, D. Anthony, and Thomas H. Stevenson. 2001. “Financial Services and the African-American Market: What Every Financial Planner Should Know.” Financial Services Review 9 (4): 343–359.
Porter, Micahel E., and Mark R. Kramer. 2011. “Creating Shared Value.” Harvard Business Review 89 (January/February): 62–77.
Stevenson, Thomas H., and D. Anthony Plath. 2002. “Marketing Financial Services to the African-American Consumer: A Comparative Analysis of Investment Portfolio Composition.” California Management Review 44 (4): 39–64
Citation
White, Kenneth J., and Stuart J. Heckman. 2016. “Financial Planner Use Among Black and Hispanic Households.” Journal of Financial Planning 29 (9): 40–49.