Journal of Financial Planning; March 2020
Executive Summary
- Equity index annuities (EIAs) are complex instruments sold widely for retirement planning, possibly trending toward increased use in the financial planning community, and often misunderstood by consumers.
- The role of various EIA characteristics, such as surrender charges, interest crediting methodologies, rate caps, and spreads have been studied in the literature.
- Using the S&P 500 daily returns from 1950 to 2018 as the under-lying index, this paper analyzed anniversary-date-based differences in returns for EIAs, and results show that non-trivial differences in returns can exist for contracts initiated mere days apart. These differences exhibit seasonality and do not appear driven by a particular sub-period of the almost seven-decade sample investigated here.
- The results provide financial planners with additional information needed to address the suitability of EIAs for clients, as well as to inform the index crediting methodology they might choose, should an EIA be suitable.
- The results also highlight the importance of managing client expectations when using EIAs as part of a financial plan.
JOIN THE DISCUSSION: Discuss this article with fellow FPA Members through FPA's Knowledge Circles.
Steven P. Fraser, Ph.D., is a professor of finance at Florida Gulf Coast University, where he serves as the CFP Board Registered Program director. He has taught undergraduate and graduate courses in finance, investments, and portfolio management. His research interests include applied topics relevant to individual and institutional investors.
Brian C. Payne, Ph.D., CFP®, is an assistant professor of finance at the University of Nebraska at Omaha. His research includes empirical and applied investments and asset pricing topics and has been published in multiple academic journals. He has taught finance and accounting courses at multiple universities.
The authors would like to thank participants at the 2019 annual conference of the Academy of Economics and Finance, the 2019 annual meeting of the Academy of Financial Services, the editorial staff, and anonymous reviewers for their helpful comments and suggestions.
Academics and practitioners have developed a robust literature examining the suitability and use of equity index annuities (EIAs). EIAs are complex structured products designed to allow investors to limit downside risk while simultaneously participating when equity markets rise, the characteristics of which are not always readily understood.
As described by Collins, Lam, and Stampfli (2009), EIAs are “fiendishly difficult to understand” (page 49). They come with myriad contract characteristics, many that can be changed at the behest of the issuer, making meaningful comparisons across products a challenge. Surrender charges, cap rates, yield spreads, and numerous interest crediting methodologies can impact the ultimate performance of the instrument. As a result, determining the suitability of an EIA as part of an investment portfolio or retirement plan remains a complex task.
The purpose of this study is to highlight the daily variability of interest credited to an EIA based on the anniversary date. Essentially, the results of this research suggest there is an aspect of market timing with these products.
Investors have been long told that timing the market is difficult. Most of the literature on market timing examines the ability of investors to move optimally among risky assets and cash equivalents. Specifically, studies have tested whether a switching strategy—that is, entering and exiting the equities market at optimal times—is superior to a simple buy-and-hold strategy. The preponderance of evidence suggests timing does not work.
While financial planners are not likely to recommend that clients try to time the market, they do make assumptions about capital market expectations when assessing client portfolios and forming recommendations. The results of this study suggest there is considerable variability in returns for EIAs based on the anniversary date. More specifically, if a client wishes to purchase a structured product such as an EIA, in addition to the complexities involved with such a product, planners should know that the specific date of the contract also matters. In fact, a day or two makes a difference in terms of performance; the magnitude of which can be non-trivial.
Literature Review
The literature, as it applies to market timing and the suitability and performance of EIAs, is reviewed here.
Market timing. Sharpe (1975) succinctly stated that unless a manager can predict correctly whether the market will be good or bad at least seven times out of 10, one should probably avoid attempts to time the market. Bauer and Dahlquist (2001) similarly concluded that market timing is a challenge. They suggested an investor who was to switch optimally monthly between equities and Treasury bills would need to have a predictive accuracy of more than 66 percent to outperform choices made by flipping a coin.
In what he calls modified buy-and-hold strategies, Shen (2003) examined the performance of several timing strategies using various combinations of the spread between the earnings/price (E/P) ratio of a stock market index and the yield of the three-month Treasury bill or the 10-year Treasury note. While not pure timing strategies, it is perhaps interesting that all but one of the strategies did outperform the benchmark buy-and-hold portfolio.
Some calendar anomalies contributing to the notion of market timing have been found in the literature. Haug and Hirschey (2006) found abnormally high rates of return on small capitalization stocks continue to be observed in January, identified as the “January effect,” presenting a challenge to the efficient market hypothesis. In a more granular analysis, Berument and Kiymaz (2001) suggested that while the highest and lowest returns were observed on Wednesday and Monday, respectively, the highest and lowest volatility were observed on Friday and Wednesday, respectively.
Cross (1973) noted price dependencies between some days of the week. He found markets rose more often on Fridays than Mondays from 1953 to 1970. Furthermore, there were equal chances of an advance or decline on Monday following an “up” Friday, yet three-to-one odds for a decline on Monday following a “down” Friday. In short, the data suggests timing the market is a challenge and unlikely to benefit an investor more than simply flipping a coin.
In this analysis, market timing was not examined as an alternative strategy to a buy-and-hold approach. Instead, this paper introduces the notion that there may be calendar anomalies associated with the use of EIAs narrowly, and structured products more broadly. In sum, with anniversary-date products, the data shows evidence to suggest that it may be possible to time the market.
Suitability and performance. This analysis of market timing utilized structured products, specifically, equity index annuities (EIAs). EIAs are complex instruments. They also represent a multibillion-dollar industry; the Insurance Information Institute, using LIMRA data, reports more than $456 billion was invested in index annuities in 2018.1 While an annual survey of financial planners conducted by the Financial Planning Association showed just 15 percent recommended index annuities for their clients in 2019. The same survey suggested the percentage of planners who intend to increase their use/recommendation of such products in the next 12 months (8 percent) was greater than the percentage who planned to decrease their use/recommendation (3 percent).2
The efficacy and suitability of EIAs has been the focus of previous research. Most EIAs are not registered securities, nor are they regulated by the Securities and Exchange Commission (SEC). Those selling EIAs are often not fiduciaries. Rather, they are often insurance representatives held to a suitability standard. The insurance industry has been criticized for suggesting retirees can purchase EIAs and get market upside with no downside (Schmansky 2018). Salinger (2019) suggested that the fiduciary issue was a contributing factor impacting EIA sales and reported that sales increased after a court decision vacated the fiduciary rule.
Many who purchase an EIA may not fully comprehend the various levers (explained later in this paper) at work within these complex instruments. Even if EIAs are fully understood by those who purchase them, the efficacy of the instruments has been questioned. VanderPal, Marrion, and Babbel (2011), building on VanderPal (2004, 2008), suggested fixed indexed annuities (FIAs), analogous to the EIA nomenclature used here, might outperform mutual funds or variable annuities. Further, the authors noted their analysis was one of the first to use actual contracts that included the use of the contract “levers.”
This study adds to the discussion of how those levers impact performance simply by anniversary date. Reichenstein (2009) examined 13 EIA contracts and found none could match the returns on one-month Treasury bills nor produce risk-adjusted competitive market-based returns. Terry and Elder (2015) expanded on Reichenstein (2009) and reemphasized the high opportunity costs embedded in EIAs.
The purpose of this paper is not to enter the debate of whether EIAs are suitable for an investor, nor is it to compare the performance of EIAs to the performance of their linked index. Rather, this paper investigated the significant resultant variability of interest credited to an EIA simply as a result of the anniversary date of a policy. Does it matter what day of the week, or what time of year, one purchases such a structured product?
There has always been a timing component to investments. However, due to the complex structure of EIAs, there is considerable variability in the interest credited to an EIA simply due to when the contract is put into effect. To the degree a financial planner uses an EIA as part of a client’s portfolio and larger financial plan, this variability is an important consideration. To the authors’ knowledge, previous research has neither explored nor documented this particular timing effect embedded within anniversary-based products such as EIAs. The findings here further illustrate the complexity of EIAs and thus how difficult it can be to determine their suitability for an investor.
Review of EIA Basics
While this analysis is applicable to the array of structured products found today, EIAs are used for illustrative purposes. When someone claims it is possible to earn “market-like returns with no downside risk,” there must be more to the story. The specific concern with EIAs is that it can be difficult to identify and assess the “rest of the story.” EIAs are essentially a contract where an investor normally makes a single payment (the premium) in hopes of participating in market performance while protecting their principal. However, how much of the market performance, and how much downside protection is provided, requires a clear understanding of the many provisions contained within a policy. The only way an insurer (a profitable one, anyway) can provide downside risk is by somehow limiting the upside as well. Palmer (2006), Reichenstein (2009), and Terry and Elder (2015) provided summaries of EIAs as well as some recommendations.
In addition to the marketing angle of “upside with no downside,” EIAs are also sometimes touted as being devoid of fees. While they may not specifically be identified as fees, a number of EIA characteristics result in investor costs. Some of those costs are reviewed here—the first, an explicit cost based on a client’s decision, and the remainder costs due to market or vendor forces.
Surrender charge. To deter a customer from exiting the EIA, insurers often include a surrender charge for a period of time after the contract is purchased. The surrender charge is normally a percentage of the annuity value and often declines over time. Palmer (2006) reported 70 percent of EIAs had surrender periods of seven to 12 years. The impact is essentially to create a cost to the investor that reduces liquidity and whose value can be difficult to quantify at the time of purchase. The surrender charge schedule is not subject to change after the contract is purchased. Although not labeled as a “fee,” the surrender charge is a cost if the contract is surrendered during this period.
The index. Each EIA is linked to an index. For simplicity, the focus here is on a hypothetical EIA linked to the S&P 500. It is important to recognize that EIAs utilize index levels; not index returns. Many of the firms in the S&P 500 pay periodic dividends. Insurers use changes to the level of the index when calculating market performance, necessarily ignoring dividends. The lack of dividend yield is the first indicator that the EIA’s “market-like” performance will be less than market performance by design.
Participation rate. This is the second indicator where an investor’s realization of market returns can be muted at the issuer’s discretion. The participation rate specifies how much of the market gain is credited to the investor. That is, it represents how much of the gain the investor receives. Numerically, if the market changes 10 percent, and there is a 90 percent participation rate, the investor would be credited with only 9 percent.
Yield spread. The insurer might instead use a yield spread. The spread is simply the reduction from the market gains credited to the investor. An EIA with a 2 percent spread will reduce the market gain by 2 percent.
Interest rate cap. The EIA might also contain an interest rate cap. This provision can limit the amount of interest credited by a monthly, annual, or even a lifetime cap. For example, an EIA with a 6 percent annual cap would limit the interest credited to that level even if the market gain was 16 percent.
Just as there are different levers that can limit the amount of interest credited, there are different index crediting methodologies.
The Financial Industry Regulatory Authority (FINRA) suggests there are generally three types of indexing methods, each with advantages and disadvantages:
Annual reset. This method captures the change in the level of the index, and declines are ignored. However, when combined with cap rates and participation rates, interest can be significantly reduced.
High water mark. This method often compares values at certain points—usually on anniversary dates—and takes the highest value over the period and compares it to the value of the index at the beginning.
Point-to-point. This method utilizes two specific dates, perhaps at the contract beginning and end dates.
FINRA cautioned in an Investor Alert that, “Some EIAs allow the insurance company to change participation rates, cap rates, or spread/asset/margin fees either annually or at the start of the next contract term.”3 Kuhlemeyer (2001) stated: “... the complicated nature of EIAs place a premium on investor education and knowledge” (page 329).
These cautions highlight that there are essentially countless variations of EIAs for consumers and financial planners to consider. These permutations become accentuated when there is considerable market volatility. Hansen (2018) reported the S&P 500 moved up or down on average 0.30 percent daily in 2017, which became 0.70 percent through most of 2018. It is easy to see from this data that the single move in a day could have an outsized effect on the impact of a monthly cap, especially when caps are low, as they have been in the last decade (and counting) of lower interest rates. So, how big of a difference can a day make?
Data and Methodology
This investigation starts by obtaining daily market data for the level of the S&P 500 from 1950 through 2018. As previously mentioned, many structured products ignore dividends and credit interest solely on the change in the level of the chosen market index. Initially, the general case is used where interest is credited using a monthly sum methodology to generate annual credited interest. Using this methodology, each month on the anniversary date the owner’s annuity earns the index return, positive or negative, up to the cap rate. At the end of the year, the annuity owner is credited with the sum of these monthly credit rates subject to a floor of zero return.
For example, if the index on a contract initiation date is 100, and the index is 110 (90) on the next month’s anniversary date, then with a cap rate under 10 percent (per month) the owner would earn the cap rate (negative 10 percent), for that individual month. If these same returns were to repeat themselves for the ensuing 11 months, then at the annual anniversary date the owner would be credited with the cap rate x 12 (no change).
When analyzing hypothetical crediting rates under such a construct, there is considerable variation in annual interest credited within a single trading week. The notion that there may be significant differences in the returns based on the day of the week introduces considerable consequences for both investors and the agents/brokers who sell the annuities. The potential to time the contract effective date (i.e., anniversary date) would introduce a particularly problematic agency issue with the investor wanting to choose the day/date associated with the highest potential interest credit while the agents/brokers would likely be incentivized to capture those gains on behalf of the issuer.
To quantify one example, Panel A of Table 1 shows that using the monthly reset methodology described above with a 1.8 percent monthly cap, the one-year interest credit for the five trading days in the first week of January 2014 yielded a range of interest credited of just under 4 percent. In other words, by implementing the contract on Wednesday instead of Monday, Tuesday, or Friday of that week, an annuity investor (issuer) would have effectively earned (paid) a further 3.84 percent spread on the annuity contract. Such variance has substantial implications for a financial planners’ portfolio assumptions.
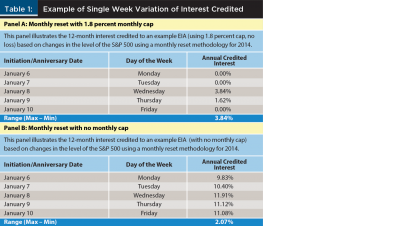
Panel B of Table 1 illustrates a more general case of a monthly reset product based on the S&P 500 (again, with no dividends). In this case, the monthly cap rate and the “no loss” provisions of the EIA are eliminated.
For the same contract initiation week in 2014, if the underlying product simply tracked the S&P 500, the amount credited each day would be much higher—ranging from 9.83 percent on Monday to 11.91 percent on Wednesday—yet the intra-week range decreases to 2.07 percent.
These examples show: (1) that the features of EIAs are extremely important, which previous research has also documented; and (2) the one-day difference in anniversary dates can be significant; a result that has not been previously analyzed, to the authors’ knowledge.
Results
The preliminary findings of one week demonstrate the analytical process. Table 2 shows results over a significant time span using different (monthly) cap rates. The quantified results for the range of returns for the 3,582 trading weeks are represented during this time frame using S&P 500 return data for 68 years (January 1950 through August 2018).
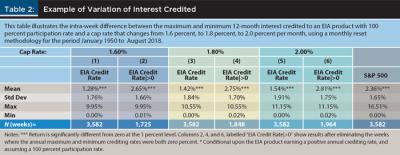
The first column (column (1)) of Table 2 shows that for the EIA crediting methodology described previously using a 1.6 percent (monthly) cap rate, the average intra-week range was 1.28 percent. The third (column (5)) column shows the results’ sensitivity to other cap rates of 1.8 percent (2.0 percent), which had an intra-week range of 1.42 percent (1.54 percent) on an annual return basis.
The single-week example shown in Table 1 was much higher, but not to an extreme, given the maximum intra-week differences were 9.95 percent, 10.55 percent, and 11.15 percent for the respective cap rates. Notably, the minimum was set to 0 percent due to the annual floor on the EIA product—what the product manufactures may advertise as “no downside.”
Across the different cap rates, there are 1,725; 1,848; and 1,964 weeks where the range was zero—that is, the annual maximum and minimum crediting rates within a particular week were both 0 percent. Omitting these observations results in the data in columns (2), (4), and (6) of Table 2.
Conditional upon the EIA product earning a positive annual crediting rate (and assuming a 100 percent participation rate), the intra-week difference becomes 2.65 percent (1.6 percent cap rate), 2.75 percent (1.8 percent cap rate), and 2.81 percent (2.0 percent cap rate). These high conditional averages demonstrate the skew induced by the no-monthly-floor EIA provision. That is, by allowing negative monthly returns to count fully in the EIA methodology but capping the positive monthly returns, the EIA product developers have skewed the crediting rate of purchasers toward zero for each annual period.
The finding uncovered in this analysis is the wide difference in interest crediting amounts within the same week. For instance, consider the purchase of a $500,000 annuity product with a 1.8 percent cap rate. The purchaser of the contract would have experienced an average opportunity cost of $7,500 annually based solely on selecting the “wrong” day of the week to initiate a contract versus the “right” day of that same week. When down years were omitted and only the non-zero years were used (as shown in columns (2), (4), and (6) in Table 2), the opportunity cost of selecting the incorrect day versus the correct one was approximately $13,750 per year, on average, for a 1.8 percent cap rate product.
The final column in Table 2 replicates Panel B of Table 1 over the entire 68-year timespan, removing the cap rate and floor from the S&P 500 returns. This method shows that the average difference in annual returns between the highest and lowest trading days in a week is 2.36 percent. Respectively, columns (1), (3), (5), and (6) of Table 2 all show that the day of the week matters significantly, on average, for an example EIA product and an annual contract S&P 500 tracking product. Picking the correct day of the week for contract purchase on average means an annual return delta of anywhere from 1.28 percent to 2.36 percent. A day still makes a difference.
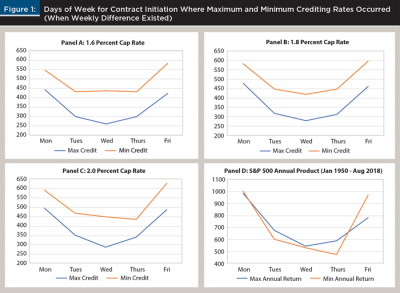
A natural follow-up question is: are there particular days of the week that earn an advantage? To answer this question, one can generate graphical depictions of the count of weeks where the maximum or minimum annual returns occurred on specific days for all the scenarios in Table 2 when an intra-week difference existed (i.e., it was not
0 percent).
There is obviously no maximum or minimum difference if the crediting rate is 0 percent for all days of a particular week. These day-of-the-week plots are shown in Figure 1, Panels A through C (EIA crediting methodology at different cap rates) and Panel D (S&P 500).
For the EIA products, a risk-averse client would select the middle of the week to experience the lowest incidence of the minimum crediting rate. However, the smile-like shape of the maximum credit plots for all the cap rates suggests that in order to get the maximum crediting rate, on average, a buyer should attempt to have the first crediting day of the contract fall on Monday or Friday, as those days of the week had the highest crediting rate more frequently than Wednesdays. For the S&P 500 product (Panel D of Figure 1), the only real discernible day-of-the-week argument would be to initiate a contract on Thursday, which is the only day where the maximum and minimum rate frequencies slightly diverged.
This analysis so far has focused on so-called “days-of-the-week phenomena.” Broadening the perspective, what about potential days-of-the-year phenomena? In other words, if knowing that purchasing an EIA product on one day versus another within a trading week can make a significant difference in the return credited (or not), are there significant discernible return differences if the analysis horizon is expanded across the entire calendar year?
Investigating this requires year-to-year returns on the index (in this case, the S&P 500) by anniversary date and applies the same process described in the previous methodology section to these calendar date values. Doing so permits the evaluation of the EIA credited amount by day of the year.
Figure 2, Panels A through C, depict the average crediting rates over the 68-year period, had a person initiated an EIA contract on any calendar date of the year for the same three cap rates analyzed earlier: 1.6 percent, 1.8 percent, and 2.0 percent, respectively. Additionally, Panels A through C show the daily differences in average 12-month credit rates from one calendar day to the next.
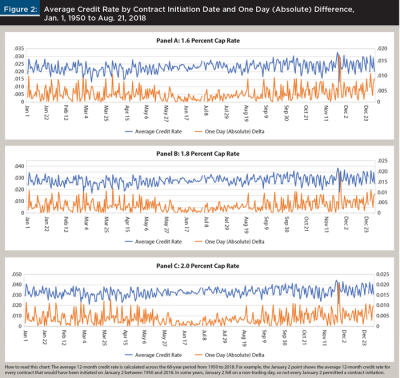
Because the concern is with the magnitude of the difference and not the sign, only the absolute value of the differences in credit rates (i.e., all are non-negative) is depicted in Figure 2. It is clear there is substantial variation in the average 12-month credit rate—both within a single cap rate (i.e., within a single panel), which represents a key finding of this analysis—as well as across cap rates. While not quantified here, by appearance there exists some seasonality in the day-to-day differences, with smaller differences in the middle of the calendar year and starker differences at the beginning and end of the calendar year. The results show the cap rate matters substantially in terms of what a purchaser would have earned, on average, based on the contract initiation date.
As a reminder of the methodology employed, the average 12-month credit rate shown in Figure 2 is calculated across the 68-year period from 1950 to 2018. For example, the January 2 point shows the average 12-month credit rate for every contract that would have been initiated on January 2 between 1950 and 2018. Clearly, in some years, January 2 fell on a weekend or holiday—that is, a non-trading day—so not every January 2 permitted a contract initiation. Panels A through C in Figure 3 help illustrate these calendar date dynamics. Figure 3 shows the total number of years (of 68) that a contract could be initiated by calendar date (left axis).
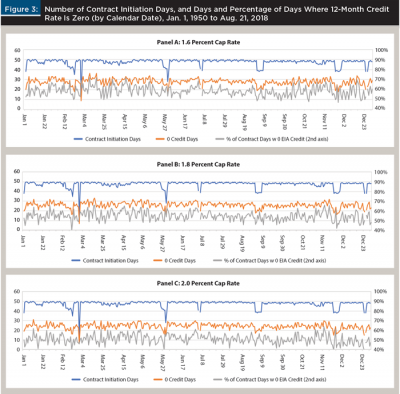
With a few exceptions, most calendar dates allowed contract initiation in approximately 50 of the 68 possible years. The dips and gaps in these top lines in Figure 3 make sense: January 1 is a gap, as is July 4 and December 25, because these dates are always holidays. The other dips occur around common U.S. holidays, such as Martin Luther King Day, Presidents’ Day, February 29 (leap years), Memorial Day, Labor Day, and Thanksgiving. During these holidays, there could be no contract initiation and therefore no 12-month credit rate.
Figure 3 also shows the number (and percentages on the right axis) of contract initiation dates over the full sample where the 12-month credit rate is zero. Regardless of the cap rate, the number of years where the 12-month credit rate is zero hovers around 50 percent (perhaps a bit higher for the 1.6 percent cap rate in Panel A). This finding suggests almost even odds whether an EIA investor gets a positive credit to their account each year.
This analysis has revealed substantial variation by calendar date—in other words, the proportion of 12-month credit rates that are zero varied substantially by contract initiation date over the past six-plus decades, and these changes can be notable from day-to-day.
While useful in supporting the contention that a day can make a difference for anniversary-driven products such as EIAs, Figures 2 and 3 do not provide quantitatively sufficient evidence. Table 3 accompanies Figures 2 and 3 and shows key summary statistics across the calendar dates.
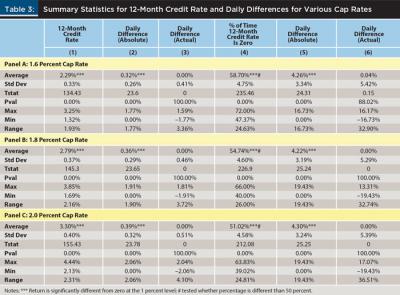
Table 3 supports a key conclusion drawn from Figure 2: substantial variation exists across the calendar year in terms of the 12-month credit rate across all three cap rate scenarios. For instance, in the 1.6 percent cap rate scenario (Panel A in both Table 3 and Figure 2), the average 12-month crediting rate across each contract date possible is approximately 2.29 percent with a standard deviation of 33 bps (see the first column of data in Panel A). These mean and standard deviation values change to 2.79 percent and 3.30 percent; and 37 bps and 40 bps, respectively, for the 1.8 percent and 2.0 percent cap rate scenarios. The extreme values—that is the, maximum and minimum—show a range of 1.93 percent, 2.16 percent, and 2.31 percent for cap rates of 1.6 percent, 1.8 percent, and 2.0 percent, respectively.
More germane to the analysis in this paper is the average daily difference in these crediting rates. As column (2) in each panel of Table 3 shows, these averages range from around 32 bps to 39 bps in absolute terms. The focus is on the day-to-day differences and not whether the change is positive or negative (although the actual differences are included in column (3) for completeness). In other words, the focus is on the day-to-day variation in the crediting rate to a given EIA product.
This result suggests that looking across the entire year for possible contract initiation dates, over the past seven decades, one could expect approximately a 30 to 40 bps difference in the annual crediting rate by purchasing an EIA product today versus tomorrow or versus yesterday.
As described earlier, because these averages are skewed by the zero credit rate situations, the zero-credit rate outcomes are analyzed by contract initiation date. The latter three columns in all panels of Table 3 quantify these outcomes (the graphical analogs appear in Figure 3). As a reminder, Figure 3 shows the total possible contract initiation years by each calendar date, the number of those years where the 12-month credit rate would be zero, and the percent of the time these zero credit rates occur.
Column (4) of Table 3 shows the percentage of contract initiation dates that would have experienced a 12-month credit rate of zero over the past six-plus decades. While the percentages vary by cap rate (58.7 percent, 54.7 percent, and 51.0 percent for cap rates of 1.6 percent, 1.8 percent, and 2.0 percent, respectively), in each case it is significantly more probable that EIA investors will experience a zero-crediting rate than not.
One of this paper’s contributions to the literature is shown in column (5) of all panels in Table 3. This column shows the absolute change in the likelihood a 12-month credit rate is zero from one contract initiation date to the next. That is, on average, if a client has a 50 percent chance of a zero crediting rate for one calendar date, then the client has a 54 percent or 46 percent chance of a zero crediting rate by initiating the contract the next day, as these values are approximately 4 percent different than the previous date. These averages in daily differences range from 4.26 percent to 4.30 percent and are statistically significant.
To be clear about the interpretation, in Panel C the value of 4.30 percent (cap rate 2.0 percent) indicates that over the past 68 years there has been a 4.30 percent difference from one day to the next in the likelihood of receiving a zero credit rate to an EIA over the subsequent 12 months. In other words, at the average of 51.02 percent, the probability of earning a zero 12-month credit rate swings from greater than even odds to less than even odds, on average, from one day to the next.
Conclusion and Implications for Planners
Previous studies have argued the merits and drawbacks of EIA products. This research introduced evidence that the performance of such products can be dramatically different if an investor initiates the contract on one day versus the very next day.
Besides the individual EIA contract features (e.g., surrender fees, participation rates, cap rates, and crediting methodologies), this substantial variation is driven by market action coupled with the annual anniversary date feature of these contracts. In comparison, the impact of investing and selling on one day versus the next for a typical long-term, buy-and-hold investor is minimal; portfolio return differences become the one day difference in cumulative returns over many years. However, in an EIA product with an interest crediting method similar to the one illustrated here, this error essentially becomes “locked in” each month and subsequent year. For the buy-and-hold investor, the longer this time period becomes, the lower the likelihood that a one-day difference matters. In contrast, any one-year period (with a monthly sum methodology) presents a greater opportunity for one day to make a difference in anniversary-dated products such as EIAs.
This research has meaningful implications for financial planners. First, the results highlight the role an interest rate cap can play in a policy’s annual return, as higher caps lead to both higher crediting rates and higher daily variation. Second, should a planner include an EIA in a client’s financial plan with some expected return, this assumption must be revisited in light of these results.
While one cannot systematically identify a day of the week or year to buy or not buy an EIA product due to the market’s randomness, the analysis presented here suggests that it can make a significant difference in one’s wealth whether they initiated their EIA yesterday, are doing so today, or will do so tomorrow. This variability is likely not included in planners’ projections.
Should an EIA be deemed suitable by a planner, these results might inform a closer look at the various interest rate crediting methodologies available within the contract. Consequently, planners are well-served to manage clients’ expectations should their clients insist on using these types of products.
Unlike with competing S&P 500 mutual funds, for instance, the return experienced by a client’s EIA could be very different than the return experienced by their neighbor or friend who bought an analogous product merely days apart. Recognizing this fact upfront can assist with future conversations about performance variation.
Finally, these results suggest that determining the suitability of EIAs for clients is even more challenging, and arguably more important, than previously thought.
Endnotes
- See “Facts + Statistics: Annuities,” from the Insurance Information Institute at iii.org/fact-statistic/facts-statistics-annuities.
- See the 2019 Trends in Investing Survey results from the Journal of Financial Planning and the FPA Research and Practice InstituteTM at OneFPA.org/business-success/ResearchandPracticeInstitute/Pages/2019-Trends_In_Investing.aspx.
- See the FINRA Investor Alert, “Equity Indexed Annuities: A Complex Choice,” last updated Sept. 10, 2013 and available at finra.org/investors/alerts/equity-indexed-annuities-complex-choice.
References
Bauer, Richard J., and Julie R. Dahlquist. 2001. “Market Timing and Roulette Wheels.” Financial Analysts Journal 57 (1): 28–40.
Berument, Hakan, and Halil Kiymaz. 2001. “The Day of the Week Effect on Stock Market Volatility.” Journal of Economics and Finance 25 (2): 181–193.
Collins, Patrick J., Huy Lam, and Josh Stampfli. 2009. “Equity Indexed Annuities: Downside Protection, But at What Cost?” Journal of Financial Planning 22 (5): 48–57.
Cross, Frank. 1973. “The Behavior of Stock Prices on Fridays and Mondays.” Financial Analysts Journal 29 (6): 67–69.
Hansen, Sarah. 2018. “Market Volatility: A Return to the Old Normal,” Forbes, December 12. Available at forbes.com/sites/sarahhansen/2018/12/12/market-volatility/#2a62795f71f0.
Haug, Mark, and Mark Hirschey. 2006. “The January Effect.” Financial Analysts Journal 62 (5): 78–88.
Kuhlemeyer, Gregory A. 2001. “The Equity Index Annuity: An Examination of Performance and Regulatory Concerns.” Financial Services Review 9 (4): 327–342.
Palmer, Bruce A. 2006. “Equity-Index Annuities: Fundamental Concepts and Issues.” Insurance Information Institute whitepaper. Available at iii.org/article/equity-indexed-annuities-fundamental-concepts-and-issues.
Reichenstein, William. 2009. “Financial Analysis of Equity-Indexed Annuities.” Financial Services Review 18 (4): 291–311.
Salinger, Tobias. 2019. “Annuity Sales Topped $60B for Another Quarter. But Is the Party Now Over? Financial Planning, August 22. Available at financial-planning.com.
Schmansky, Robert. 2018. “Do Not Invest in An Equity-Indexed Annuity.” Forbes January 20. Available at forbes.com/sites/feeonlyplanner/2018/01/20/do-not-invest-in-an-equity-indexed-annuity/#70d4e8b61f45.
Sharpe, William F. 1975. “Likely Gains from Market Timing.” Financial Analysts Journal
31 (2): 60–69.
Shen, Pu. 2003. “Market Timing Strategies that Worked.” The Journal of Portfolio Management 29 (2): 57–68.
Terry, Andy, and Erick Elder. 2015. “A Further Examination of Equity Indexed Annuities.” Financial Services Review 24 (4): 411–428.
VanderPal, Geoffrey A. 2004. “The Advantages and Disadvantages of Equity Index Annuities.” Journal of Financial Planning 17 (1): 56–62.
VanderPal, Geoffrey A. 2008. “Equity Index Annuities.” Journal of Personal Finance 7 (2): 34–43.
VanderPal, Geoffrey A., Jack Marrion, and David F. Babbel. 2011. “Real-World Index Annuity Returns.” Journal of Financial Planning 24 (3): 50–59.
Citation
Fraser, Steven P., and Brian C. Payne. 2020. “The Difference a Day Can Make: Exploring Another Variable of Interest for EIAs.” Journal of Financial Planning 33 (3): 46–56.