Journal of Financial Planning: May 2009
Executive Summary
- Understandably, investors like to participate in the upside of markets and protect themselves against the downswings. To protect against downsides, many investors are turning to equity indexed annuities.
- The paper reviews the financial engineering aspects of the product as well as several common provisions in EIA contracts, such as the floor value of the contract, the index participation rate, and the yield-spread cost factor. The paper also reviews six general categories of EIA products, such as multi-year, point-to-point contracts and high-water-mark contracts.
- The paper explores three types of performance evaluation metrics: (1) option payoffs, (2) historical payoffs, and (3) simulation-based payoffs. Using the lower- and upper-bound dollar payoffs set by the EIA's contract provisions, the article quantifies the likelihood that a contract owner either benefits from the downside protection or regrets the cap on the upside payoff.
- Simulation analysis provides a suitable evaluation alternative only if the simulation process incorporates the higher moments that characterize the time series of equity financial returns. This means that the simulation must be capable of producing outlier (left tail) results at a frequency and magnitude greater than expected in a normal (bell curve) distribution.
- A regime-switching simulation methodology incorporating bull and bear market "normal mixtures" assesses the probability of benefit or regret over a spectrum of investment portfolio alternatives that might appeal to both conservative and aggressive investors. Results suggest that EIAs should be evaluated in both "dollar-value-of-wealth" space and "utility-of-wealth" space.
- It concludes by noting that potential customer base for EIAs is limited and that utility theory underlying classical economics cannot explain the popularity of EIAs among retail investors.
Patrick J. Collins, Ph.D., CFA, CLU, is a principal of Schultz Collins Lawson Chambers Inc. in San Francisco, California.
Huy D. Lam, CFS, is an analyst at Schultz Collins Lawson Chambers Inc.
Josh Stampfli is a consultant for Schultz Collins Lawson Chambers Inc.
Ideally, investors would like to participate in the price appreciation of stocks, while protecting themselves against downside price movements during bear markets. One solution currently capturing much attention has the generic name of protected investment product (PIP), or principal protected security (PPS). These products have been discussed by Sharpe (2007); Marmorstein, Robinson, Schulte, and Trent (2006); Edwards and Swidler (2005); Baubonis, Gastineau, and Purcell (1993), among many others. A common form of PIP is an equity indexed annuity (EIA) contract, offered primarily through banks and insurance agents. Generally, the investor buys the EIA contract with a single premium in exchange for the promise from the insurer of a payoff based on the greater of a minimum guaranteed floor value or on the performance of a reference equity index. Most contracts are written for periods between 7 and 15 years, and the majority use the S&P 500 stock index as the reference index. If the index gains during the period, the contract owner participates in the price increase; if the index does poorly, the floor protects against substantial equity losses.
This paper is organized as follows. The initial section provides a brief outline of an EIA from the perspective of the insurance carrier that manufactures and manages the product. The next section discusses contract features important for calculating the payoff to the buyer and the costs to the manufacturer. Following a brief outline of various types of EIA products, the paper takes up the critical question of how a potential buyer should evaluate an EIA. We critique some evaluation approaches and suggest that both commonly used benchmarking comparisons and conclusions based solely on historical results achieved over finite periods may not provide appropriate preferencing criteria.
The choice of the benchmark and the start/end dates of the historical period under evaluation generate wildly differing evaluative results. Simulation analysis provides a suitable evaluation alternative only if the simulation process incorporates the higher moments that characterize the time series of equity financial returns. This means that the simulation must be capable of producing outlier results at a frequency and magnitude greater than expected in a normal (bell curve) distribution.
In the final section, we argue that EIAs should appeal to a subset of risk averse investors with greater than average sensitivity to changes in wealth. These investors select portfolio investments that provide sufficient payouts in recessionary economies rather than investments that maximize expected return or risk-adjusted expected return (the Sharpe ratio) over all possible future economies. However, this subset of investors may be quite small, given the ability to customize blends of risk-free instruments and equity positions in the current marketplace.
EIAs: Financially Engineered Products
As pointed out by Palmer (2006), when acquiring an EIA contract, neither the investor nor the insurer buys stocks. The investor buys an insurance contract that is guaranteed by the general assets of the underwriting company. The insurance company, in turn, uses the investor's premium for a threefold purpose: (1) to pay commissions, administrative costs, taxes, and other fees associated with implementation and ongoing administration (including, possibly, the costs of a dynamic hedging strategy); (2) to buy a fixed-income instrument (usually a zero-coupon bond) sufficient to fund the minimum guaranteed return; and, (3) to buy derivative financial contracts (usually call options) sufficient to fund the promised upside participation in the growth of the index. Thus, as demonstrated by Edleson and Cohn (1993), VanderPal (2004), and others, in many respects, an EIA contract shares both payoff and structural characteristics of derivative financial products. The financial engineering for EIAs involves embedding certain payoff options within an annuity contract structure.
The technical description of a typical EIA is important because it forms a rationale for both praise and criticism of the financial engineering approach to asset management. A financial engineering approach to risk control differs significantly from more traditional investment strategies based on asset allocation and diversification. But the first thing that can be said about EIA contracts is that they are fiendishly difficult to understand. Indeed, Moody's analysts Fliegelman, Robinson, and Riegel (2001) devote an entire research paper to the topic of ascertaining likely risk exposures given the opaque nature of the EIA contract.
Unlike a life insurance contract, which makes money for an insurer if actual investment and mortality experience are better than the assumptions embedded in the product's actuarial reserve account, an EIA provides the insurance company with limited opportunity for either actuarial or investment gains. The insurer must commit sufficient funds to the contract to ensure that the minimum guaranteed payout can be met in case of poor market performance, or that the company can pay the promised growth to the investor under favorable market conditions. The astute reader may point out that an insurer can "play games" with the guarantee by deliberately mismatching asset and liability duration (that is, interest rate sensitivities), or that equity hedge exposure may be imperfect because of a desire to decrease trading costs. But an insurer executes such strategies at its peril, and, should the company go bankrupt, at the contract owner's peril as well. When considering EIA contracts, it is wise to remember the advice of Ziemba (2003): "Selling guarantees is like smoking Cuban cigars while driving a dynamite truck; you better do it carefully."
But insurance companies will not create bundled products that they cannot sell at a profit. This leaves the fee portion of the premium as the initial primary source for insurer profit. As the realized returns of the reference index unfold over time, the insurer can also protect itself from losses or fine-tune its profits by exercising discretion on certain contract provisions. The discretionary nature of the EIA contract is detailed in the exposition on critical policy terms and provisions later in this paper. A critical issue, as pointed out in Boyle and Tian (2007), is the amount of premium in excess of the fair value (the "no arbitrage" value) that an investor is willing to pay to secure the EIA's upside participation/
downside guarantee benefits. All else equal, the more risk averse the investor, the greater the financial "haircut" the investor should be willing to endure. This is simply a variation on a theme that economists have preached for many years: the best investment is neither the cheapest nor the one that maximizes expected future wealth; rather, it is the one that maximizes the investor's satisfaction ("utility") of wealth. It seems as if investors like to both eat well and sleep well.
Critical Provisions of EIA Contracts
Equity indexed annuity contracts first appeared in the 1990s. According to Asl (2008), they have grown increasingly popular, and current annual sales exceed $27 billion. This suggests that many retail customers (defined as small investors unable to access the customized derivatives markets required to hedge longer-term equity exposures) are paying a lot of money to acquire these products. How do EIAs work?
Unfortunately, this is a simple question that has a complicated answer. In fact, to skip to the end, there is no way to judge ex ante how an EIA contract will perform either on an absolute or a relative basis. This is not merely a statement about the uncertainty of investment outcomes; rather, it is an acknowledgement that each EIA contract has so many moving parts that are under the discretion of the issuing insurer that it is difficult to determine whether company A's EIA structure is better or worse that company B's. Lewis (2005) employs the term "management discretion risk" to characterize the lack of predictability for EIA contract values, while Warner (2005) contends that "it's almost impossible to compare one product with another."
The following descriptions cover some of the critical elements common to most EIAs.
Minimum guarantee or "floor" value of the contract. Each EIA has a minimum guaranteed value to which the investor is entitled. In New York State, the minimum floor value must, by statute, equal 100 percent of the contract's initial premium. This 100 percent-of-premium floor is one reason why most contracts are sold by insurers without sales operations in New York (New York insists that its standards govern the national practices of any insurer admitted to do business in the state). Despite the fact that an EIA's contract term can last many years, New York does not require the insurer to credit any interest. The minimum floor level required by new nonforfeiture reserving regulations promulgated by the National Association of Insurance Commissioners is 87.5 percent of the initial contract premium. Most commonly, EIAs provide a minimum floor equal to 90 percent of the initial premium with a modest 2 percent to 3 percent annual interest credit. Given a reasonable factor for the time value of money, this provision suggests that the investor's downside risk is limited to approximately a 10 percent loss of principal.
Index participation rate. Each EIA declares a rate at which the investor shares in the growth of the reference index (usually the S&P 500). This participation rate varies from 50 percent to 100 percent of the index's price appreciation. No EIA contract currently credits the investor with dividend returns paid by the index. If, during the applicable measuring period, the S&P 500 index price increases by 10 percent and the dividend yield is an additional 2 percent, the index's total return is approximately 12 percent. An EIA contract with a participation rate of 80 percent, however, would calculate the investor's share as 80 percent of the 10 percent price appreciation, or 8 percent, versus the actual index total return of 12 percent. Many EIAs permit the insurer to reset the participation rate periodically during the term of the contract.
The yield-spread cost factor. After calculating the investor's share of index growth, many EIA contracts apply an additional adjustment known as a yield-spread cost factor. To the extent that the participation rate in index growth approaches 100 percent, the annuity purchaser can expect a high yield-spread cost; to the extent that the participation rate approaches 50 percent, spread costs tend to decrease. Yield-spread costs are fees paid to the insurer and are direct reductions in the investor's participation rate return. The annual costs range from approximately 1 percent to 4.5 percent. Typically, the insurer can periodically reset yield-spread cost factors.
The growth-rate cap. After applying the participation rate and yield-spread factor adjustments, a typical equity indexed annuity will apply a growth-rate cap. The cap sets a maximum crediting rate for the applicable period. Caps may be applied to periodic returns (for example, monthly increases in the reference index), to annual returns, or on a one-time basis to the aggregate net gain over the entire measurement period. If, for example, the investor's annual share of index growth is calculated at 7.5 percent, an EIA with an annual cap of 6.5 percent puts a ceiling on the amount of growth credited to the contract owner. Typically, the insurer can periodically reset the growth-rate cap.
Premium bonus credits. Many EIAs offer investors a bonus credit equal to a percentage of the initial premium deposited to the annuity. There are many variations in the methods for bonus calculation, but a common contract feature is that the bonus may be forfeited if the annuity is terminated prior to maturity.
Surrender charges. The existence of surrender charges means that the EIA is not a liquid investment. Shorter-term EIAs typically have surrender charges starting at 7 percent to 10 percent, grading down over the life of the contract. Longer-term EIAs may have graded surrender charges with the initial penalty as high as 20 percent. Application of a surrender charge, however, cannot reduce an investor's return to less than the minimum guaranteed value. Generally, a surrender charge is in force for the life of the contract and can be avoided only if the investor keeps the EIA in force until maturity. Contracts with high surrender charges often offer high participation rates, more favorable growth rate caps, and lower yield-spread costs. However, to protect the solvency and profitability of the insurer, most EIAs permit the insurer to reset these critical moving parts.
Market-value adjustment. Additionally, many EIAs impose a market-value adjustment if the investor surrenders the contract before the end of its term. A market-value adjustment can work in an investor's favor if the contract is surrendered in a low interest-rate environment, or to an investor's detriment if the contract is surrendered in a high interest-rate environment. A cynical reader may point out that market value adjustments are the very thing that the EIA contract holder seeks to avoid, but nevertheless, there they are—caveat emptor.
EIAs are not registered with the Securities and Exchange Commission by virtue of the fact that they are deemed to be insurance contracts and not securities. As a consequence, many EIA salesmen do not have a securities license and, in some cases, lack extensive training or background in security analysis. However, EIAs issued on or after January 12, 2011, are subject to SEC determination whether a contract is subject to applicable federal securities laws. If "the amounts payable by the insurer under the contract are more likely than not to exceed the amounts guaranteed under the contract," the contract may not qualify for the annuity exemption under Section 3(a)(8) of the Securities Act of 1933.
Historically, the sales agents have faced considerable challenges. These include the presentation of a complex product to the public and avoidance of any comparison between the insurance product to investment alternatives such as mutual funds. Most presentations compare an EIA to a bank certificate of deposit or money market fund. Regulators have raised a host of suitability-related issues, especially for retirees who are considering moving funds from bank CDs to EIAs; as discussed in Kuhlemeyer (2000), EIA contracts force "many insurance agents into areas that they are not legally equipped to handle." In general, according to Marmorstein, Robinson, Schulte, and Trent (2006), protected investment product contracts are difficult for the average investor to understand and evaluate.
Current EIA Product Menu
We now turn to a description of the current EIA product menu. What kinds of products can you buy and what kinds of payoffs can you expect to receive?
Although the moving parts allow for significant variation in contract offerings, most EIA contracts can be slotted into six general categories:
- Multi-year, point-to-point contracts calculate the payoff based on the difference between the reference index's value at the date of contract purchase and on the date of contract maturity. If the index share price has increased, the EIA owner receives interest credits according to the terms of the contract; if the share price has decreased, the EIA owner receives the guaranteed minimum value. No interest is credited until the end of the contract's term.
- Multi-year point-to-point averaged contracts calculate the payoff based on the difference between the reference index's value at the date of contract purchase and the average of the sum of the final 12 months' index prices. By averaging the last 12 months' price level, the contract cushions investors against a calamitous decline in value toward the end of the contract's term. No interest is credited until the end of the contract's term.
- High-water-mark contracts use more than two reference points (ending value minus beginning value) to determine the amount of gain on which the EIA owner's interest credit is calculated. Typically, over a seven- to ten-year period, a high-water-mark EIA samples the index value at the purchase date's annual anniversary. A seven-year contract would, therefore, have seven index value reference points, and, as the name implies, the highest reference point value is designated as the contract's ending value for interest calculation purposes. No interest is credited until the end of the contract's term.
- Annual-reset contracts are single-year, point-to-point contracts that reset the interest crediting rate formula each year. If the index experiences negative price appreciation for any contract year, the credited interest rate is zero. Annual-reset contracts calculate and credit interest each year. Once the interest is credited to the accumulation value, it is locked in, irrespective of the index's future performance. Of course, any nonguaranteed elements such as the participation rate, yield-spread cost, and interest-rate cap are also subject to periodic reset by the insurer throughout the contract's term.
- Annual-reset averaged contracts use an averaging method to calculate interest credits, as opposed to an annual beginning and ending price difference. The average becomes the "ending" value on which index gain is determined. Averaging smooths price volatility, and therefore further dampens index gains and losses. Interest is calculated and credited each year.
- Annual-reset monthly cap on gain contracts are monthly point-to-point contracts that calculate interest crediting using adjusted monthly changes in the index's share price, but which credit interest at the end of each contract year. Typically, monthly index gains are capped at 2 percent to 3 percent with no cap on monthly index price declines. The sum of the capped monthly gains and the uncapped monthly losses equals the index's annual gain for the year. If the annual "gain" is negative, the EIA, as expected, credits the index with zero gain. Interest is calculated and credited each year. There is anecdotal evidence that contracts using the annual-reset monthly cap on gains pay, in general, the highest sales commission, and are the most widely sold EIA products.
Evaluating the EIA Contract
Although there are several metrics by which an EIA contract may be valued, there is no perfect method for determining the "best" contract. This said, we evaluate the merits of the various contract types by comparing EIA payoffs with the S&P 500 stock index (reduced by a reasonable factor for investment fees and trading expenses). The initial figures focus on a $100,000 investment in a seven-year, point-to-point contract with a guarantee of 90 percent of the initial premium, a 3 percent interest credit minimum guarantee, a $5,000 bonus credit, a 75 percent index price appreciation participation rate, a 1 percent yield-spread fee, and an 8 percent cap on yearly gain. The analysis assumes that the investor holds the contract for the full seven-year term. If this were not the case, additional surrender charges might reduce realized returns.
Figure 1 considers a range of possible ending values for the S&P 500 index's total return over the interval: –10 percent through +110 percent. The red line represents the stock index, in which the investor participates dollar-for-dollar in the gains and losses. By contrast, the EIA contract (blue line) puts both a cap and a floor on gains. The equity indexed annuity is attractive for the investor wishing to cede a portion of potential upside gain in return for minimum guaranteed returns. The astute reader may recognize that the EIA's payoff mirrors that achievable through the sale of a covered call option on the stock index and the purchase of a put option, each having the same strike date. Thus, by one metric, a short-call/long-put position is a no-arbitrage replicating portfolio, although the slope of the EIA payoff line is less steep because of the absence of dividend income, as well as other constraints on returns.
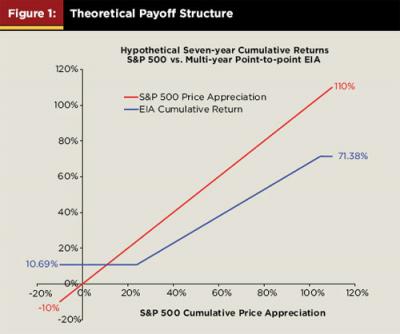
Figure 2 shows how an investor fared historically with a representative point-to-point contract payoff structure. It depicts the payoffs on an initial investment of $100,000 received by an EIA contract owner over a monthly series of rolling seven-year (84-month) periods beginning in December 1996 through December 2008. It compares the EIA payoffs to those received by investors holding the S&P 500 index (adjusted by a reasonable factor for fees and expenses) in comparable seven-year investment periods (total of 228 months of S&P 500 return data).
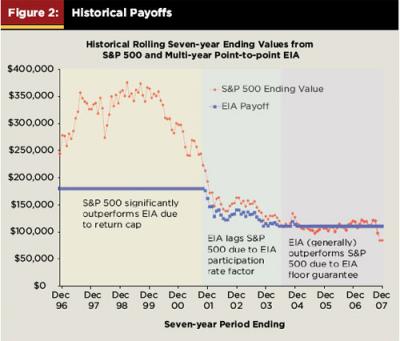
Figure 2 illustrates the floor/cap payoff structure offered by the seven-year, point-to-point EIA. An investor whose contract matured in the mid-1990s might conclude that the equity index annuity was a poor investment; the reverse is true for investors having their contracts mature after January 2006. If nothing else, Figure 2 demonstrates that evaluations based on historical results are highly sensitive to the beginning and ending dates, and therefore, although interesting, should be viewed with some suspicion. Although Figure 2 suggests that the EIA contract holder incurred, on average, a significant opportunity cost during the period under evaluation, there is nothing to suggest that this will be the case for the forthcoming period. For the EIA contract types that employ averaging methods, results are path dependent, and any evaluation metric based on historical results approaches mere conjecture.
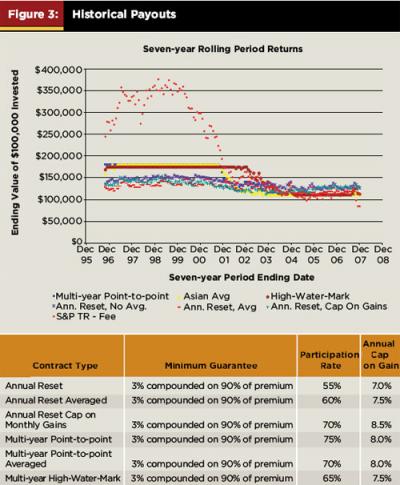
For the sake of completeness, Figure 3 depicts the payouts of the six types of representative EIA contracts.
Figures 2 and 3 are examples of evaluating financial instruments in isolation as opposed to in the portfolio context. For example, VanderPal (2004) and others have periodically evaluated index annuity payoffs by comparing returns to single benchmarks ranging from the S&P 500 stock index to certificates of deposit. Analysis is often period specific, isolates the comparison to a single investment alternative, may be highly sensitive to the start and end dates of the period under evaluation, and, at the end of the day, may represent only exercises in data mining.
Benchmarks Critical in EIA Comparisons
When comparing an EIA contract to an S&P 500 index fund, it appears reasonable to argue that the EIA product approach is, in the main, suboptimal. By inspection, the area beneath the historical curve of the S&P 500 payoff is much greater than the area under the EIA payoff curve. However, if an EIA contract is compared with a certificate of deposit, it may be reasonable to argue that, barring a need to maintain liquidity, an EIA contract is a reasonable alternative. Commentators often evaluate EIAs favorably or unfavorably depending on the comparative benchmark financial instrument. But given the fact that the equity indexed annuity is a bundled product consisting of both equity options and fixed-income guarantees, it is appropriate to evaluate its payoff functions within a broader portfolio context.
Fortunately, we have alternate means to evaluate EIA payoffs within a structure that combines the comparative benchmarks into a portfolio context. Given the time series of returns on the reference index, a model of future return evolutions is available through simulation analysis. No one knows what the actual future vector of seven-year returns will look like. But by simulating thousands of such vectors based on historical data, a rich set of probable future results is available for inspection. The investor can estimate how likely it is that the EIA's guaranteed minimum return will generate a payoff greater than the reference index, and, conversely, the likelihood that the EIA will impose an opportunity cost because it lags the reference index's total return.
It is well known that S&P 500 index returns exhibit leptokurtosis (fat tails) at a probability higher than found in a normal (bell curve) distribution. To capture this characteristic of the return series, we simulate returns based on a mixture of two normal distributions. This technique is commonly used by econometricians seeking to generate return series with outlier results at a magnitude and frequency greater than found in a Gaussian (bell curve) distribution. Thus, our simulation uses a return distribution (mean and variance) characteristic of bull markets and a second distribution with returns characteristic of bear markets.
Although the initial month's choice of regime is random, follow on monthly returns reflect the probability of remaining in a regime. Probabilities for remaining in a regime are based on average regime lengths calculated from historical data (1973 to present). The computer draws a "remain in" or a "switch from" signal based on the underlying odds that characterize each regime. The odds of a switch from a bull to bear are less than the odds of a switch from a bear to a bull, because bear markets are generally shorter than bull markets. A bear market is defined as a 20 percent or greater peak-to-trough price decline for the Capital Appreciation S&P 500 stock index. As pointed out by Alexander (2008) and others, the great advantage of this methodology is its ability to replicate the persistence of a bull or bear regime over time. This is unlike, for example, bootstrapping methodologies, which exhibit month-to-month changes from bull to bear.
Figure 4 depicts 5,000 simulated trials, each of which invests an initial amount of $100,000 into a portfolio consisting of various allocations to the S&P 500 stock index and a one-year, U.S. constant maturity T-bill return series. Each portfolio is adjusted by a 50 basis points yearly fee. Return distributions record the portfolio's seventh year value at a 90 percent confidence interval. The portfolio allocations are buy-and-hold positions (no rebalancing) ranging from 100 percent S&P 500/0 percent T-bills to 50 percent S&P 500/50 percent T-bills. The more risk averse the investor, the greater the propensity to anchor the portfolio with a large allocation to T-bills. The simulation uses monthly historical returns over the period 1973 through 2008.
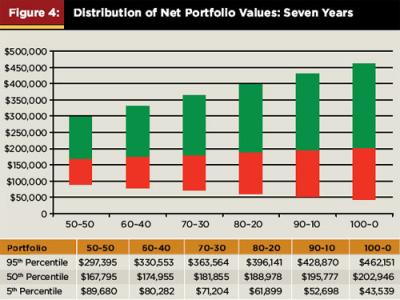
For evaluative purposes, the critical values are the lower-bound EIA guaranteed payout of $110,689, and the upper-bound payout of $179,952. The statistics of interest focus on the likelihood that the EIA contract's lower-bound floor payout is greater than the payout of the T-bill/S&P 500 portfolio, and the likelihood that the EIA contract's upper-bound cap is less than the payout of the T-bill/S&P 500 portfolio. The percentage of portfolio values less than the EIA contract's lower-bound floor represents the frequency at which the EIA owner benefits from the minimum payout guarantee. The percentage of portfolio values greater than the EIA contract's upper-bound cap represents the frequency at which the EIA owner suffers opportunity costs. Of course, the frequency at which the contract's payout is truncated by the upper-bound limit is not the sole measure of opportunity cost because payout values between the lower- and upper-bound limits are also reduced by a variety of EIA contract provisions.
The blue columns in Figure 5 demonstrate the percentage of trials in which the EIA's guaranteed minimum payoff exceeds the investment portfolio's payoff. In these cases, the investor benefits from owning the EIA.
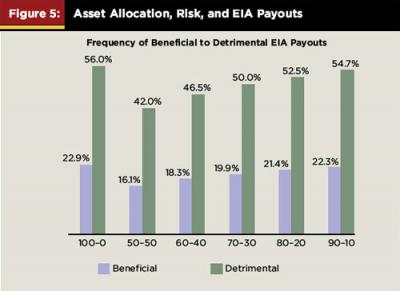
For example, the left-most set of columns shows that, compared with the 100 percent S&P 500 index portfolio, the representative seven-year, point-to-point EIA contract benefits the investor approximately 22.9 percent of the time. That is, in 22.9 percent of simulated trials, the payoff of the portfolio allocated 100 percent to stock was less than the guaranteed minimum EIA payout. By contrast, the 50-50 safety-first allocation (50 percent of the portfolio invested in T-bills) is less than the EIA's minimum payoff only 16.1 percent of the time. Moving across the horizontal axis, the figure depicts a steady, albeit limited, increase in the likelihood that, at the end of the day, the EIA contract holder achieves a minimum return in excess of returns achieved by various asset allocation mixes. As demonstrated by Collins, Savage, and Stampfli (2000), additional portfolio diversification—for example, inclusion of other asset classes such as real estate, foreign bonds, and international equity—is likely to improve the lower-bound payoff of a diversified portfolio, thus reducing further the likelihood that the investor will benefit from the EIA.
The green columns record the percentage of trials in which the investment portfolio's payoff exceeds the EIA's upper-bound payoff limit. For example, an investor allocating 100 percent of funds to the stock index can expect to regret the EIA purchase decision 56 percent of the time. That is to say, in 56 percent of all future economies, a portfolio with a 100 percent stock allocation achieved a payoff greater than the upper-bound payoff received by the EIA contract owner. In this case, the EIA owner "regrets" his or her decision. As the allocation substitutes T-bills for stock, there is a steady decrease in the likelihood that the investor experiences regret. The most risk averse investor can expect to regret the EIA purchase decision 42 percent of the time.
Figure 5 illustrates the ability to "synthesize" downside protection in the financial markets at relatively low cost by adding T-bills to the portfolio. For example, an allocation of 20 percent S&P 500/80 percent T-bills provides, at a 90 percent confidence interval, an estimated range of returns from $116,924 to $199,804 with a median expected return of $147,433. Although the two products span the same investment opportunity set, the stock/T-bill portfolio payout distribution dominates, albeit not in the far left tail, the EIA payout distribution. It is worth reiterating that, given the myriad of costs embedded within the annuity, the EIA contract's payoff always lags the investment portfolio's payoff for returns between the upper- and lower-bound limits.
Who Should Buy an EIA?
Many investors might conclude that the opportunity costs of the annuity outweigh its downside benefits. The previous graphs, however, only tell part of the story. Investors with a strong preference for payoffs in recessionary economic states may readily trade the opportunity to maximize a portfolio's P&L or risk-adjusted Sharpe Ratio in favor of hedging consumption opportunities with assets providing a minimum payoff when the investment opportunity set is poor. Viewing the decision from the more classical economic framework of utility theory provides additional insight.
Clearly, an EIA is not a liquid investment, and formidable surrender penalties preclude it from consideration as a precautionary savings vehicle for potential future expenses during times of economic distress. This implies that a prospective EIA purchaser will fund the contract from longer-term investable funds. Investors with a relatively low wealth-to-income-need ratio may consider even a small loss of discretionary funds to be financially catastrophic. These investors will move from portfolios designed to maximize P&L to portfolios designed to protect against penetrating minimum floor values required to fund threshold standard of living requirements. At the limit, this type of investor may become hypersensitive to changes in wealth as the portfolio approaches this critical floor value. A graph of the true portfolio ranking criteria would occupy utility-of-wealth space rather than dollar-value-of-wealth space. Thus, despite the fact that the EIA's distribution of dollar-value payoffs appears inferior, the floor guarantee may be sufficiently attractive to motivate interest in buying such a contract. By contrast, investors with a relatively high wealth-to-income-need ratio may find the EIA contract to be an inferior alternative.
The upshot of these observations is that the potential customer base for EIA contracts appears limited. The illiquidity of the contracts makes them generally unsuitable for individuals with low levels of wealth. The potential buyer of an EIA contract has discretionary long-term wealth but, nevertheless, exhibits a great sensitivity to downside risk. But the greater the discretionary wealth or the greater the ability to tolerate long-term illiquidity, the greater the likelihood that the investor exhibits constant relative risk aversion. In this case, the investor enhances utility by selecting the investment portfolio alternative.
How well does investment theory match reality? The answer to date is "not well." The boom in EIA sales indicates a steep demand curve for this product. The source of demand may reflect consumer willingness to pay a premium for a "pre-fabricated" product that provides downside protection without the inconvenience of investment portfolio management, a lack of awareness of the potential costs of acquiring downside protection through an annuity-based solution, the tax-deferral benefits of the annuity contract structure, or the efficacy of a well-designed product marketing campaign. Whatever the factor or factors determining EIA sales growth, the discrepancy between theory and reality remains puzzling.
References
Alexander, Carol. 2008. Practical Financial Econometrics. John Wiley & Sons: 161–163.
Asl, Farshad M. 2008. "Help Your Clients Understand Indexed Annuities." California Broker January: 18.
Baubonis, C., G. Gastineau, and D. Purcell. 1993. "The Banker's Guide to Equity-Linked Certificates of Deposit." The Journal of Derivatives Winter: 87–95.
Boyel, Phelim and Weidong Tian. 2007. "The Design of Equity Indexed Annuities." Working Paper April 2 www.stats.uwaterloo.ca/Faculty/TianPub.shtml.
Collins, Patrick, S. Savage, and J. Stampfli. 2000. "Financial Consequences of Distribution Elections from Total Return Trusts." Real Property, Probate and Trust Journal 35. (Summer): 243–304.
Edleson, Michael E. and J. Cohn. 1993. "Equity-Linked Products: Having Your Cake and Eating It Too?" Journal of Financial Planning 6, 1 (January): 20–27.
Edwards, Michelle and Steve Swidler. 2005. "Do Equity-Linked Certificates of Deposit Have Equity-Like Returns?" Financial Services Review 15: 305–318.
Fliegelman, Arthur, Scott Robinson, and Robert Riegel. 2001. "Equity Index Annuities: Complexity Personified." Moody's Investors Service Global Credit Research November: Report Number 71775.
Kuhlemeyer, Gregory A. 2000. "The Equity Index Annuity: An Examination of Performance and Regulatory Concerns." Financial Services Review 9: 327–342.
Lewis, W. Chris. 2005. "A Return-Risk Evaluation of an Indexed Annuity Investment." The Journal of Wealth Management Spring: 43–50.
Marmorstein, Howard, Thomas Robinson, David Schulte, and William Trent. 2006. "Evaluating the Offering Documents for Principal Protected Securities." Journal of Financial Planning 19, 12 (December): 60–66.
Palmer, Bruce. 2006. "Equity-Indexed Annuities: Fundamental Concepts and Issues." Insurance Information Institute October: www.iii.org.
"SEC Improves Protections for Seniors and Other Investors in Equity-Indexed Annuities" www.sec.gov/news/press/2008/2008-298.htm.
Sharpe, William F. 2007. Investors and Markets: Portfolio Choices, Asset Prices, and Investment Advice. Princeton University Press: 149–183.
VanderPal, Geoffrey. 2004. "The Advantages and Disadvantages of Equity Index Annuities." Journal of Financial Planning 17, 1 (January): 56–62.
Warner, Joan. 2005. "EIAs: Behind the Hype." Financial Planning October: 65–69.
Ziemba, William. 2003. The Stochastic Programming Approach to Asset, Liability, and Wealth Management. The Research Foundation of AIMR: 85.