Journal of Financial Planning: July 2021
Dr. Robert Pokorski is a thought leader, author, and lecturer who is committed to educating financial professionals and their clients about real-life events that can threaten retirement security. He holds an MBA from Heriot-Watt University in Edinburgh, Scotland, and a Doctor of Medicine from Creighton University School of Medicine in Omaha, Nebraska.
NOTE: Click on images below for PDF version.
Many clients are unwilling to plan for long-term care (LTC) because they’re in the “Goldilocks” phase of life where their health, wealth, physical abilities, and memory are “just right.” They can’t imagine, or don’t want to imagine, a time when life is far different from today.
The intent of this paper is to help financial professionals overcome this objection by providing them with the most recent data concerning LTC and caregiving, and suggesting positioning strategies (which are called “Points of Engagement” in the paper) to facilitate the discussion. This dialogue will open the door to additional discussions about investments, wealth transfer, financial planning, and product options.
The paper is organized as follows: (1) Previous Literature, (2) The 5 Ws of Long-Term Care, (3) Meet the Caregivers, (4) Costs Incurred by Care Recipients, (5) Costs Incurred by Caregivers, and (6) Conclusions. The focus is solely on establishing the need, not on strategies to pay for LTC.
Previous Literature
National estimates of the likelihood of needing LTC or being a caregiver are rare.
Likelihood of Needing LTC
Financial service companies that serve the older age market generally cite the estimate made by Kemper, Komisar, and Alecxih (2005) that 69 percent of people who turned 65 in 2005 will need LTC later in life. (Companies typically state that “7 in 10 people will need LTC.”) This study is old—it was published in 2005—and it was based on data mainly from the 1980s and 1990s (Johnson 2019). Newer and far more detailed estimates of the likelihood and duration of LTC were made by Favreault and Dey (2015) and, most recently, by Johnson (2019). Data in the latter paper were used in this article.
Likelihood of Being a Caregiver
The most authoritative resource for information about caregiving is a series of five reports (1997, 2004, 2009, 2015, and 2020) titled “Caregiving in the U.S.” Each report was published jointly by the National Alliance for Caregiving and AARP (https://www.caregiving.org/research/caregivingusa/). The 2020 report (Whiting et al.), plus a national caregiver survey by the Government Accounting Office (Jeszeck 2019), were the main sources used to discuss challenges faced by caregivers.
The 5 Ws of Long-Term Care
This section addresses the fundamentals of this topic: the why, who, where, when, and what duration of LTC.
Why Will We Need Long-Term Care?
According to the Health Insurance Portability and Accountability Act (HIPAA) of 1996 (Drabek and Marton 2015), a person is considered to be disabled if he/she has been certified by a licensed healthcare practitioner as:
- Being unable to perform (without substantial assistance from another individual) at least two activities of daily living (ADLs), including bathing, dressing, eating, toileting, and transferring in or out of a bed or a chair, for a period of at least 90 days due to a loss of functional capacity; or
- Requiring substantial supervision to protect such individuals from threats to health and safety due to severe cognitive impairment.
A version of this definition is used in most insurance and annuity products that provide a benefit for LTC.
The medical conditions that meet this definition are serious illnesses where recovery is generally not expected, such as Alzheimer’s disease and other forms of dementia, severe stroke, crippling arthritis, severe brain and spinal cord injuries, Parkinson’s disease, and other progressive degenerative neurologic conditions (Table 1, Column 1). The definition also includes some accidents and conditions where recovery eventually occurs, but the period of disability lasts longer than 90 days. Examples include serious automobile accidents, some brain and spinal cord injuries, moderate stroke, and some fractures and surgical procedures (Table 1, Column 2). All these illnesses can have a tremendous impact on families because care is needed for months or years, and many expenses are not paid by Medicare, Medicare Supplement Insurance (Medigap), or private health insurance.
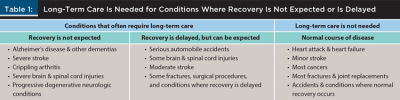
Many other medical conditions are serious, perhaps even life-threatening, but they don’t generally meet the HIPAA definition for disability because they don’t cause severe cognitive impairment or limit the ability to perform the activities of daily living, or the period of disability is generally less than 90 days. Examples include heart attack, heart failure, minor stroke, most cancers, most fractures and joint replacements, and accidents and conditions where normal recovery occurs (Table 1, Column 3). These illnesses are usually less worrisome from a financial and care perspective because care is needed for only a few days, weeks, or months, and most expenses are paid by Medicare, Medigap, or private health insurance.
Points of engagement
- Discuss the conditions in Table 1 and emphasize Alzheimer’s disease. Clients won’t be surprised; they’ve been thinking about this illness from the moment you first mentioned LTC. Tell them that the likelihood of developing Alzheimer’s disease or another dementia increases with age, that it can affect anyone, including people who take superb care of their health, that it’s unpredictable, and that it can rob us of our ability to do even the most basic human functions. Alzheimer’s disease also has the potential to impoverish families, deplete a once-robust inheritance that took a lifetime to accumulate, and turn spouses1 and adult children into caregivers.
- Emphasize the requirement that a condition must limit the activities of daily living for at least 90 days and/or cause severe cognitive impairment. “Serious,” “life threatening,” and “expensive” are not criteria for LTC.
Who Will Need Long-Term Care?
Many clients believe that “other people” will need LTC. The reality is much different.
Johnson (2019) used national data from the Health and Retirement Study (https://hrs.isr.umich.edu/about) to estimate the percentages of people who will need LTC for 90 days or longer according to HIPAA criteria. The projections were as follows:
Individuals. For people aged 65, 64 percent of men and 75 percent of women will need LTC for 90 days or more sometime later in life.
Couples. Data for individuals can be used to calculate joint probabilities for couples (Figure 1). In 91 percent of 65-year-old couples, one or both people will need LTC for 90 days or more sometime later in late.
- Man only: 16 percent of couples [64% × (1-75%) = 16%].
- Woman only: 27 percent of couples [75% × (1-64%) = 27%].
- Both man and woman: 48 percent of couples [75% × 64% = 48%].
- Neither: 9 percent of couples [(1-64%) × (1-75%) = 9%].
- Total: 91 percent [16% + 27% + 48% = 91%].

The same formulae can be used to determine joint probabilities in same-sex couples. Eighty-seven percent of 65-year-old male-male couples and 94 percent of 65-year-old female-female couples will need 90 days or more of LTC (calculations not shown). Female-female couples have a higher likelihood of needing care because they are individually at higher risk than males.
Points of engagement
- Most individuals and couples will need LTC for 90 days or more.
- The marketing materials used by many financial service companies have outdated estimates of the likelihood of needing LTC. Few of these estimates, if any, list the joint probabilities for couples.
Where Will Long-Term Care Be Provided?
Financial professionals can introduce this topic by sharing some reassuring news with their clients. Most people will never be in a nursing home unless they are visiting a relative or friend, or if they need a brief period of convalescent care after an illness or injury.
In 2014, 75 percent of adults ages 65 and older who needed LTC lived at home, 15 percent were in assisted living or similar care settings, and only 10 percent were in nursing homes (Figure 2, Freedman and Spillman 2014). Since then, use of nursing homes for LTC has become even less common due to financial and regulatory challenges, and new Medicare and Medicaid reimbursement policies that favor less expensive care at home rather than in a nursing home (Span 2018). More than 550 nursing homes have closed since June 2015, the rate of closure increased year-over-year, and the national occupancy rate decreased even as more facilities closed (Flinn 2020).

Points of engagement
- Emphasize the good news that most people will be cared for at home. A later section of this article will address an unsettling trend: this caregiving model is under stress because the number of potential caregivers is decreasing.
When Will We Need Long-Term Care?
It’s often difficult to engage clients in a discussion of LTC because they’re in the “Goldilocks” years of their life. Prepare them for what comes next. The likelihood of needing LTC skyrockets with advancing age.
Drabek and Marton (2015) reported that only 6 percent of men and 5 percent of women needed LTC at age 65 (Figure 3). By age 80, it was 20 percent of men and 24 percent of women. At ages 90 and older, more than 4 in 10 men and almost 6 in 10 women needed someone to help them with the most basic daily activities, such as bathing and dressing.

The dramatic increase in LTC at older ages highlights a paradox that will be disconcerting to clients, especially those who believe that exercise, diet, and a healthy lifestyle will guarantee a disability-free retirement. Healthy people generally live longer, but they don’t necessarily avoid LTC. They may just postpone it to an older age. Why? The longer you live, the more likely you are to develop a serious, disabling condition (Table 1).
Not only will clients be older when they need LTC, but many of them will be alone (Table 2). In the first decade of retirement—ages 65 to 74—only one in six men and one in four women live alone. The likelihood of living alone increases rapidly thereafter, mainly due to widowhood. At ages 85 and older, one in four men and half the women are living alone. And because women are more likely to be widowed and to live longer, there are more than three women living alone at ages 85 and older for every one man living alone at these ages (Medicare 2016).

Points of engagement
- Remind clients that the “Goldilocks” years of retirement won’t last forever. With the passing of each year, a higher percentage of people will need LTC, and more of them will be living alone, especially women.
- “Do everything you can to stay healthy” is excellent advice, but it’s not a panacea. Healthy people generally live longer, but they may still need LTC at an older age.
What Duration of Long-Term Care Will Be Needed?
Among clients who are proactive in planning for LTC, one of the most common questions is, how much will it cost? The discussion begins with an analysis of how long it might last.
Johnson (2019) estimated that 36 percent of 65-year-old men will never need LTC, 30 percent will need care for up to two years, and 14 percent for two to four years. Among 65-year-old women, 25 percent will never need LTC, 26 percent will need care for up to two years, and 16 percent for two to four years. For longer durations where costs have the potential to overwhelm all but the wealthiest retirees, the estimate was that 32 percent of women will need LTC for four years or longer, compared to only 20 percent of men (Figure 4).

Women generally need care for longer durations than men, partly because of differences in how they react to serious health problems at older ages. In many cases, men die while women survive but are disabled. This observation is immediately clear when visiting a senior center, assisted living facility, or nursing home, where women represent a strong majority of the population.
Points of engagement
- LTC duration is variable and highly unpredictable, which means it’s difficult to estimate how long it might last and how much money might be needed. Expenses could overwhelm the one in five men and one in three women who will need care for four years or more.
- Remind client couples that older women are more likely to survive, but they are often disabled.
Meet the Caregivers
This section discusses challenges faced by clients who are, have been, or will be unpaid caregivers, including spouses, adult children, other relatives, and non-relatives. The emphasis will be on spouses and adult children because they play a unique role: their dedication makes it possible for disabled family members to stay in their homes and avoid costly care in a nursing home (Scommegna, Mather, and Kilduff 2018).
New Terminology
Financial professionals need to be aware of changes in the language used to describe caregivers. This is especially important for those who specialize in LTC, eldercare, and financial planning for older adults. These changes were deemed necessary because some of the existing terminology was thought to minimize the complex role played by today’s caregivers.
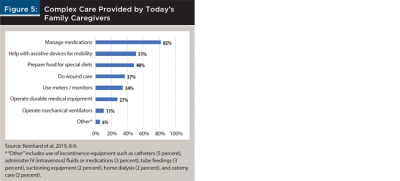
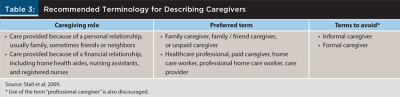
One term to avoid when talking with clients is “informal caregiver,” which originated in the 1980s as a way to describe family caregivers who provided services that were considered “non-essential,” such as emotional support and help with personal care, household chores, and tasks that could be done without training and support. Some family caregivers found this term insulting because it trivialized the level of care they provided (Stall et al. 2019). The care model has changed dramatically since the 1980s. Today, hospital stays are much shorter, and there are financial incentives to move patients to care locations where costs are lower. Many homes have become de facto hospitals or skilled nursing facilities where the overwhelming majority of care is provided by family caregivers who deliver care that was historically provided only by healthcare professionals (Reinhard et al. 2019). These duties include everything from managing medications to wound care, operating medical equipment and ventilators, administering intravenous (IV) fluids or medications, and home dialysis (Figure 5).
Another term to avoid is “formal caregiver,” a designation applied to licensed caregivers who are paid for their services such as home health aides, nursing assistants, and registered nurses. Labeling someone as a “formal” caregiver implies that family caregivers, who generally provide most of the care, are “informal” and less important. Use of “professional caregiver” is also discouraged because it implies a lower standard for the complex care provided by family caregivers.
Table 3 shows the new terminology that is recommended by AARP, the American Geriatrics Society, and some other organizations that address care issues that are important to older adults (Stall et al. 2019).
Points of engagement
- Use the recommended terminology to show clients that you are aware of the critical role they play or will play as family caregivers. Avoid “informal caregiver,” “formal caregiver,” and “professional caregiver.”
- Figure 5 shows real-world challenges that many clients will face. Younger clients with older parents may provide this level of care in the future, and older clients may receive this type of care from a spouse or their adult children. They just don’t know it yet.
Number of Caregivers
A study by the United States Government Accountability Office (GAO) reported that an estimated 45 million Americans provided unpaid care each year (for years 2011 to 2017) to older adults who needed help because of conditions relating to aging (Jeszeck 2019).2 About 3.2 million people (7 percent of all caregivers) were spouses3 who cared for each other, 23.4 million (51 percent) were adult children who cared for their parents, 12.4 million (27 percent) were family members who cared for other relatives such as grandparents, siblings, and aunts and uncles, and 10.4 million (23 percent) were caregivers for non-relatives (Figure 6). Women represented 63 percent of spouses who cared for each other and 56 percent of children who cared for their parents.
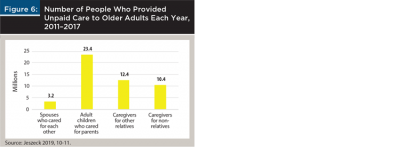
The number of caregivers in Figure 6 totals more than the 45 million cited above because some caregivers helped more than one person. Similar findings were reported by “Caregiving in the U.S. 2020,” a national survey sponsored by AARP and the National Alliance for Caregiving, which found that 24 percent of caregivers were helping more than one adult (Whiting et al. 2020). Reasons included an aging population with more people who need care, a shortage of unpaid (family) and paid caregivers, and the shift from nursing homes to care at home and in assisted living facilities.
One of the most noteworthy points in Figure 6 is that there were seven times as many adult children caring for parents (23.4 million) as there were spouses caring for each other (3.2 million). This observation will help financial professionals address a common misconception among client couples—namely, they don’t need to plan for LTC because they will take care of each other. Spouses are the initial caregivers and often shoulder the largest burden in terms of frequency and duration of care, but then real life happens. They age together, and when care is needed late in life, spouses may be too old or infirm to care for each other, or one may be widowed. At that point, adult children become the main caregivers.
A study by the Population Reference Bureau (Scommegna 2016) highlighted the individuals who were more likely to be caregivers within a family. Wives generally provided more assistance than husbands, in part because wives were often younger than their husbands and were less often disabled, daughters provided more care than sons, and family members were more likely to be caregivers if they lived near older parents.
Points of engagement
- Client couples may try to preempt a discussion of LTC by saying, “We don’t need to plan for LTC because we’ll take care of each other.” Use Figure 6 to introduce the idea that adult children, not spouses, provide most of the care. Spouses, adult children, and other caregivers need a plan, plus all the financial help they can get.
- Emphasize that wives and daughters bear the burden of caregiving, and proximity to a parent increases the likelihood of being the main caregiver. What might this mean to clients in terms of their time, job, and the financial impact on their family?
Caregiving Can Be Frequent and Long
Table 4 shows the frequency of care for older adults in the GAO report (Jeszeck 2019). Spouses were much more likely (81 percent) than adult children (21 percent) to provide daily care. However, twice as many adult children as spouses provided daily care. For all caregiving frequencies other than “Daily,” the caregiver was far more likely to be an adult child than a spouse.
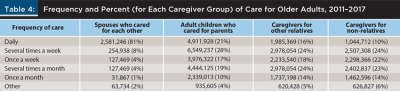
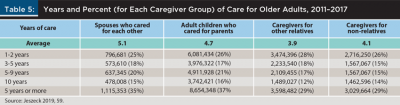
Table 5 further emphasizes the importance of adult children as caregivers by showing years of care. There were far more adult children caring for parents for all durations than there were spouses caring for each other. For example, just over one-third of spouses (35 percent) and adult children (37 percent) provided care for five years or more, but there were eight times as many adult children (8,654,348) as spouses (1,115,353) who provided care for five years or longer.
Points of engagement
- Most LTC is provided by adult children, who almost never save money for their parents’ care.
- Ideally, clients’ financial plans will provide both their spouse and their adult children with funds to care for them.
Adult Children May Be Retired but Still Caring for Parents
Couples know they may not be able to care for each other. Their backup plan is simple: their children will care for them. Children know they may need to care for their parents, and they promise to do it. What spouses, parents, and children don’t realize is what can happen as years and then decades pass. Here’s a convincing story that will help financial professionals engage their clients in a discussion of what the future might hold.
A 65-year-old couple decides they don’t need to plan for LTC. They will take care of each other, and if something unexpected happens, their two children, ages 40 and 42, promise to care for them. Twenty years later, the husband develops a serious health problem at age 85. His wife, the primary caregiver, cares for her husband, who dies after a short illness. What just happened? The wife lost her primary caregiver, and she is now alone. Five years later, at age 90, she develops Alzheimer’s disease or one of the other disabling illnesses listed in Table 1 that will require care for the remainder of her life. Her two children, the secondary caregivers who promised to care for their parents, are ages 65 and 67 and retired. Then they get the call. Mom needs them. Could this really happen? Yes, and more often than people imagine.
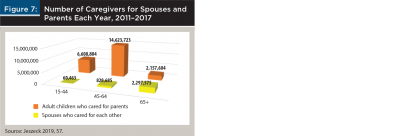
Figure 7 shows the number and ages of caregivers for spouses and parents in the GAO report (Jeszeck 2019). As expected, spouses who cared for each other were generally much older than most caregivers; 72 percent were ages 65 and older (Figure 8). What makes the aforementioned story so convincing is the age distribution of adult children who cared for their parents; 9 percent—1 in 11—were 65 and older, ages when most people are retired. And a strong majority (63 percent) of the other adult children who cared for their parents were 45 to 64, ages when most people are paying off home mortgages, saving for college and retirement, and perhaps planning for an early retirement. To complete the message about how caregiver age can affect the financial security of clients who become caregivers, 10 percent of caregivers for other relatives (often siblings) were ages 65 and older, as were 29 percent of caregivers for non-relatives, and many others in both of these groups were ages 45 to 64 (Jeszeck 2019).

Points of engagement
- Customize the previously shared story for clients. Couples don’t want to imagine a time when they are alone or unable to care for each other because of advanced age or illness. They hope they won’t need to rely on their children, whom they picture as they are today: robust, young adults. However, most care will be provided by their children (Figure 7), and some of them will be near or past retirement age (Figure 8) when they are needed.
- Remind clients that the obligation to care for our parents doesn’t end when we reach ages 65 or 70, or the day we retire. It continues for as long as they need our help. For some middle-aged and retired clients, a retirement full of travel, new experiences, and self-actualization will have to wait. They’ll be caring for mom, dad, or another loved one.
We’re Running out of Caregivers
Lower Caregiver Support Ratio. Clients may not have a financial plan for LTC because they think family and friends will provide free care for them. They could be in for an unwelcome surprise.
The pool of potential caregivers for older people will shrink over the next 30 years. It’s a problem of supply and demand. On the supply side, there will be fewer caregivers because families are smaller and more geographically dispersed, and more women, who are the primary caregivers, will be in the workforce and unable to provide as much care as in the past (Edwards et al. 2020). On the demand side, more LTC will be needed because the number of people ages 65 and older will increase. In particular, the 85-plus population will more than triple by 2050 (Houser, Fox-Grage, and Ujvari 2018), older people will live longer because of improved life expectancy, and more of them will be disabled because of the increasing prevalence of chronic health conditions (Thach and Wiener 2018).
The caregiver support ratio compares the number of potential caregivers in the peak caregiving ages of 45 to 64 to the number of people in the peak care-needing ages of 80 and older. As the disproportionately large baby boom generation ages, the caregiver support ratio will decline from about seven potential caregivers today to four in 2030 and, finally, to only three potential caregivers in 2050 when the last of the baby boomers reaches age 80 and older (Houser, Fox-Grage, and Ujvari 2018).
Points of engagement
- This message is meant for 50-year-old couples and individuals. By the time they reach age 80, there will be a dramatic decline in the number of people who can provide care. Clients will need to hire people from a smaller pool of paid caregivers. A later section will show that costs are high today and headed higher. Will they be able to afford it?
Elder Orphans. Healthcare providers have a term for older people who don’t have a readily available caregiver: elder orphans. One study suggested that more than one in five (23 percent) adults ages 65 and older could be elder orphans late in life (Carney et al. 2016). This estimate may seem high until viewed in the context of the author’s definition of “elder orphan”: individuals living alone with little or no support system, including no spouse or partner, and no children who live within 10 miles. The focus on 10 miles reflects the reality of caregiving. When help is needed, it’s often needed now, not when a relative or friend has time to travel to the care recipient’s home.
Points of engagement
- No one wants to be a burden on their family as they age. The disturbing reality is that some people won’t need to worry. They will be alone.
Impact of Changing Family Structures. One big unknown is whether changing family structures—particularly higher rates of divorce, remarriage, and cohabitation—will affect the projected number of available caregivers. Specifically, how will the caregivers of tomorrow view their obligation to help older relatives whom they may not perceive as kin, especially when informal and steprelationships were acquired later in life?
On the negative side, divorce and remarriage are associated with less contact and support among stepfamilies compared to families with a single marriage. Divorced fathers and grandfathers are especially vulnerable because they have less contact with their own children and generally receive less family care. On the positive side, families of the future will have more potential caregivers that could include current and former spouses and partners, children, stepchildren, half-siblings, grandchildren, and stepgrandchildren. However, one study reported that having larger families with more stepparents and stepchildren did not compensate for the lower levels of support that usually occur in these situations (Agree 2018).
It will be decades before we know how eldercare dynamics will be affected by today’s family structures. The hope is that stepfamilies will fully assume the role of caregivers. If not, many caregiving responsibilities will pass from stepfamilies to paid caregivers for people who can afford this expense and to government entitlement programs for those who can’t.
Points of engagement
- Divorce, remarriage, and cohabitation come with unique caregiver challenges because extended families may not see others as kin. Divorced fathers and grandfathers are especially vulnerable. Clients need to plan accordingly.
Club Sandwich Caregivers. Most people have heard of the “sandwich generation,” which refers to caregiving that spans three generations—typically, young- and middle-aged adults who are “sandwiched” between caring for their children and parents. Approximately 28 percent of people who care for older adults are in this group (Weber-Raley 2019). The “club sandwich generation” takes this idea one step further; because many people are living longer, caregivers and care recipients could include four generations. For example, a young couple might care for their children and a grandparent, and retired grandparents might care for grandchildren and a mother in her 90s.
Points of engagement
- “Club sandwich caregivers” will immediately engage clients because most people haven’t heard this term. The example of a retired adult child caring for both a 90-year-old parent and a grandchild will jump-start any LTC conversation.
Costs Incurred by Care Recipients
Medicare Does Not Pay for LTC
How many times does this need to be said? Half (50 percent) of retirees and 33 percent of pre-retirees still believe that Medicare will pay for LTC (Greenwald 2018); it won’t! Much of the confusion lies in the distinction between acute care, post-acute care, and LTC. Medicare pays for acute care (hospitalizations, for example) and for post-acute care after hospital discharge, which might include limited periods (e.g., up to 100 days) in a skilled nursing facility or at home. However, if non-skilled personal care is needed, such as help with the activities of daily living, the rules are clear: Medicare and most health insurance plans, including Medigap policies, don’t pay for this type of care (Medicare and You 2021; Colello 2018). So, who does pay for LTC?
Medicaid is responsible for 57 percent of national spending for LTC (Figure 9). Most people do not have Medicaid unless their income and assets are low enough to qualify for this entitlement program. Out-of-pocket spending accounts for 23 percent of LTC costs, followed by 16 percent from “Other” payers, which includes some forms of private health insurance and health programs for veterans. Only 4 percent of LTC costs are paid by private long-term care insurance (Hado and Komisar 2019).

Costs Are High and Headed Higher
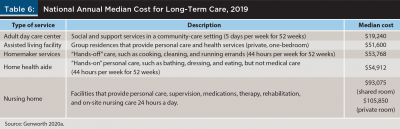
Table 6 shows Genworth survey data for LTC costs in the U.S. (Genworth 2020a). While many clients focus on expenses for a nursing home, care is expensive wherever it’s provided. For example, the cost of homemaker services and home health aides averaged more than $50,000 per year. Note that these costs were national averages. Prices varied a great deal across the United States; for example, the annual cost of a private room in a nursing home ranged from a high of $362,628 in Alaska (which was far more expensive than any other state) to a low of $67,525 in Oklahoma.
As high as these costs are today, LTC could be significantly more expensive for middle-aged clients who will want home care decades in the future. It’s another supply and demand problem.
Then there’s an increased demand for care since America is aging quickly. The U.S. Bureau of Labor Statistics estimated that demand for home health aides and personal care aides will grow 36 percent from 2018 to 2028, which is much faster than the average (5 percent) for all other occupations (U.S. Bureau of Labor Statistics 2020).
There’s a decreased supply of caregivers. Shortages of unpaid (family) caregivers (Edwards et al. 2020) and paid caregivers (Johnson and Wang 2019) are highly likely.
We’re already seeing the effects of these supply and demand trends, which are pushing up wages and other prices. Last year, national average costs of homemaker services and home health aides increased 4 percent, which exceeded the rate of general inflation (Genworth 2020b).
Points of engagement
- Lead with a reminder that Medicare does not pay for LTC, segue to a list of payers (Figure 9), and end with a discussion of costs (Table 6). As a call to action (e.g., create a detailed financial plan, save more, or consider a financial product that pays for LTC), restate the statistic that only 4 percent of LTC costs are paid by private long-term care insurance, compared to 23 percent paid out of pocket.

Costs Incurred by Caregivers
Direct Financial Costs
Caregivers often upend their lives to care for loved ones. One of the biggest challenges is financial.
Points of engagement
- Remind clients that most LTC is provided by adult children, not by spouses. An effective LTC plan ensures that clients have enough money (cash, investments, or a financial product that pays for LTC) so their children don’t face financial ruin if they need to provide care.
- Suggest that “A retirement nest egg isn’t just for you. It’s family money, and some of it may be needed to help your parents.” This leads to a broader discussion about whether clients are saving enough for both their retirement and for their parents’ care.
Work-Related Costs
Whiting et al. (2020) also found that work performance suffered during caregiving, especially for people who provided care for many hours per week or for long durations. Sixty-one percent of caregivers experienced one or more workplace challenges (Figure 11). The most reported impact (53 percent) was going to work late, leaving early, or taking time off.
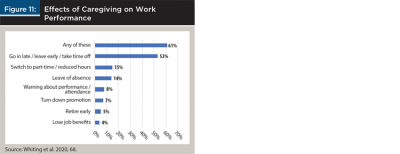
Some of the work impacts in Figure 11 can have far-reaching consequences for retirement security because they decrease employees’ 401(k) contributions and the employers’ matching contributions, lower pensions, and reduce Social Security benefits (Jeszeck 2019). Caregivers who temporarily leave the workforce may also have difficulty finding another job with comparable benefits, which means they may never recoup lost wages and benefits. These work-related events typically have a greater impact on women because they are the main caregivers, they generally have lower lifetime earnings and a longer life expectancy than men, and they are at greater risk of outliving their money.
Points of engagement
- Family caregivers can provide care, or they continue their current work schedules, but in most cases, they can’t do both.
- When they choose to provide care (for many, a choice isn’t possible), they disrupt their careers, work less or stop working altogether, reduce short-term savings, save less for college, stop contributing to 401(k) and other retirement accounts, reduce credits for pension and Social Security benefits, and put retirement plans on hold. Women are at higher risk.
Opportunity Costs
Opportunity cost is an economics term that refers to the cost of choosing one alternative over another. For caregivers, the opportunity cost is wages that are lost when time spent at work is replaced by time used for caregiving.
Mudrazija (2019) calculated the work-related economic cost of providing unpaid family care to relatives who were ages 65 and older. The cost in 2013 was $67 billion based on foregone earnings. By 2050, the total economic cost was projected to double to between $132 billion and $147 billion. Average opportunity costs per caregiver were expected to increase by 8 to 20 percent during this time. The dramatic increase in opportunity costs was attributed to two factors. First, there will be more older people who need care. Second, more caregivers will have a higher salary in the future because they will be better educated, which means they will forgo higher wages when they reduce their hours or stop work to provide care. The latter factor is illustrated in Figure 12, which shows the percent of opportunity costs of caregiving by educational attainment in 2013 and 2050 based on two scenarios. Half of caregivers in 2013 have a bachelor’s degree (with generally higher salaries compared to jobs without a degree), compared to 60 and 66 percent of caregivers in 2050.

Points of engagement
- Consider this approach to convey the opportunity costs of caregiving. “You spent much of your life in school and in building a career. If your parents need care and they can’t afford it, would you quit your job or work fewer hours so you could care for them? If so, this might be a huge cost to you and your family. Would you like to discuss ways (e.g., savings, investments, financial products) to pay for their care while you continue to work?”
Physical and Emotional Costs
The challenges faced by caregivers include far more than financial concerns. There are physical and emotional costs as well (Titus et al. 2018). These could be summarized in one word: “less.” Caregivers report having less time for themselves, for socializing with friends and family, for vacation, sleep and exercise, and for routine medical care (Figure 13). Given the frequency and duration of assistance that many caregivers provide, it’s no wonder they often feel physically and emotionally exhausted.

Points of engagement
- Here’s an idea for how prior life experience can help convey the tremendous physical and emotional challenges of caregiving. “Remember how busy you were when you were raising your children? They came first and there was no time for yourself. It could be like that again if you need to care for your parents, only you’d be a lot older. Here are some financial ideas that could help.”
Conclusion
Most people need LTC at older ages, including many people who have taken excellent care of their health. Most of the care is provided at home, with a care duration that is highly variable but potentially four years or longer.
Most care is provided by adult children, not by spouses or partners. This care can be frequent and long, the adult children who provide the care are often late-middle-aged or retired, and the pool of potential caregivers is shrinking. The latter issue suggests that middle-aged clients may need to hire paid caregivers in the future because free family care will be less common.
Costs are a concern. Care recipients will pay more for LTC in the future because increasing demand for care will occur at the same time as decreasing supply of caregivers. For caregivers, expenses can be measured as direct, work-related, opportunity, and physical and emotional costs. Some caregivers will face financial ruin or major disruption of their lives because there is no money to pay for care.
Remind clients that the “Goldilocks” years of retirement won’t last forever. There will come a day when most people need care. Financial professionals have the tools to address the financial challenges.
References
Agree, Emily M. 2018. “Demography of Aging and the Family.” In Future Directions for the Demography of Aging: Proceedings of a Workshop, edited by Mark D. Hayward and Malay K. Majmundar, June 26, 2018: 159–186. Washington, D.C.: National Academies of Sciences, Engineering, and Medicine. https://doi.org/10.17226/25064.
Carney, Maria T., Janice Fujiwara, Brian E. Emmert Jr., Tara A. Liberman, and Barbara Paris. 2016. “Elder Orphans Hiding in Plain Sight: A Growing Vulnerable Population.” Current Gerontology and Geriatrics Research, October 23, 2016: 1–11. http://dx.doi.org/10.1155/2016/4723250.
Colello, Kirsten J. “Who Pays for Long-Term Services and Supports?” IN FOCUS Congressional Research Service, August 22, 2018: 1–2. https://fas.org/sgp/crs/misc/IF10343.pdf.
Drabek, John, and William Marton. 2015 “Measuring the Need for Long-Term Services and Supports.” U.S. Department of Health and Human Services. Office of the Assistant Secretary for Planning and Evaluation (ASPE), Research Brief, July 2015: 1–11. https://aspe.hhs.gov/system/files/pdf/110376/MeasLTSSrb.pdf.
Edwards, Valeria J., Erin D. Bouldin, Christopher A. Taylor, Benjamin S. Olivari, and Lisa C. McGuire. 2020. “Characteristics and Health Status of Informal Unpaid Caregivers – 44 States, District of Columbia, and Puerto Rico, 2015–2017.” MMWR Morb Mortal Wkly Rep, 69 (7): 183–188. http://dx.doi.org/10.15585/mmwr.mm6907a2.
Favreault, Melissa, and Judith Dey. 2015 (Revised February 2016). “Long-Term Services and Supports for Older Americans: Risks and Financing Research Brief.” U.S. Department of Health and Human Services, Office of the Assistant Secretary for Planning and Evaluation (ASPE), Research Brief, July 1, 2015, https://aspe.hhs.gov/basic-report/long-term-services-and-supports-older-americans-risks-and-financing-research-brief.
Flinn, Brendan. 2020. “Nursing Home Closures and Trends: June 2015 - June 2019.” Leading Edge, February 2020: 1–19. https://leadingage.org/sites/default/files/Nursing%20Home%20Closures%20and%20Trends%202020.pdf.
Freedman, Vicki A., and Brenda C. Spillman. 2014. “Disability and Care Needs Among Older Americans.” The Milbank Quarterly, 92 (3): 509–41. https://doi.org/10.1111/1468-0009.12076.
Genworth Financial, Inc. 2020a. “Genworth Cost of Care Survey. Median Cost Data Tables.” December 2, 2020. https://www.genworth.com/aging-and-you/finances/cost-of-care/cost-of-care-trends-and-insights.html.
Genworth Financial, Inc. 2020b. “Genworth 17th Annual Cost of Care Survey: COVID-19 Exacerbates Already Rising Long Term Care Costs; Care Providers Foresee Additional Rate Hikes in 2021.” December 2, 2020. https://newsroom.genworth.com/2020-12-02-Genworth-17th-Annual-Cost-of-Care-Survey-COVID-19-Exacerbates-Already-Rising-Long-Term-Care-Costs-Care-Providers-Foresee-Additional-Rate-Hikes-in-2021.
Greenwald & Associates. 2018. “2017 Risks and Process of Retirement Survey.” Society of Actuaries. January 2018. https://www.soa.org/globalassets/assets/files/resources/research-report/2018/risk-process-retirement.pdf.
Hado, Edem, and Harriet Komisar. 2019. “Long-Term Services and Supports.” AARP Public Policy Institute, August 2019: 1–4. https://doi.org/10.26419/ppi.00079.001.
Houser, Ari, Wendy Fox-Grage, and Kathleen Ujvari. “Across the States: Profiles of Long-Term Services and Supports.” AARP Public Policy Institute, August 2018: 1–84. https://www.aarp.org/content/dam/aarp/ppi/2018/08/across-the-states-profiles-of-long-term-services-and-supports-full-report.pdf
Jeszeck, Charles A. 2019. “Retirement Security: Some Parental and Spousal Caregivers Face Financial Risks.” GAO-19-382, Special Committee on Aging, U.S. Senate. May 1, 2019: 1–71. https://www.gao.gov/products/GAO-19-382.
Johnson, Richard W. 2019. “What Is the Lifetime Risk of Needing and Receiving Long-term Services and Supports? U.S. Department of Health and Human Services. Office of the Assistant Secretary for Planning and Evaluation (ASPE), Research Brief, April 2019: 1–26. https://aspe.hhs.gov/basic-report/what-lifetime-risk-needing-and-receiving-long-term-services-and-supports.
Johnson, Richard W., and Claire Xiaozhi Wang. 2019. “The Financial Burden of Paid Home Care on Older Adults: Oldest and Sickest Are Least Likely to Have Enough Income.” Health Affairs 38 (6): 994–1002. https://doi.org/10.1377/hlthaff.2019.00025.
Kemper, Peter, Harriet L. Komisar, and Lisa Alecxih. 2005. “Long-Term Care over an Uncertain Future: What Can Current Retirees Expect?” Inquiry 42: (Winter 2005/2006): 335–350. https://doi.org/10.5034/inquiryjrnl_42.4.335.
Medicare 2020. The reference was found at a link that explained “What is Medicare and What Does It Cover?” Accessed July 11, 2020. https://longtermcare.acl.gov/.
“Medicare and You 2021.” Centers for Medicare and Medicaid Services: 1–12. https://www.medicare.gov/Pubs/pdf/10050-Medicare-and-You.pdf.
Medicare Current Beneficiary Survey. 2016. “Demographic and Socioeconomic Characteristics of Noninstitutionalized Male and Female Medicare Beneficiaries, by Living Arrangement and Age, 2013,” Table 1.4b, Table 1.4c. November 30, 2016. Centers for Medicare and Medicaid Services. https://www.cms.gov/Research-Statistics-Data-and-Systems/Research/MCBS/Data-Tables-Items/2016Chartbook.
Mudrazija, Stipica. 2019. “Work-Related Opportunity Costs of Providing Unpaid Family Care in 2013 and 2050.” Health Affairs 38 (6): 1003–1010. https://doi.org/10.1377/hlthaff.2019.00008.
Reinhard, Susan C., Heather M. Young, Carol Levine, Kathleen Kelly, Rita B. Choula, and Jean Accius, 2019. “Home Alone Revisited: Family Caregivers Providing Complex Care.” AARP Public Policy Institute. (April): 1–63. https://doi.org/10.26419/ppi.00086.001.
Scommegna, Paola. 2016. “Family Caregiving.” Population Reference Bureau Today’s Research on Aging, 33 (February): 1–9. https://www.prb.org/wp-content/uploads/2016/02/TodaysResearchAging33.pdf.
Scommegna, Paola, Mark Mather, and Lillian Kilduff. 2018. “Eight Demographic Trends Transforming America’s Older Population,” Population Reference Bureau (February): 1–16. https://www.prb.org/eight-demographic-trends-transforming-americas-older-population/.
Span, Paula 2018. “In the Nursing Home, Empty Beds and Quiet Halls.” New York Times, September 28, 2018. https://www.nytimes.com/2018/09/28/health/nursing-homes-occupancy.html.
Stall, Nathan M., Angus Campbell, Madhuri Reddy, and Paula A. Rochon. 2019. “Words Matter: The Language of Family Caregiving,” Journal of the American Geriatrics Society, 67 (10): 2008–2010. https://doi.org/10.1111/jgs.15988.
Thach, Nga T., and Joshua M. Wiener. 2018. “An Overview of Long-Term Services and Supports and Medicaid: Final Report.” U.S. Department of Health and Human Services. Office of the Assistant Secretary for Planning and Evaluation (ASPE), (May): 1–34. https://aspe.hhs.gov/basic-report/overview-long-term-services-and-supports-and-medicaid-final-report.
Titus, Jennifer, Dan Malato, Jennifer Benz, Liz Kantor, William Bonnell, Tomas Okal, Caroline Smith, Trevor Tompson, Emily Swanson, and Hannah Fingerhut. 2018. “Long-Term Caregiving: The True Costs of Caring for Aging Adults.” The Associated Press AP-NORC Center for Public Affairs Research, (October): 1–20. https://www.longtermcarepoll.org/wp-content/uploads/2018/10/Long-Term-Caregiving-2018-Report.pdf.
Weber-Raley, Lisa. 2019. ”Burning the Candle at Both Ends: Sandwich Generation Caregiving in the U.S.” National Alliance for Caregiving and Caring Across Generations, November 26: 1–32. https://www.caregiving.org/research/sandwich-caregiver/.
Whiting, Grace C., Susan Reinhard, Patrice A. Heinz, Lynn Friss Feinberg, Gabriela Prudencio, Laura Skufca, Michael R. Wittke, Robert Stephen, and Rita Choula. 2020. “Caregiving in the U.S. 2020” The National Alliance for Caregiving (NAC) and AARP, May: 1–107. May 20, 2020. https://www.caregiving.org/caregiving-in-the-us-2020/.
U.S. Bureau of Labor Statistics 2020. Occupational Outlook Handbook. Home Health Aides and Personal Care Aides Job Outlook. https://www.bls.gov/ooh/healthcare/home-health-aides-and-personal-care-aides.htm#tab-6.
Endnotes
- Some studies on long-term care and caregiving report data for “spouses” who are caregivers or care recipients. Partners in cohabitation relationships also provide a great deal of care for each other.
- This report focused on Americans who provided eldercare, which was defined as “assisting or caring for an adult who needed help because of a condition related to aging.”
- Jeszeck uses this definition: “Spousal caregivers were those who provided care to a spouse or cohabiting domestic partner.”