Journal of Financial Planning: September 2013
Executive Summary
- Holding emergency fund assets in cash may not be utility maximizing for many households that invest with financial planners. Drawing on utility theory, this paper analyzes an all cash emergency fund strategy and compares it to funds held with varying levels of equities.
- This study relies on a simulation-based approach with stochastic real asset class returns and income/expense shocks.
- The results demonstrate that, when compared with varying levels of equities, there is a monotonic increase in wealth at retirement as the total portfolio becomes more aggressive.
- Holding a separate cash emergency fund increases the standard deviation of total dollar-weighted returns, as compared to the total portfolio approach.
- Results also suggest that including equities as part of the emergency fund strategy reduces instances of funding inadequacy.
- This strategy is not in line with traditional views of investing emergency fund assets. Given that wealth is fungible, financial planning professionals may want to consider the increased efficiency (higher return/lower risk) of a total portfolio approach to managing both retirement and precautionary savings goals.
Janine Scott, Ph.D., is a faculty member in the Department of Accounting, Finance, and Management Information Systems at Prairie View A&M University.
Duncan Williams, CFP®, is an instructor of financial planning at William Paterson University and is ABD from Texas Tech University. He came to academia with 10 years’ experience as a financial adviser.
John Gilliam, Ph.D., CFP®, CLU®, is an associate professor in the Department of Personal Financial Planning at Texas Tech University. He serves on the national board of the Society of Financial Service Professionals.
Jacob P. Sybrowsky, Ph.D., CRC®, RFC, serves as the Personal Financial Planning Program Director for the Woodbury School of Business at Utah Valley University. He also works as an associate planner for Evensky & Katz Wealth Management in Coral Gables, Florida.
Traditionally, financial planning practitioners have recommended holding three to six months of expenses in cash for emergencies (Bajtelsmit and Rastelli 2008; Cain and Benefield 2007; Bi and Montalto 2004; Greninger et al. 1996). However, critics of this strategy argue that holding such a large amount in a risk-free asset class may impose an exorbitant opportunity cost on younger households that are just beginning to build wealth in the life cycle (Amromin 2008; Hatcher 2000).
This paper seeks to provide an economic framework through which this tradeoff can be optimized, possibly enhancing utility or welfare for investors. Results from this study demonstrate that some clients may be unnecessarily reducing wealth at retirement due to maintaining an all cash emergency fund.
A household attempts to maximize its utility by smoothing consumption, both across time and across uncertain future outcomes (Modigliani and Brumberg 1954). The two primary motives for saving during working years include funding future consumption and guarding against income/expense shocks (Yuh and Sherman 2010). However, assets held for these two savings goals may be invested differently (Hatcher 2000).
A client’s level of risk aversion is vital in determining the optimal allocation of risky assets for future consumption, for example, in determining an adequate withdrawal rate in retirement (Ameriks, Veres, and Warshawsky 2001). As such, financial risk aversion should be taken into account when determining the optimal allocation of emergency fund assets. This helps to reduce missed opportunities of enhancing wealth for clients who have a sufficient risk capacity and at least a moderate level of risk tolerance.
However, in practice, funds allocated for guarding against income/expense shocks are typically invested in risk-free assets (Evensky, Horan, and Robinson 2011) regardless of risk aversion, because there is no volatility associated with these assets. One argument is that this is a form of mental accounting, which is a decision-making shortcut that is neither optimal nor irrational, as total wealth should be treated as fungible (Shefrin and Thaler 1988). If one investment strategy is used to determine future consumption, a similar strategy may be used to bar against unexpected income shocks.
There is a cost to income smoothing over the life cycle. Morduch (1995) demonstrated that households can accomplish income smoothing through less risky occupations and participating in various economic opportunities. Such opportunities include diversified investment strategies and owning proper insurance products (Ibbotson et al. 2007).
However, to mitigate risks, households tend to be drawn to safer assets and may shy away from economic opportunities they perceive to be too risky. For example, Campbell (2006) highlighted common financial missteps among individuals, also citing that households forego risky gambles in exchange for lower or safe returns. He showed that many households hold more bonds relative to stocks, and those in the lower wealth quartiles hold safe assets (primarily liquid assets). The forgone increase in wealth can be substantial over time and may constrain maximum utility (Hatcher 2000). Thus, over the life cycle a household may suffer wealth costs, albeit inadvertently, due to the goal of minimizing risk.
Background on Emergency Funds
To determine how much should be set aside for emergencies, nearly all financial planning experts use liquid assets divided by monthly expenses (Greninger et al. 1996). Greninger et al. conducted a study that assessed standard financial ratios as a way to standardize the variety of ratios being used by financial advisers and educators. They found that educators and financial advisers typically recommend holding, at minimum, two to three months of expenses in liquid assets. After the development of this research, although not empirically tested, the popular recommendation of holding three to six months of expenses in liquid assets became widespread.
Johnson and Widdows (1985) modeled three measures of emergency funds including quick, intermediate, and comprehensive assets. Quick assets include highly liquid assets held in savings, checking, and money market accounts. Intermediate assets include quick assets in addition to other types of saving certificates. Comprehensive assets include intermediate assets in addition to stocks and bonds. These measures have been widely used in the literature since the mid-1980s.
Why Do Households Need an Emergency Fund?
As mentioned previously, households primarily save with the intention to protect future income streams and to also protect against unexpected income shocks. Income shocks include unexpected health expenses, unemployment, reductions in wages, and disability (Campbell 2006; Horneff, Maurer, Mitchell, and Stamos 2009; Huston and Chang 1997). Rising unemployment necessitates having an emergency fund in place (Bureau of Labor Statistics 2011). Uninsurable shocks may not always prompt a preference for highly liquid assets, (preference only increases marginally) as one may assume (Hatcher 2000).
Decisions to save and invest also have to do with asset location, not just asset allocation. For example, some vehicles are more tax efficient than others and thus position the household to be better off in the future, perhaps when tax rates are higher or lower. A vast amount of literature on asset allocation and location decisions exists (Campbell 2006; Dammon, Spatt, and Zhang 2004). Amromin (2008) found that those with a greater income shock risk will elect to have less tax efficiency to have access to more liquidity. Mitigating total risk involves considering both liquid and illiquid holdings and the placement of those assets. Simply having an emergency fund and retirement savings may not be adequate. One must consider the consequences of asset location for all goals.
Hatcher (2000) used probability analyses and assumptions about liquidity constraints and costs to show that emergencies would have to occur frequently to justify holding an emergency fund. He showed that it may not be optimal for households to have an all cash emergency fund, even considering increased risk aversion and high borrowing costs, in addition to a higher expectancy of a financial emergency. For example, Hatcher noted that “in situations where the liquidity spread was over 8 percent (not too unreasonable if funds are invested in the stock market) and the borrowing rate is less than 15 percent, more than one emergency would need to occur each year (i.e., P>1) for the fund to be an optimal household financial decision” (p. 79).
Hatcher also demonstrated the tradeoff in having an emergency fund. Households forgo more risky investments that would provide a higher return than the return generated by a less risky vehicle, such as that used for an emergency fund.
A noted problem with relying on borrowing in times of financial distress is that even previously established and collateralized credit lines may be called in times of broad economic uncertainty. This paper aims to build on Hatcher’s work by incorporating household economic theory and risk tolerance in the use of emergency funds.
Theory
Utility theory is especially prevalent when making decisions under uncertainty. According to utility theory, individuals gain greater utility from higher levels of wealth at a decreasing rate. Relative risk aversion, which measures the strength of preference for risk, reflects wealth elasticity. To derive maximum utility, investors seek to maximize returns (leading to higher expected wealth), while minimizing volatility (leading to lower dispersions of expected wealth).
The concept of relative risk aversion (RRA), coined by Pratt (1964) and Arrow (1965), provides a framework through which financial planners can understand the tradeoff between constant consumption and a more variable consumption pattern, or the certainty equivalent. Based on this concept, as RRA increases, the certainty equivalent needed decreases (Williams and Finke 2011). Thus, utility theory dictates allocation between risky and risk-free assets, with utility being a function of RRA and the expected consumption path.
These borrowing and saving decisions are used to combat unexpected income shocks and to plan for periods in which income may be low. For example, using a mix of asset classes for investment purposes is a common recommendation that appears throughout the retirement literature (Ameriks, Veres, and Warshawsky 2001; Bengen 1994; Cooley, Hubbard, and Walz 1999, 2001), although this recommendation is generally unsupported for emergency funds. The primary focus of the aforementioned papers holds for retirement decisions, but a similar line of thought can be applied to emergency funds during the accumulation phase, if wealth is truly fungible.
Although wealth is indeed fungible (even withstanding consequences of unqualified withdrawals from tax-advantaged accounts), individuals employ heuristic biases that lessen the probability and successful implementation of wealth-maximizing decisions.
Behavioral theory can be used to show that investors consistently rely on mental accounting, focusing on buckets of wealth instead of on total wealth (Shefrin and Thaler 1988). Because wealth is fungible, borrowing and saving decisions should be consistent across all accounts, including emergency funds. Allocation of an emergency fund should be similar to the allocation of a retirement account, in that the emergency fund may also include assets besides cash based on an investor’s relative risk aversion level.
In viewing a household’s total portfolio, beyond risk-free assets, human capital is also an important component of the total portfolio (Chen et al. 2006). With a more uncertain income stream, human capital is viewed increasingly as a risky asset. For example, a professor has a less volatile income path (his/her occupation is not highly correlated with the market) and might have more risky assets than a stockbroker. It thus follows that individuals with a volatile income stream should invest more conservatively to adequately reflect total portfolio risk (Chen et al. 2006).
Furthermore, Grable and McGill (2009) considered human capital, which is an individual’s skills and abilities used to obtain financial capital, and aligned occupational betas and investment risk to capture better diversification strategies. As individuals progress through the life cycle, human capital decreases and people rely less on income and more on wealth to buffer against income or consumption shocks. Their argument supports the case for a greater allocation toward risk-free assets as an individual ages.
However, Viceira (2001) suggested that workers who have more flexibility in the amount of time spent working (frequency and length) should be inclined toward risky assets more so than an individual with less flexibility. As these studies illustrate, human capital plays an important role in the allocation between risky and risk-free assets.
Methodology
This study relies on a simulation-based approach with stochastic real asset class returns and income/expense shocks. To simulate portfolio performance, bootstrapping was used with historical stock and bond returns, a method commonly used in the retirement literature. Data from Shiller (2013) was used to measure stock (S&P 500) returns, while Ibbotson Associates (2011) data, obtained from Morningstar, were used for the bond returns (long-term Treasuries). Unemployment data was also obtained from the U.S. Bureau of Labor statistics (2011). The time period for the return measures was 1926 through 2011, whereas unemployment data ranged from 1948 through 2011.
A hypothetical client situation was modeled. Although the goal for the hypothetical client was to accumulate adequate retirement wealth while maintaining enough liquidity for income shocks, this study focused on simulating returns and shocks only during the work life, because the mental hurdle of tapping into long-term savings for both lifestyle and unexpected needs is lessened after retirement.
Retirement adequacy was modeled by simply calculating the required account balance at retirement to support lifestyle (pre-retirement income less savings and Social Security) for a 30-year period, given the clients’ level of risk aversion.
Fund adequacy to handle shocks was determined by whether or not the client had enough liquid funds to pay for lifestyle expenses (income minus savings) for the duration of the shock. For simplicity purposes, only after-tax savings and investments were modeled.
For this study, the hypothetical client was assumed to follow a basic life cycle model.
Assumptions included:
- Work and retirement lifespans were held constant at 40 and 30 years, respectively
- Real income was held constant throughout the work life, notwithstanding the simulated periods of income shock
- A single savings rate was held constant during the working years to accommodate retirement and income shocks
- To focus on savings adequacy, the following borrowing constraint was imposed: for shocks, clients could only withdraw from savings and after-tax investments
- The Social Security wage replacement rate was assumed to be 40 percent (Springstead and Biggs 2008)
The optimal allocations for varying multiples of assets to income were then examined. Moreover, the analysis included comparing mean lifetime shocks/return sequences to “bad luck” sequences of shocks/returns to compare the effects of a less stable income path and bad timing of returns.
The analysis also incorporated the traditional strategy by comparing it with a holistic allocation for all savings. This includes saving two months of expenses per year while working during a 40-year period with a constant real earning and savings rate. The asset returns and income used reflect inflation-adjusted dollars. When an emergency occurred in the model, assets were assumed to be depleted. The paper reports a comparison of probabilities of meeting the emergency need. Also, aggregate amounts accumulated at retirement are presented.
The traditional six-month cash reserve strategy entails:
- Saving in the cash account until the six-month mark is obtained
- All savings thereafter are accumulated in a long-term investment account
- After a shock, the client replenishes the cash account to the target level before saving again in an investment account
- The client only pull funds from the investment account in an emergency if the cash account is exhausted
The single account strategy for both saving motives included testing the allocation of funds according to accumulation levels. The results of the study are demonstrated below.
Results
The age range used was 25 to 65. Table 1 shows the opportunity cost of wealth expressed as a percentage, at retirement, as a result of maintaining a cash reserve. Bear in mind that the analysis does not consider taxes or expenses. Portfolio returns were calculated using the stated percentage of equities and the remainder in intermediate-term Treasuries. For example, at 0 percent equities, 100 percent was allocated to Treasuries.
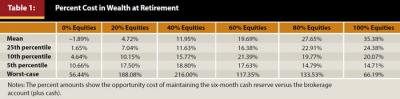
As illustrated, there is an opportunity cost of underperformance outside of equity investment. The first row in Table 1 indicates the mean cost of wealth for the hypothetical client at retirement. Note that the cost in wealth is higher up to 60 percent equities at the 5th and 10th percentiles (relatively bad luck combinations of income shocks and asset returns during the work life). The worst-case scenario assumes wealth shocks (for example, unemployment periods or a bear market).
At 0 percent equities, or 100 percent Treasuries, and a mean wealth level, the client would actually be better off in the all cash reserve. But at the 60 percent equity portfolio allocation, due to the cost of maintaining a cash account, the investor would have 20 percent less wealth at retirement. At the 25th percentile of wealth, if the client maintains six months in cash instead of having 80 percent allocated to equities (and 20 percent to Treasuries), there would be a nearly 23 percent reduction in wealth or a commensurate lower standard of living at retirement.
As the equity portion of the portfolio increases, the opportunity cost associated with holding cash increases monotonically from the 25th percentile up. Even in the worst-case scenario, the client maximizes retirement wealth at 40 percent equity. Clearly, the reduction in wealth decreases significantly with portfolio risk. Results show that those at the 5th percentile of wealth would realize a 10.66 percent to 18.80 percent reduction in wealth, depending on the equity/Treasury mix of the portfolio, due to following an all cash emergency fund strategy. The loss of such a resource at retirement would have a significant impact on the future standard of living.
Maintaining the six-month cash reserve strategy translates into a proportionate lower standard of living during retirement for those with less wealth. The findings demonstrate that as a client accumulates additional funds, he or she may be better served with a more aggressive portfolio after considering the opportunity cost of holding extensive cash reserves over time.
Table 2 shows the dollar weighted, annualized returns over the 40 year accumulation period. These are the returns on assets and standard deviations that investors experience. The dollar weighted returns were used, because money is saved when working and taken out when an emergency occurs (taking into account the timing of client savings and withdrawals). Funds in the one account are invested in a financial portfolio of the percentage of equities listed, and the remainder is invested in bonds. The cash reserve strategy entails having X months of cash and then only investing long-term investments in stocks and bonds and treating them separately.
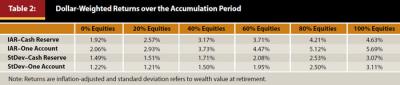
It is not surprising that the one account strategy has a higher return because cash is not weighing down returns. The surprising finding is that this strategy generally results in a lower standard deviation. After an emergency use, the investor has to refill the cash account with no savings going into the investment account. As a result, dollar weighted returns are less consistent because savings are more variable.
Note that the cash reserve strategy underperforms at every one of the following allocations: 0 percent, 20 percent, 40 percent, 60 percent, 80 percent, and 100 percent equity, and that the gap increases as the equity allocation increases. The standard deviation associated with the cash reserve strategy is larger in every case except 100 percent equity, but even then it is not too dissimilar. Moreover, the standard deviation gap narrows as equity is increased, but the difference may not be statistically significant.
Emergency funding inadequacy by total accumulation is demonstrated in Table 3, which displays the amount of time, in percentage terms, that the combined cash and equity portfolio provides in the event of an emergency. Note that although the investor will have inadequate funds a small percentage of the time by maintaining a cash account, including equities as part of the emergency strategy reduces the funding inadequacy. For example, the reduction in inadequacy at four months saved, and 40 percent equities, was calculated as 1– (0.89/1.09), which is equal to an approximately 18 percent reduction. These findings are particularly interesting because at every accumulation amount tested, the cash reserve strategy left more emergency needs unmet.
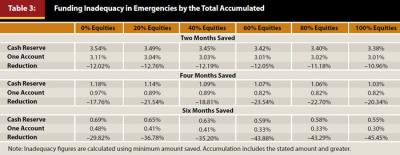
As the allocation to equities increases, coverage is enhanced and inadequacy of the emergency fund declines as saving increases. In practice, beyond the six months saved, clients can begin shifting their total portfolio into an allocation that is consistent with their long-term goals and risk tolerance to avoid the adverse opportunity cost of holding assets primarily in a cash account.
Even in a down market, a client can withdraw enough to cover emergencies, as long as the total amount saved is a large enough multiple of anticipated monthly expenses. Table 3 shows that younger clients should consider the impact of investing in a riskier portfolio beyond a cash only strategy early on in their working careers.
Implications
Emergency fund needs vary by stage in the life cycle, occupational income volatility, the level of disability insurance, and the number of earners in the household. Along with the total amount of after-tax savings, these same factors should be considered when recommending the optimal allocation of funds.
Financial planning practitioners will find understanding utility theory useful, as it incorporates a client’s degree of risk aversion and how this preference for risk leads to different decisions. Practitioners should reconsider the 100 percent allocation of cash in an emergency fund guideline. Even more, they should treat wealth as fungible and consider investing a portion of emergency fund assets in the market to improve efficiency and overall, long-term wealth. Future research can include the development of a normative model consistent with utility theory, in which all assets are invested according to the client’s level of risk aversion. The impact this strategy would have on both the accumulation and decumulation stages may be particularly interesting.
A majority of practitioners, and perhaps their clients, may perceive the strategies presented in this paper to be too risky. Especially among risk-averse clients, this may require too much faith, given the volatility of an aggressive portfolio. Also, the authors are cognizant of behavioral benefits to holding more cash for emergencies as it applies to careers with lower levels of income volatility (Campbell 2006).
The brokerage account strategy may be more easily applied to clients who already have a large accumulation of liquid investments. For these clients, additional return on emergency fund assets can generate income to fund other life goals rather than having a large portion of funds sitting in cash.
Limitations
Several limitations are associated with this study. It is important to note that the analyses presented in the paper do not apply to all households, but rather to more affluent clients of financial planners. Additionally, some of the model assumptions were imposed for simplicity, but financial planners can understand the impact that including more variables might have on planning outcomes and model complexity.
To the extent that only contributions are withdrawn, the analysis would change little if Roth IRA investments for emergency needs were considered. The use of pre-tax contributions to traditional IRA and qualified plans to meet income shocks would follow the same logic as after-tax savings, but taxes and penalties would have to be considered. These accounts and Roth earnings would be the last assets to be withdrawn.
In addition, the ability to borrow may not disappear entirely in the case of an employment shock. Hatcher’s (2000) findings, citing that relatively high, short-term borrowing costs should not be much of a deterrent, holds even more for clients who are likely to have a large amount of liquid funds accumulated. Financial planners know the planning risk of relying on the availability of borrowed funds in an emergency, but once a shock ensues, a planner can assess the availability of borrowed resources and make the appropriate recommendation.
Conclusion
Emergencies may not happen as frequently as imagined, which means there may be an opportunity cost associated with holding too much cash. The results of this study demonstrate that the traditional recommendation of a cash only reserve emergency fund strategy is likely to reduce wealth over a lifetime. Furthermore, this strategy is less likely to meet emergency needs.
Clients should be educated on the tradeoffs between the psychological value of holding cash for emergencies and the opportunity to hold assets in a riskier portfolio, which may provide increased retirement funding while better serving the precautionary motive. For clients with a moderate risk tolerance, after accumulating three to six months of emergency funds, they can begin shifting their total portfolio into an allocation that is consistent with their long-term goals. This strategy provides greater retirement preparedness while preserving funds for emergencies.
Clients with a high risk tolerance could consider an aggressive strategy of minimizing cash reserves and maximizing account holdings in an effort to accumulate assets faster; thereby providing funds for emergencies, retirement, and future needs.
References
Ameriks, John, Robert Veres, and Mark J. Warshawsky. 2001. “Making Retirement Income Last A Lifetime.” Journal of Financial Planning 14 (12): 60–76.
Amromin, Gene. 2008. “Precautionary Savings Motives and Tax Efficiency of Household Portfolios: An Empirical Analysis.” In Tax Policy and the Economy, edited by James M. Poterba, 5-41. Chicago: University of Chicago Press.
Arrow, Kenneth J. 1965. Aspects of the Theory of Risk-Bearing. Helsinki: Yrjo Jahnsson Lectures.
Bajtelsmit, Vickie L., and Linda G. Rastelli. (2008). Personal Finance: Managing Your Money and Building Wealth. Hoboken, New Jersey: John Wiley and Sons.
Bengen, William P. 1994. “Determining Withdrawal Rates Using Historical Data.” Journal of Financial Planning 7 (4): 171–180.
Bi, Lan, and Catherine P. Montalto. 2004. “Emergency Funds and Alternative Forms of Saving.” Financial Services Review 13 (2): 93–109.
Bureau of Labor Statistics. 2011. “Labor Force Statistics including the National Unemployment Rate.” www.bls.gov/cps/data.htm.
Cain, Christopher L., and Justin D. Benefield. 2007. “Optimal Savings Liquidation for Income Replacement in the Presence of Income Uncertainty.” Financial Services Review 16 (4): 275–292.
Campbell, John Y. 2006. “Household Finance.” The Journal of Finance 61 (4): 1553–1604.
Chen, Peng, Roger G. Ibbotson, Moshe A. Milevsky, and Kevin X. Zhu. 2006. “Human Capital, Asset Allocation, and Life Insurance.” Financial Analysts Journal 62 (1): 97–109.
Cooley, Philip L., Carl M. Hubbard, and Daniel T. Walz. 1999. “Sustainable Withdrawal Rates from Your Retirement Portfolio.” Financial Consulting and Planning 10 (1): 39–47.
Cooley, Philip L., Carl M. Hubbard, and Daniel T. Walz. 2001. “Withdrawing Money from Your Retirement Portfolio Without Going Broke.” Journal of Retirement Planning 4: 35–41, 48.
Dammon, Robert M., Chester S. Spatt, and Harold H. Zhang. 2004. “Optimal Asset Location and Allocation with Taxable and Tax-Deferred Investing.” Journal of Finance 59 (3): 999–1037.
Evensky, Harold, Stephen M. Horan, and Thomas R. Robinson. 2011. The New Wealth Management: The Financial Advisor’s Guide to Managing and Investing Client Assets. Hoboken, New Jersey: John Wiley and Sons.
Grable, John E., and Samantha McGill. 2009. “Occupational Income Betas for Financial Advisers.” Journal of Financial Planning 22 (6): 50–61.
Greninger, Sue A., Vickie L. Hampton, Karrol A. Kitt, and Joseph A. Achacoso. 1996. “Ratios and Benchmarks for Measuring the Financial Well-Being of Families and Individuals.” Financial Services Review 5 (1): 57–70.
Hatcher, Charles B. 2000. “Should Households Establish Emergency Funds?” Financial Counseling and Planning 11 (2), 77–83.
Horneff, Wolfram J., Raimond H. Maurer, Olivia S. Mitchell, and Michael Z. Stamos. 2009. “Asset Allocation and Location over the Life Cycle with Investment-Linked Survival-Contingent Payouts.” Journal of Banking and Finance 33 (9): 1688–1699.
Huston, Sandra J., and Y. Regina Chang. 1997. “Adequate Emergency Fund Holdings and Household Type.” Financial Counseling and Planning 8 (1): 37–46.
Ibbotson, Roger G., Moshe A. Milevsky, Peng Chen, and Kevin X. Zhu. 2007. Lifetime Financial Advice: Human Capital, Asset Allocation, and Insurance. Charlottesville, Virginia: Research Foundation of CFA Institute.
Ibbotson Associates. 2011. Stocks, Bonds, Bills and Inflation: 2011 Yearbook. Chicago, Illinois: Morningstar.
Johnson, D. and Richard Widdows. 1985. “Emergency Fund Levels of Households.” In The Proceedings of the American Council on Consumer Interests 31st Annual Conference, edited by K. Schnittgrund, 235–241.
Modigliani, Franco, and Richard Brumberg. 1954. “Utility Analysis and the Consumption Function: an Interpretation of Cross-Section Data.” In Post-Keynesian Economics, edited by Kenneth K. Kurihara, 388-436. New Brunswick, New Jersey: Rutgers University Press.
Morduch, Jonathan. 1995. “Income Smoothing and Consumption Smoothing.” Journal of Economic Perspectives 9 (3): 103–114.
Pratt, John W. 1964. “Risk Aversion in the Small and in the Large.” Econometrica 32 (1/2): 122–136.
Shefrin, Hersh M., and Richard H. Thaler. 1988. “The Behavioral Life Cycle Hypothesis.” Economic Inquiry 26 (4): 609–643.
Shiller, Robert J. 2013. “Online Data Robert Shiller.” www.econ.yale.edu/~shiller/data/ie_data.xls.
Springstead, Glenn R., and Andrew G. Biggs. 2008. “Alternate Measures of Replacement Rates for Social Security Benefits and Retirement Income.” Social Security Bulletin 68 (2): 1–19.
Viceira, Luis M. 2001. “Optimal Portfolio Choice for Long Horizon Investors with Nontradable Labor Income.” Journal of Finance 56 (2): 433–470.
Williams, Duncan, and Michael Finke. 2011. “Determining Optimal Withdrawal Rates: An Economic Approach.” Retirement Management Journal 1 (2): 35–46.
Yuh, Yoonkyung, and Hanna D. Sherman. 2010. “Which Households Think They Save?” Journal of Consumer Affairs 44 (1): 70–9.
Citation
Scott, Janine, Duncan Williams, John Gilliam, and Jacob P. Sybrowsky. 2013. “Is an All Cash Emergency Fund Strategy Appropriate for All Investors?” Journal of Financial Planning 26 (9): 56–62.