Journal of Financial Planning: September 2013
Executive Summary
- This study investigates plan survival rates, or the percentage of simulated retirement plans, that continue to provide real adequate income at a given point in retirement for two common distribution strategies. Reverse dollar cost averaging (RDCA), which does not include cash reserves, is compared to a one-year cash flow reserve distribution strategy (CFR), which includes cash reserves equal to one year of income needs.
- Four unique distribution environments are tested: (1) no tax and no transaction costs; (2) transaction costs only; (3) taxes and transaction costs in a tax-deferred environment; and (4) taxes and transaction costs in a taxable environment. The first environment, while unrealistic, is included as a reference point to the remaining three.
- Results suggest that cash reserve distribution strategies improve the likelihood of realizing adequate real income when the reduction in the risk of having to sell investments at depressed prices, taxes, and transaction costs outweighs the opportunity cost of lower expected returns.
- Results indicate that plan survival rates of the CFR strategy are up to as much as 6 percentage points higher than the plan survival rates for the RDCA strategy at the 30-year mark in retirement. The survival advantage of the CFR strategy is complemented by potential behavioral advantages, such as the clients’ increased willingness to tolerate volatility associated with the investment portfolio (IP).
Shaun Pfeiffer, Ph.D., is an associate professor of finance and personal financial planning at the Edinboro University of Pennsylvania.
John Salter, Ph.D., CFP®, AIFA®, is an associate professor of personal financial planning at Texas Tech University and wealth manager at Evensky & Katz Wealth Management in Coral Gables, Florida, and Lubbock, Texas.
Harold Evensky, CFP®, AIF®, is a research professor of personal financial planning at Texas Tech University and president of Evensky & Katz Wealth Management in Coral Gables, Florida, and Lubbock, Texas.
A financial planner must consider the potential impact of returns, volatility, taxes, transaction costs, and client behavior to construct effective distribution strategies. Asset allocation has been noted as one of the most important factors when constructing an effective distribution strategy (Bengen 1994). Asset allocation, when stripped down to the basics, is defined as the percentage of wealth allocated to stocks, bonds, and cash.
A reduction in taxes and transaction costs, and mitigating the need to have to sell investments at depressed price levels, are the primary advantages to consider when determining the amount of retirement wealth that should be allocated to cash in a distribution strategy. Research has suggested that taxes and transaction costs can reduce the sustainable withdrawal rate (SWR) by more than 0.5 percent (Bengen 1997; Pye 2001). Said differently, a plan has a higher probability of providing a retiree with adequate and consistent real income throughout retirement when it incorporates a strategy that accounts for the detrimental impact of volatility, taxes, and transaction costs.
Appropriate use of cash reserves also has been reported to provide behavioral advantages, such as a client’s increased ability to accept portfolio volatility as they know where their daily spending money is coming from for the coming year. Evensky et al. (2011) reported that his firm has been implementing a cash flow reserve distribution (CFR) strategy since 1985 and found the behavioral framing was a powerful tool in managing clients’ fears during October 1987’s Black Monday, the tech crash, and the Great Recession. The behavioral benefits associated with a CFR strategy are simple in nature. Clients focus on the volatility of the portfolio, where in bear markets the decision may be to sell at or near a market bottom. In the same case where financial planners are trying to hedge volatility risk, the reaction to loss and selling at the bottom is a perfect example of the impact of this problem. The cash account allows the client to know that goals are being funded with cash rather than the investment portfolio.
The detrimental impact of volatility, taxes, and transaction costs is magnified under some of the most common distribution planning strategies. Reverse dollar cost averaging (RDCA), for example, is a systematic liquidation of the portfolio that exposes a retiree to high levels of volatility risk, taxes, and transaction costs. In this strategy, the benefits of traditional dollar cost averaging (DCA) are turned on its head, as retirees must sell more shares of the portfolio when prices are low to meet financial goals (Blanchett and Frank 2009). The primary disadvantage of a RDCA strategy is exposure to sequence risk. In other words, a RDCA strategy exposes the client to the risk of having to take distributions from asset classes at depressed prices, which increases the risk of running out of money.
Bucket strategies have been developed to better protect a retiree from sequence and longevity risk. Bucket strategies involve the segregation of investment assets into unique “buckets.” A two-bucket strategy, where short- to intermediate-term distributions are held in a liquid bucket, represent an alternative strategy that mitigates volatility risk and reduces transaction costs and taxes, which can improve the longevity of a retirement plan. Evensky (1997) introduced and outlined a simple two-bucket distribution strategy where cash reserves play a critical role. The author designed this distribution strategy to increase the probability of clients meeting their goals throughout retirement. Evensky has reported that this distribution strategy is both economically and behaviorally optimal.
The efficacy of including cash in a distribution strategy is defined by the empirical question of whether the opportunity cost of holding more cash is offset by the reduction in volatility risk, taxes, transaction costs, and positive behavioral framing. The opportunity cost of setting aside large amounts of cash may be justified if the reduction in plan performance due to volatility risk, taxes, and transaction costs exceeds the reduction in expected return from holding cash.
Investigating the One-Year Cash Reserve Strategy
This paper investigates the use of a one-year cash flow reserve (CFR) distribution strategy as a viable way to manage the risk of having to sell investments during bear markets. This study takes into account volatility risk and client behavior while minimizing taxes and transaction costs. The primary objective of this study is to examine the degree to which a two-bucket strategy (a cash liquidity bucket and a long-term investment bucket) improves plan survival rates relative to an investment portfolio (IP) using a RDCA strategy that does not have a cash reserve.
The analysis compares the one-year cash reserve strategy, which is referred to as CFR, to a RDCA strategy with no cash reserve. This paper adds to the literature by considering taxes and transaction costs. In addition, this study accounts for capital market projections, such as lower investment returns than seen historically, in an attempt to provide meaningful results that will assist practitioners in their pursuit of more effective distribution strategies in the projected economic environment. Lower asset class return assumptions account for the concerns researchers have recently raised pertaining to the use of historical data and assumptions that reflect high historical returns (Pfau 2012).
This study is closely related to Bengen (1997), and Woerheide and Nanigian (2012). These two studies explored the efficacy of including cash in IP distribution strategies where distributions are made in tax-deferred and non-taxable environments, respectively. These prior studies used historical returns to assess the efficacy of cash reserves in distribution planning. In most cases, both studies found that cash is not beneficial to the SWR. This study examines the efficacy of distribution strategies that include a separate cash reserve when distributions are made in a lower return environment where taxes and transaction costs are accounted for.
The empirical findings of this study are clear. In a taxable environment with transaction costs and lower investment returns than seen historically, liquidity improves plan survival rates relative to a strategy with no cash reserve. The reduction in taxes, transaction costs, and the detrimental impact of volatility on wealth more than offset the opportunity cost of lower returns due to allocating more wealth at retirement to cash.
This study adds support to the long-held financial planning belief that a portfolio should have a cash reserve to mitigate the risk of having to sell investments at depressed levels to meet needs. It is important to note that survival benefits related to cash reserve strategies diminish as transaction costs relative to portfolio size diminish.
Methodology and Strategies
We used 1,000 Monte Carlo simulations to test the efficacy of the RCDA and CFR strategy in retirement planning. Each of the simulations represented a hypothetical economic environment during retirement with different IP return patterns. The simulations allowed for a future with lower investment returns than seen in the historical data to be modeled.
Specifically, this study assumed an average annual nominal pre-tax return of 8.75 percent for stocks, 4.75 percent for bonds, and 3.50 percent for cash, with inflation projected at 3 percent. Annualized standard deviation was assumed to be 21 percent, 6.5 percent, and 2 percent for stocks, bonds, and cash, respectively. The correlation between stocks and bonds was modeled at 30 percent. These return and volatility assumptions are in line with the latest forward-looking projections as outlined in the popular Money Guide Pro software package. Arnott and Bernstein (2002) and Cornell (2010) have suggested similar capital market projections.
Each simulation incorporated up to 468 months’, or 39 years’ worth of information on investment returns, volatility, taxes, and transaction costs. The following discussion focuses primarily on the 30-year mark in retirement.
At the beginning of each month, income needs are met using the RDCA or CFR distribution strategy. As described previously, the first strategy is referred to as RDCA, which consists of an IP with no cash reserve. The IP for all of the strategies is a simple 60 percent stock and 40 percent bond portfolio that is rebalanced back to the initial asset allocation when the stock/bond balance is more than 5 percentage points out of balance. The simulation is based on a two-asset portfolio (a single diversified bond and one diversified stock position). The monthly income need in the RDCA strategy is satisfied by a monthly pro-rata distribution from stocks and bonds based on the initial 60 percent/40 percent allocation.
The one-year CFR strategy includes an IP and a cash reserve of one year of real retirement income needs. The IP is used to refill the cash reserve if the balance dips below two months’ worth of forward-looking real withdrawal needs. The cash reserve is refilled if there is a need to rebalance and at least one of the asset classes’ prior year return is positive. If both asset classes’ prior year returns are negative, and there is more than two months’ of withdrawal needs, and there is a need to rebalance, then the portfolio is rebalanced but no cash refill occurs due to the potential of selling a depreciated asset.
To account for testing at higher tax rates, the asset class returns were split into a yield and capital appreciation/depreciation component. For this analysis, all capital gains were assumed to be long term in nature, leading to a 15 percent tax rate when an investment with a gain is liquidated. An ongoing cost basis calculation was used (in relation to the market value of the asset class) to calculate capital gains for a given year, where basis of each asset class was assumed to be 100 percent at the beginning of retirement.
The analysis assumed an average basis identification method where each asset class distribution gain or loss was based on the average cost basis across all holdings within that particular asset class. All interest and dividend payments were also taxed at an assumed effective tax rate of 15 percent. In unreported results that confirm the conclusions of this study, simulations were run based on a 20 percent effective tax rate on interest and tax deferred distributions. These results are available on request.
Tax deferred distributions were taxed at a 15 percent effective rate. Transaction costs were set at $30 per trade, which was arrived at from a survey of popular online brokerage adviser-assisted trade costs. It is important to note that an IP is likely to contain more than two positions; therefore, trading costs are likely to be much higher in practice than seen in this study.
Results
To what degree does using a CFR strategy improve plan survival rates relative to a RDCA strategy? In other words, to what degree can financial planners expect a CFR distribution strategy to reduce shortfall risk? The answer to this question was assessed using observed plan survival rates. Transaction costs and taxes across the two strategies were examined to better explain why certain strategies may be expected to perform better than others in terms of increasing the likelihood a client’s goals will be met.
Results in Tables 1 through Table 3 and Figure 1 are based on a case scenario of a client with a $200,000 nest egg at the beginning of retirement, a $30 transaction cost, and a 3 percent to 5 percent real after tax withdrawal rate in 1 percent increments. Based on a 4 percent real withdrawal rate, this leads to a $115,200 allocation to stocks, a $76,800 allocation to bonds, and an $8,000 allocation to cash for the CFR strategy at the beginning of retirement. For a 4 percent real withdrawal rate pertaining to the RDCA strategy, the initial allocation to stocks and bonds is $120,000 and $80,000, respectively.
The following discussion is centered on the 4 percent real withdrawal rate at year 30 in retirement. Results are reported for the one-year CFR. The choice to report this finding is due to the one-year CFR generally outperforming the six-month and two-year CFR strategies tested in unreported results. “No tax and no transaction costs,” “transaction costs only,” “taxes and transaction costs in a tax-deferred environment,” and “taxes and transaction costs in a taxable environment” represent the four retirement environments that are accounted for in the following results.
No Tax and No Transaction Costs
The first distribution environment is one where the client faces no taxes and no transaction costs in retirement. While unrealistic, this section is included for reference to prior academic studies and to assist the reader in assessing the costs and benefits of including cash reserves in a retirement plan.
The strategy survival rates for a 4 percent real withdrawal rate at year 30 indicate that the RDCA strategy leads to less than a 1 percentage point increase in survival rates relative to the CFR strategy. More specifically, 76.9 percent of the RDCA strategy simulated plans continue to fund retirement income in comparison to only 76.0 percent for the CFR strategy. Holding one year of cash reserves is slightly detrimental to plan survival rates when taxes and transaction costs are ignored. This finding is in line with prior studies that ignored taxes and transaction costs.
Transaction Costs Only
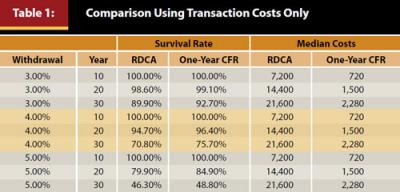
The second distribution environment is one where the client faces no taxes; however, a $30 cost is incurred for each transaction in retirement. In reality, an IP will likely include more than two positions; therefore, costs incurred throughout retirement would likely be higher for the RDCA strategy.
This scenario is similar to a Roth environment with transaction costs. Table 1 indicates that the survival rate for the CFR strategy, using the 4 percent real withdrawal rate at year 30 in retirement, is roughly 5 percentage points higher than the survival rate of the RDCA strategy. Specifically, the CFR strategy displays a 75.7 percent survival rate, whereas the RDCA strategy survival rate is only 70.8 percent. The survival advantage of the CFR strategy increases as the year in retirement increases due to cumulative transaction costs incurred being substantially lower than the cumulative transaction costs incurred by the RDCA strategy.
The cumulative transaction costs incurred by the CFR strategy at year 30 for the 4 percent real withdrawal rate is $2,280, or roughly 90 percent lower than the cumulative transaction costs incurred by the RDCA ($21,600). In short, less frequent liquidations of the IP in the CFR strategy lead to substantially lower transaction costs when compared to the RDCA strategy.1 The costs pertain only to plans that continue to fund income needs at a given year in retirement. The inclusion of all plans would lead to a biased cost comparison when survival rates are different across strategies.
Taxes and Transaction Costs in a Tax-Deferred Environment
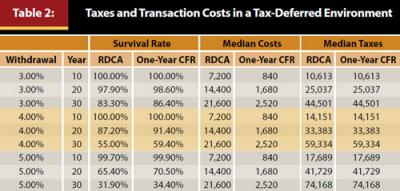
The third distribution environment is one where a client faces a 15 percent effective tax rate on distributions from a tax-deferred IP and a $30 cost is incurred for each transaction in retirement. This scenario is similar to an environment where distributions are taken from a qualified retirement plan where transaction costs are incurred.
Table 2 indicates that the survival rate for the CFR strategy, based on a 4 percent real withdrawal rate at year 30 in retirement, is roughly 4.40 percentage points higher than the survival rate for the RDCA strategy. The survival advantage of the CFR strategy increases as the year in retirement increases due to the increasing cost advantage of the CFR strategy relative to the RDCA strategy. The median cumulative taxes incurred for a given year in retirement are equivalent, as seen in the far right column of Table 2, across strategies.
It is important to note that the survival rate range across strategies for a 4 percent real withdrawal rate at year 30 in retirement dropped from the 70.8 to 75.7 percent range in the transaction cost only scenario, to 55.0 to 59.4 percent range in the tax-deferred environment with taxes and transaction costs. These data reveal the impact of distribution taxes on survival rates.2
Taxes and Transaction Costs in a Taxable Environment
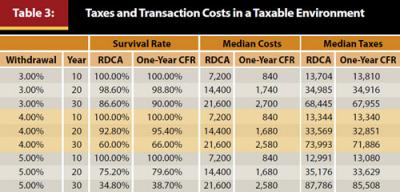
The fourth distribution environment is one where a client faces a 15 percent tax rate on long-term capital gains, dividends, and interest, and a $30 cost is incurred for each transaction in retirement. This scenario illustrates the efficacy of cash reserves in a taxable environment where transaction costs matter. Table 3 indicates that the survival rate for the CFR strategy at 66 percent, using the 4 percent real withdrawal rate at year 30 in retirement, is roughly 6 percentage points higher than the survival rate of the RDCA strategy.
The survival advantage of the CFR strategy increases as the year in retirement increases due to the increasing cost and tax efficiency advantage of the CFR strategy relative to the RDCA strategy. That said, a reduction in transaction costs is the main reason the CFR strategy has a higher survival rate. The cumulative transaction costs incurred by year 30 in retirement for a 4 percent real withdrawal rate CFR strategy is $2,580, or roughly 12 percent of the $21,600 cumulative transaction costs incurred by the RDCA strategy. In other words, the CFR strategy incurs roughly 88 percent less transaction costs than the RDCA strategy by year 30 in retirement due to less frequent IP distributions.
The difference in cumulative taxes incurred for each strategy at the 30-year mark for a 4 percent real withdrawal rate is diminished, but still gives the CFR a slight advantage over the RDCA strategy. Specifically, the RDCA strategy incurs median cumulative taxes of $73,993, which is roughly 3 percent higher than the median CFR strategy cumulative tax bill of $71,886. This difference is likely to be higher in practice due to the greater potential of the RDCA strategy to incur short term capital gains. It is important to reiterate that this study assumes all gains, across strategies, are long term in nature.
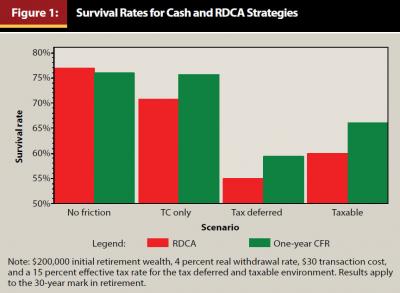
Figure 1 illustrates the survival rate findings of the four unique distribution environments. This figure applies to the $200,000 initial retirement wealth, 4 percent real withdrawal rate, $30 transaction cost, and a 15 percent effective tax rate for the tax deferred and taxable environment. Results apply to the 30-year mark in retirement.
The “no friction” comparison denotes the retirement scenario where the client faces no taxes and no transaction costs. The “TC only” comparison denotes the retirement scenario where the client faces no taxes; however, each transaction incurs a $30 bill and is comparable to Table 1. The “tax deferred” comparison denotes the retirement scenario where the client faces a 15 percent effective tax rate on distributions and incurs a $30 transaction cost per trade. This is comparable to Table 2. Finally, the “taxable” comparison denotes the retirement scenario where long-term capital gains, interest, and dividends incur a 15 percent effective tax rate and a $30 transaction cost remains in place. This scenario is comparable to Table 3.
The aggregate findings are as follows: In a world of no taxes, no transaction costs, and no behavioral concerns about market volatility, then a RDCA strategy leads to an approximate 1 percentage point survival rate advantage over the CFR strategy for a 4 percent real withdrawal rate at year 30 in retirement. In the three remaining and more realistic environments depicted in Table 1 through Table 3, the results are flipped, and the CFR strategy shows between a 4.4 and 6.0 percentage point survival advantage in relation to the RDCA strategy.
Conclusions
The primary conclusion of this study is that a two-bucket strategy incorporating cash reserves along with an IP has an impact on the probability that clients will be able to meet their retirement goals. The results suggest that the long-held financial planning belief that a portfolio should have a cash reserve to mitigate the risk of having to sell investments at depressed price levels and mitigate excessive taxes and transaction costs should continue to influence retirement planning strategies.
In addition, cash reserves appear to provide behavioral benefits to clients as the existence of cash reserves may increase a clients’ willingness to tolerate volatility in the IP and stick with the retirement plan during periods of high market volatility. These behavioral benefits are not quantified in this study; however, financial planning practitioners are encouraged to consider this when assessing the results of this study.
The one-year CFR strategy plan survival rate, or the percentage of retirement plans that remain funded, at the 30-year horizon are up to as much as 6 percentage points higher than the RDCA plan survival rates. The survival advantage of the CFR is robust to different tax and transaction cost assumptions as previously outlined. It is acknowledged that practitioners realize the impact of taxes, transaction costs, volatility, and behavioral attributes of clients. That said, existing retirement research provides limited insight on how these realties impact distribution planning choices.
The results of this study, in conjunction with the potentially powerful role of the behavioral benefits attributable to cash, support the use of cash reserves in retirement planning. Future research that quantifies the behavioral benefits of cash reserves would provide additional insight to practitioners.
Endnotes
- As Table 1 illustrates, a significant benefit of holding cash reserves in retirement is a reduction in transaction costs. The survival advantage of the CFR strategy in a transaction cost only environment, in relation to the RDCA strategy, remains intact for an initial retirement wealth and transaction cost assumption of $200,000 and $20 and $500,000 and $30, respectively. These unreported results suggest a smaller CFR survival advantage and are available upon request.
- In unreported results, the CFR maintains a survival advantage, albeit smaller at roughly 1.1 percentage point, in comparison to the RDCA strategy for a $500,000 initial retirement wealth, $30 transaction cost, and 20 percent effective tax rate on distributions.
References
Arnott, Robert D., and Peter L. Bernstein. 2002. “What Risk Premium is “Normal”?” Financial Analysts Journal 58 (2): 64–85.
Bengen, William P. 1994. “Determining Withdrawal Rates Using Historical Data.” Journal of Financial Planning 7 (4): 171–180.
Bengen, William P. 1997. “Conserving Client Portfolios During Retirement, Part III.” Journal of Financial Planning 10 (12): 84–97.
Blanchett, David M., and Larry R. Frank Sr. 2009. “A Dynamic and Adaptive Approach to Distribution Planning and Monitoring.” Journal of Financial Planning 22 (4): 52–66.
Cornell, Bradford. 2010. “Economic Growth and Equity Investing.” Financial Analysts Journal 66 (1): 54–64.
Evensky, Harold. 1997. Wealth Management: The Financial Advisor’s Guide to Investing and Managing Client Assets. New York, New York: McGraw-Hill.
Evensky, Harold, Stephen M. Horan, and Thomas R. Robinson. 2011. The New Wealth Management: The Financial Advisor’s Guide to Managing and Investing Client Assets. Hoboken, New Jersey: John Wiley and Sons.
Pfau, Wade. 2012. “Capital Market Expectations, Asset Allocation, and Safe Withdrawal Rates.” Journal of Financial Planning, 25 (1): 36–43.
Pye, Gordon B. 2001. “Adjusting Withdrawal Rates for Taxes and Expenses.” Journal of Financial Planning 14 (4): 126–136.
Woerheide, Walter, and David Nanigian. 2012. “Sustainable Withdrawal Rates: The Historical Evidence on Buffer Zone Strategies.” Journal of Financial Planning 25 (5): 46–52.
Citation
Pfeiffer, Shaun, John Salter, and Harold Evensky. 2013. “The Benefits of a Cash Reserve Strategy in Retirement Distribution Planning.” Journal of Financial Planning 26 (9): 49–55.