Journal of Financial Planning: November 2023
Executive Summary
- Retirees—and those planning for retirement—are in debt to William Bengen for developing an analytic framework to determine portfolio withdrawal rates. However, the annual Treasury bond yield data on which Bengen relied may be of questionable suitability for purposes of retirement portfolio analysis. The Treasury bond yield data may not be suitable because those yields are for newly purchased bonds, and retirees are not purchasing bonds but are instead drawing down from their portfolios of bonds in retirement.
- For retirees, rising bond yields can even be an unwelcome development, as the market value of a bond portfolio moves in the opposite direction of bond yields.
- Here, Bengen’s results are revisited with a different set of annual bond return data from an index that tracks the market value of a portfolio of U.S. bonds: the Bloomberg U.S. Aggregate Bond Index.
- With this bond index data, these new results largely reinforce Bengen’s results with respect to a “SAFEMAX” initial withdrawal rate in the vicinity of 4.5 percent. The addition of some more equity diversification to the stock portfolio by including U.S. mid-cap stocks can improve portfolio performance and boost the “SAFEMAX” rate.
Christopher M. Duquette, Ph.D., is an economist with the National Security Engineering Center, a federally funded research and development center (FFRDC) operated by The MITRE Corporation.* Christopher received a Ph.D. in economics from UC Davis and has been published in Applied Economics, Atlantic Economic Journal, and National Tax Journal.
*The author’s affiliation with The MITRE Corporation is provided for information purposes only and is not intended to convey or imply MITRE’s concurrence with, or support for, the positions, opinions, or viewpoints expressed by the authors.
JOIN THE DISCUSSION: Discuss this article with fellow FPA Members through FPA's Knowledge Circles.
FEEDBACK: If you have any questions or comments on this article, please contact the editor HERE.
NOTE: Click on the images below for PDF versions
It has now been 30 years since the publication of William Bengen’s seminal 1994 article in the Journal of Financial Planning. Bengen examined historical returns data for a portfolio of stocks and bonds to determine the optimal withdrawal rate that avoided the worst-case scenario of portfolio liquidation over the course of a 30-year retirement time frame. Bengen’s original result was nicknamed the “4 Percent Rule”—although Bengen did not call it that. Bengen’s novel approach to retirement portfolio analysis has received press coverage and has helped boost public awareness about financial planning for retirement.
However, the bond yield data on which Bengen relied may be of questionable suitability for purposes of retirement portfolio analysis. Bengen’s bond returns were taken from the annual yields to intermediate-term U.S. Treasury bonds (Treasuries). These are the annual yields for newly purchased bonds. For purposes of analysis, though, retirees are not assumed to be purchasing bonds but are instead assumed to be drawing down from their portfolios of bonds (and stocks) that were accumulated during their working years. In other words, retirees’ bond portfolios do not necessarily earn the most current bond yields.
Moreover, bond valuations move in the opposite direction to movement in bond yields. Bond valuations and bond yields move in opposite directions because a bond is a promise to pay a fixed sum of money at a future maturity date. Rising bond yields can be an unwelcome development for retirees, as rising yields have the effect of shrinking the market value of the bond holdings from which they are drawing down in retirement.1 Conversely, declining bond yields may be welcomed by retirees as they boost the value of their bond holdings.
A different set of bond return data that may be more suitable for these purposes of analysis is the annual returns to the Bloomberg U.S. Aggregate Bond Index. The index dates to 1976 and tracks the market value of a portfolio of U.S. bonds. The portfolio includes U.S. government bonds and U.S. corporate bonds. It is not possible to invest in the index directly, but there are several funds that track the index. These include the iShares Core U.S. Aggregate Bond Exchange-Traded Fund (AGG), the Vanguard Total Bond Market Index Fund (VBMFX), and the Fidelity U.S. Bond Index Fund (FXNAX). (For U.S. federal government employees in the Thrift Savings Plan, there is also the F Fund.)
Literature Review
The retirement investing literature follows from Bengen’s 1994 Journal of Financial Planning article, which examined 1926–92 returns data and found a maximum initial withdrawal rate of 4.0 percent for a portfolio of U.S. large-cap stocks and intermediate-term U.S. Treasuries with a minimum requirement of 30 years of portfolio longevity (Bengen 1994). Bengen called it “SAFEMAX”: the highest withdrawal rate that safely avoids the worst-case scenario of portfolio liquidation for any cohort of retirees over a 30-year retirement. Bengen assumed a 50/50 allocation between U.S. large-cap stocks and intermediate-term U.S. Treasuries, with annual rebalancing. In addition, the initial withdrawal dollar total was adjusted for inflation each year to preserve constant purchasing power. Bengen, in 1997, raised the SAFEMAX initial withdrawal rate to 4.3 percent by adding some more diversification with the inclusion of 30 percent small-caps in the stock portfolio (Bengen 1997). Bengen boosted the SAFEMAX initial withdrawal rate again, to 4.5 percent, in a 2006 book (Bengen 2006). Others have expanded upon Bengen’s analysis by modifying some of the assumptions about fixed withdrawal rates (Guyton and Klinger 2006) and risk tolerance (Spitzer, Strieter, and Singh 2007), and by extending the analysis to investors in other countries (Pfau 2010). Bengen reaffirmed his findings most recently in a 2021 Barron’s interview (Templin 2021).
Revisiting SAFEMAX
Here, a new set of SAFEMAX results is presented with bond index returns data from the Bloomberg U.S. Aggregate Bond Index. As noted above, the case for the bond index data with respect to this line of analysis is that it captures changes in the market value of the bond holdings in retirees’ asset portfolios. From the standpoint of portfolio longevity, that is the key criterion. The time frame for analysis is limited by the availability of the bond index data and spans the half-century from the start of 1973 to the end of 2022.2 That half-century is a shorter time frame than Bengen’s original 1926–92 time frame (later extended) and does not include the Great Depression. Bengen noted that the 1970s “stagflation”—he nicknamed it the “Big Bang”—was more challenging for retirees than the Great Depression because of the one-two punch from stocks’ lagging performance coupled with high inflation rates that necessitated ever-larger annual increases in portfolio withdrawals to maintain constant purchasing power. By contrast, the early years of the Great Depression saw price deflation, which somewhat cushioned the impact of the stock-market downturn in constant-dollar terms for retirees.3
The 1973–2022 half-century included seven “bear markets,” marked by declines in the broad stock market of 20 percent or greater.4 The bear markets occurred during 1973–74, 1980–82, 1987, 2000–02, 2007–09, 2020, and 2022. They ranged in severity from a 57 percent peak-to-trough drop in 2007–09 to a 25 percent peak-to-trough drop in 2022. The half-century also included 19 lesser “corrections,” marked by broad stock market declines between 10 percent and 20 percent. As such, a bear market or a correction occurred on average roughly every other year over the half-century.5 Yet markets also tended to recover strongly; the S&P 500 Index posted year-over-year declines for just 13 of the 50 years while rising on average 7.2 percent annually.6
For the 1973–2022 half-century, an initial set of results is obtained from calculating the maximum 30-year withdrawal rates for Bengen’s original 50/50 portfolio allocation, with U.S. stocks represented by the total returns (including reinvested dividends) for U.S. large-cap company stocks in the S&P 500 Index7 and U.S. bonds represented by the Bloomberg U.S. Aggregate Bond Index. As noted earlier, Bengen’s original 50/50 portfolio consisted of U.S. large-caps and U.S. intermediate-term Treasuries. Here, the 50/50 stocks–bonds split is maintained but with bonds represented by the bond index. The calculations assume a $1 million portfolio at retirement, with an annual inflation adjustment8 to the initial withdrawal dollar total and annual rebalancing. The results are displayed in Figure 1.
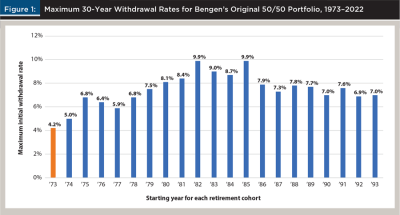
As shown in Figure 1, the 1973–2022 time frame of 50 years allows for 21 cohorts with 30-year retirements. The 1973 cohort’s retirement lasts through 2002, the 1974 cohort’s retirement lasts through 2003, and on down to the 1993 cohort’s retirement, which lasts through 2022. Across all 21 cohorts, the SAFEMAX initial withdrawal rate is 4.2 percent. That is the maximum initial withdrawal rate that safely avoids the worst-case scenario of portfolio liquidation for any 30-year cohort over the full half-century. The withdrawal rates varied from the SAFEMAX low of 4.2 percent for the cohort that retired in 1973 to a high of more than 9.0 percent for cohorts that retired in the mid-1980s. Those mid-1980s cohorts had the good fortune to retire during a “bull market” and in an environment of relatively low inflation, which had the effect of turbocharging their portfolios’ early growth and consequently allowing higher initial withdrawal rates. While they also had the misfortune to suffer the steep bear market of 2007–09, they experienced it relatively late during their 30-year retirement time frame, so the portfolio damage was not as severe as was the portfolio damage for the later cohorts that experienced it earlier in their retirements. The 2007–09 bear market was the most severe of the half-century and saw a 57 percent decline in the S&P 500 Index from peak to trough.9
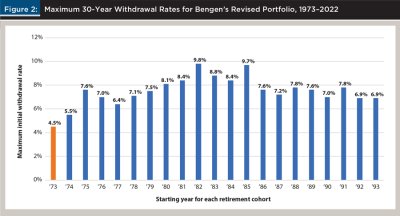
Consider next the effect of some additional diversification. Recall that Bengen in 1997 raised the SAFEMAX initial withdrawal rate to 4.3 percent with the inclusion of 30 percent U.S. small-cap stocks in the stock portfolio. The additional diversification from the inclusion of U.S. small-cap stocks improved portfolio performance, thereby allowing a higher SAFEMAX initial withdrawal rate. Here, U.S. small-cap stocks are represented by the total returns (including reinvested dividends) to U.S. small-cap company stocks in the Russell 2000 Small-Cap Index.10,11 Figure 2 shows the results for Bengen’s revised portfolio with 30 percent U.S. small-cap stocks in the stock portfolio and the bond portfolio taken from the Bloomberg U.S. Aggregate Bond Index. The overall ratio of stocks to bonds is still 50/50, and the Figure 2 allocation is 35 percent large-cap stocks, 15 percent small-cap stocks, and 50 percent bonds. As with Figure 1, assume a $1 million portfolio at retirement with an annual inflation adjustment to the initial withdrawal total and annual rebalancing.
The Figure 2 distribution resembles that of Figure 1, with lower withdrawal rates for the earlier cohorts that experienced the 1970s “stagflation” at the start of their 30-year retirements. The later cohorts were fortunate to avoid the 1970s stagflation in retirement and began their retirements in circumstances that were more favorable from the standpoint of market returns and inflation. Most importantly, the worst-case SAFEMAX withdrawal rate has risen to 4.5 percent. The worst-case cohort is again the 1973 cohort, but the addition of small-cap stocks to the portfolio has the salutary effect of slightly raising the safe withdrawal rate for that cohort. This result reinforces Bengen’s finding that the inclusion of small-cap stocks in the equity portfolio can boost the safe withdrawal rate.
The additional diversification from the inclusion of U.S. small-cap stocks can be illustrated by the matrix of correlations. Figure 3 is the correlations matrix for 1973–2022 annual returns from U.S. large/mid/small-cap stocks and U.S. bonds. The matrix includes U.S. mid-cap stocks, as represented by the total returns (including reinvested dividends) for U.S. mid-cap company stocks in the Russell 800 Mid-Cap Index.12,13 The returns to U.S. large/small-cap stocks and U.S. bonds are taken from the same indices that were the inputs for Figures 1 and 2. Mid-cap stocks are included because they have been described as occupying the “sweet spot” between large-caps and small-caps, with the stability of large-caps and the growth potential of small-caps (Braham 2022). Over the 1973–2022 half-century, U.S. mid-caps outperformed both U.S. large-caps and U.S. small-caps, with an annual return of 11.6 percent against 10.3 percent for large-caps and 10.8 percent for small-caps.14 Mid-caps’ annual returns for 1973–2022 were also less variable than small-caps’, although more variable than large-caps’.15
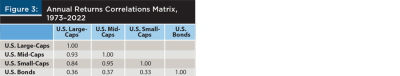
The Figure 3 matrix of correlations has repeat values of 1.00—indicating perfect correlation—down the diagonal because each asset is of course perfectly correlated with itself. In addition, the matrix’s above-diagonal entries are blank because they are duplicated by the below-diagonal entries. For the below-diagonal entries, it is evident that the inclusion of small-cap stocks can help diversify the asset portfolio and that the inclusion of mid-cap stocks can offer an additional diversification boost. It is also evident that bonds’ returns are much less correlated with those of stocks, with correlation values of 0.3–0.4. These low correlation values reinforce how the inclusion of bonds is helpful in providing so-called “portfolio ballast” (Templin 2022) and dampening portfolio variation.
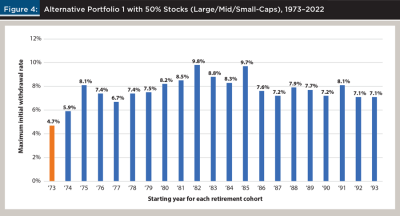
How might the inclusion of U.S. mid-cap stocks affect the performance of the 30-year retirement portfolio? The correlations matrix suggests that mid-cap stocks can provide some additional diversification, which may have the effect of boosting the SAFEMAX initial withdrawal rate. Figure 4 presents the 30-year maximum withdrawal rate results for an alternative portfolio of 50 percent bonds and 50 percent stocks with the equity allocation split equally across U.S. large/mid/small-cap stocks at 16.7 percent large-caps, 16.7 percent mid-caps, and 16.7 percent small-caps. The annual returns data for bonds and large/small-cap stocks are the same inputs as for Figures 1–3 and once again assume a $1 million portfolio at retirement with an annual inflation adjustment to the initial withdrawal total and annual rebalancing.
The Figure 4 result is that the inclusion of U.S. mid-caps in the stock portfolio permits a new SAFEMAX rate of 4.7 percent. That is the 30-year maximum withdrawal rate for the 1973 cohort, which is still the worst-case cohort. The overall distribution of rates remains similar to that for Figures 1 and 2, with lower withdrawal rates for the earlier cohorts that had the misfortune to begin their retirements during the 1970s stagflation. A comparison of Figure 4 with Figure 2 indicates that the addition of mid-caps to the large/small-cap stock portfolio yields a slight improvement in portfolio performance: the withdrawal rates for all but one of the cohorts either saw a slight increase or were unchanged. (The lone exception was the 1984 cohort, which saw a decrease from 8.4 percent to 8.3 percent.) Most importantly, there was an improvement in portfolio performance for the worst-case cohort, which is the key cohort from a SAFEMAX standpoint.
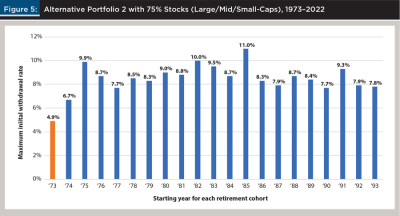
Suppose that the portfolio’s allocation to stocks is increased from 50 percent to 75 percent. For retirement-longevity purposes, Bengen recommended a portfolio of stocks and bonds with no less than 50 percent stocks and preferably an allocation to stocks of between 50 percent and 75 percent. Bengen recommended against higher stock allocations of above 75 percent because they reduced portfolio longevity due to the greater exposure to losses from stock-market downturns. Figure 5 displays the 30-year maximum withdrawal rate results for a second alternative portfolio, featuring 25 percent bonds and 75 percent stocks with the equity allocation split equally across large/mid/small-caps at 25 percent large-caps, 25 percent mid-caps, and 25 percent small-caps. As before, assume a $1 million portfolio at retirement with an annual inflation adjustment to the initial withdrawal total and annual rebalancing.
Figure 5 shows that a 75 percent exposure to stocks further boosted the SAFEMAX rate to 4.9 percent. The worst-case was still the 1973 cohort, and the distribution still peaked in the mid-1980s, but the entire distribution was shifted upwards as every cohort saw an increase in the maximum withdrawal rate. (For the 1985 cohort, the maximum withdrawal rate rose to 11.0 percent.) This result reinforces how stocks are a retirement portfolio’s workhorse in terms of their superior returns over time.16 In this case, the portfolio’s returns payoff from the additional 25 percent exposure to stocks, from 50 percent to 75 percent, more than offsets the added risk (variation) over a 30-year retirement time frame. The result for the retirement investor is an added boost to the SAFEMAX withdrawal rate.
Conclusion
For retirees whose asset portfolios include bonds, the current market rate of return on bonds is not necessarily the rate of return that they receive because their bonds were not purchased in today’s market. The bonds in their portfolios were instead purchased years ago—during their working years—while they were building their portfolios for retirement. Rising bond yields can even be an unwelcome development for retirees by shrinking the market value of their bond holdings. William Bengen’s seminal analysis of optimal retirement portfolio withdrawal rates featured bond yield data that may not have accounted for this critical distinction.
Here, Bengen’s findings are revisited with a different set of bond returns data, from the Bloomberg U.S. Aggregate Bond Index. The index tracks changes in the market value of a bond portfolio, which is the more relevant criterion for retirees who hold a portfolio of bonds and stocks and are drawing down from that portfolio over the course of their retirement. Inclusion of this bond index data yields a set of results that largely reinforces Bengen’s results with respect to a SAFEMAX initial withdrawal rate in the vicinity of 4.5 percent. These results also suggest that the inclusion of some additional equity diversification from U.S. mid-cap stocks17 can improve portfolio performance and boost the SAFEMAX rate to almost 5 percent.
A disclaimer is that these findings do not consider the relaxation of the SAFEMAX portfolio withdrawal rate assumptions, to allow for adjustments to retirees’ withdrawal rates over time or for adjustments to retirees’ portfolio allocations over time. In following Bengen (1994), the withdrawal dollar-total is held constant (in inflation-adjusted terms), and the stock–bond portfolio is rebalanced each year to return it back to a baseline allocation. As Bengen (1997) and others have shown, allowing the withdrawal rate to vary over time depending on market conditions, with smaller withdrawals during bear markets when the portfolio from which withdrawals are taken has shrunk, can improve portfolio longevity. Likewise, allowing for portfolio adjustments over time, such as Bengen’s (1996) 1 percent “phase-down” in the portfolio’s stock allocation over each year of retirement, can also improve portfolio longevity by reducing risk. These SAFEMAX results do not relax those assumptions, to spotlight the effect from the substitution of the bond index data for the bond yield data (and, separately, the inclusion of U.S. mid-cap stocks in the equity portfolio). It follows that these SAFEMAX results may represent a lower bound for the optimal portfolio withdrawal rate—with the potential for still-greater portfolio longevity if the assumptions are relaxed.
William Bengen’s SAFEMAX research has empowered three decades of retirement investors with an analytic framework for portfolio withdrawal rates. These findings with the bond index data for the 1973–2022 half-century—with its seven bear markets and nineteen corrections—may be helpful to further assist retirees and those planning for retirement as they manage their portfolios and seek to optimize their withdrawal rates.
Citation
Duquette, Christopher M. 2023. “Revisiting William Bengen’s ‘SAFEMAX’ Portfolio Withdrawal Rate.” Journal of Financial Planning 36 (11): 78–87.
Endnotes
- In a separate context, this aspect of bonds was dramatically illustrated in early 2023 when several U.S. regional banks failed after a sharp decline in the value of their bond reserves triggered a wave of depositor withdrawals (Bary 2023).
- For 1973–75, returns data were taken from the Fidelity Investment Grade Bond Fund (FBNDX).
- For the deflationary years, the annual portfolio withdrawal dollar total would be reduced to maintain constant purchasing power.
- As represented by the S&P 500 Index.
- The tail end of the half-century, from 2018 through 2022, was especially turbulent, with two bear markets and two corrections in five years.
- From an index value of 118.05 at the start of 1973 to an index value of 3839.50 at the close of 2022. Total returns (including reinvested dividends) for the large-cap stocks in the S&P 500 Index averaged 10.3 percent annually over the same 50-year period.
- One cannot invest directly in the S&P 500 Index, but one can invest in funds that track the index. These include the Vanguard S&P 500 Exchange-Traded Fund (VOO), the Vanguard 500 Index Mutual Fund (VFINX), and the Fidelity 500 Index Mutual Fund (FXAIX), to name a few. Of note is that VFINX is the successor to Vanguard founder Jack Bogle’s original First Index Investment Trust, which was the first publicly available index fund.
- Annual inflation rates are taken from the U.S. Consumer Price Index (CPI) database maintained by the U.S. Federal Reserve Bank of Minneapolis (2023).
- For the year 2008, which was the worst single year of that bear market (and the worst single year for stocks over the full 1973–2022 half-century), the S&P 500 Index declined 37.0 percent, including reinvested dividends.
- For the years 1994 and earlier, U.S. small-cap returns are taken from the French/Fama database at https://mba.tuck.dartmouth.edu/pages/faculty/ken.french/data_library.html.
- While one cannot invest directly in the Russell 2000 Index, one can invest in funds that track the index such as the iShares Russell 2000 Exchange-Traded Fund (IWM) and the Fidelity Small-Cap Index Fund (FSSNX).
- U.S. mid-cap returns for 1994 and earlier are taken from the French/Fama database.
- Funds that track the Russell 800 Index include the iShares Mid-Cap Exchange-Traded Fund (IWR) and the Fidelity Mid-Cap Index Fund (FSMDX).
- Of note is that the last decade (2013–22) has been all about large-cap tech as U.S. large-caps outperformed with a compound annual return of 12.6 percent against 11.0 percent for U.S. mid-caps and 9.0 percent for U.S. small-caps.
- Over 1973–2022, the standard deviation for U.S. mid-caps’ annual percentage returns was 19.2 percent, compared to 17.7 percent for U.S. large-caps’ returns and 21.0 percent for U.S. small-caps’ returns.
- Regarding the stock market’s performance over time, Berkshire Hathaway CEO Warren Buffett has famously said that “the stock market is a device for transferring money from the impatient to the patient” (Reese 2018).
- Over 1973–2022, mid-cap stocks displayed less risk (variation) than small-caps while outperforming large-caps and small-caps.
References
Bary, Andrew. 2023. “How SVB Was Doomed by a Bad Bet on Mortgage Securities and the Fed’s Rate Hikes.” Barron’s. www.barrons.com/articles/svb-silicon-valley-bank-rates-securities-693c931c.
Bengen, William P. 1994. “Determining Withdrawal Rates Using Historical Data.” Journal of Financial Planning 7 (4): 171–180.
Bengen, William P. 1996. “Asset Allocation for a Lifetime.” Journal of Financial Planning 9 (4): 58–67.
Bengen, William P. 1997. “Conserving Client Portfolios During Retirement, Part III.” Journal of Financial Planning 10 (6): 84–97.
Bengen, William P. 2006. Conserving Client Portfolios During Retirement. Denver: FPA Press.
Braham, Lewis. 2022. “This Fund Has Found the Sweet Spot Between Growth and Value.” Barron’s. www.barrons.com/articles/fidelity-mid-cap-stock-fund-growth-value-51666764001.
Guyton, Jonathan T., and William J. Klinger. 2006. “Decision Rules and Maximum Initial Withdrawal Rates.” Journal of Financial Planning 19 (3): 49–59.
Pfau, Wade D. 2010. “An International Perspective on Safe Withdrawal Rates: The Demise of the 4 Percent Rule?” Journal of Financial Planning 23 (12): 52–61.
Reese, John P. 2018. “Winning in the Market with the Patience of the Wright Brothers and Warren Buffett.” Forbes. www.forbes.com/sites/investor/2018/01/30/winning-in-the-market-with-the-patience-of-the-wright-brothers-and-warren-buffett/?sh=7cd77f5e633b.
Spitzer, John J., Jeffrey C. Strieter, and Sandeep Singh. 2007. “Guidelines for Withdrawal Rates and Portfolio Safety During Retirement.” Journal of Financial Planning 20 (10): 52–59.
Templin, Neal. 2021. “The Originator of ‘The 4% Rule’ Thinks It’s off the Mark. He Says It Now Could Be Up to 4.5%.” Barron’s. www.barrons.com/articles/the-originator-of-the-4-retirement-rule-thinks-its-off-the-mark-he-says-it-now-could-be-up-to-4-5-51611410402.
Templin, Neal. 2022. “Bonds Are Ready to Shine Again. 4 Tips So You Don’t Get Burned.” Barron’s. www.barrons.com/articles/bonds-investing-51671827187.
U.S. Federal Reserve Bank of Minneapolis. 2023. “Consumer Price Index, 1913-.” www.minneapolisfed.org/about-us/monetary-policy/inflation-calculator/consumer-price-index-1913-.