Journal of Financial Planning: March 2023
Executive Summary
- Individuals are often advised to contribute to a Roth account if the tax rate is expected to increase because it will have a higher after-tax accumulation (ATA) than a traditional account contribution (vice versa if the tax rate is expected to decrease).
- The ATA of a Roth or traditional account contribution is uncertain because future investment returns are uncertain. The future tax rate is also uncertain, which affects a traditional (but not Roth) account’s ATA. One thus might think that a contribution’s ATA is more uncertain for a traditional account than for a Roth account, a purported advantage of a Roth account.
- This paper shows that the ATA’s uncertainty could be lower or higher for a Roth account. It also shows that this uncertainty generally is higher for the type of account with the higher expected ATA (which type depends on whether the tax rate is expected to increase or decrease).
- This means there is a tradeoff between a higher expected ATA and lower ATA uncertainty. Choosing the account type to meet one of these considerations generally means the other consideration will not be met.
David S. Hulse, Ph.D., is an emeritus professor at the University of Kentucky. He has published tax-related articles in this Journal and many others and is a contributing author for a federal taxation textbook. He is a co-recipient of the 2021 Montgomery-Warschauer Award. Click HERE to email.
JOIN THE DISCUSSION: Discuss this article with fellow FPA Members through FPA's Knowledge Circles.
FEEDBACK: If you have any questions or comments on this article, please contact the editor HERE.
Note: Click on the images below for PDF versions
Many individuals contribute to Roth and traditional accounts (e.g., 401(k) accounts and IRAs) to save for retirement. There is an extensive literature comparing the after-tax accumulations (ATAs) to which these contributions will grow.1 This literature generally recommends contributing to a Roth account when the tax rate is expected to increase and to a traditional account when it is expected to decrease.
Less attention has been paid to the ATA’s uncertainty, which occurs because future investment returns and tax rates are uncertain. While the ATAs of both types of accounts depend on future investment returns, a traditional (but not Roth) account’s ATA also depends on the future tax rate. One thus might think that a contribution’s ATA is more uncertain for a traditional account than for a Roth account, a purported advantage of a Roth account.
This paper models the ATA’s uncertainty (i.e., variance of its statistical distribution) and shows that it could be lower or higher for a Roth account than for a traditional account.2 The models also show that there generally is a tradeoff between a higher expected ATA (i.e., mean of its statistical distribution) and lower ATA uncertainty. That is, the account type can be chosen to obtain a higher expected ATA but not lower ATA uncertainty. It can instead be chosen to obtain lower ATA uncertainty but not a higher expected ATA.
One way of understanding these results is that the government is effectively a silent partner in a traditional (but not Roth) account because distributions from it are taxable (Reichenstein 2007). If the tax rate increases, more of a traditional account’s investment returns are taxed away, leaving the individual with less of the returns but also less of their risk. Conversely, if the tax rate decreases, the government’s share of the account decreases, leaving the individual to bear more of the returns’ risk.
This tradeoff between the expected ATA and its uncertainty is likely to be made differently among clients because their risk aversion differs. Some may favor a higher ATA, while others may favor lower ATA uncertainty. A financial planner can help clients decide how to best make this tradeoff.
Models of After-Tax Accumulation
Contributions to a traditional account are excluded from gross income (e.g., traditional 401(k)) or deductible for adjusted gross income (e.g., traditional IRA, generally). A traditional account distribution generally is taxable as ordinary income. Roth account contributions are not excludable or deductible, but a distribution from it is tax-free if the individual is at least age 59½ and at least five years have elapsed since the individual first contributed to a Roth account.3
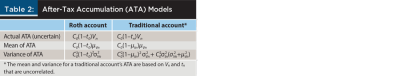
The after-tax amounts to which Roth and traditional account contributions will grow are modeled. Table 1 describes the variables used in the models, and Table 2 presents the models.
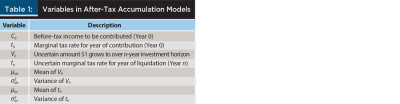
An individual wants to contribute C0 dollars of before-tax income to a Roth or traditional account (in Year 0, the current year).4 The marginal tax rate for Year 0 is t0, so the individual has C0 (1–t0) of after-tax income that can be contributed to a Roth account. Alternatively, the individual can contribute all C0 of before-tax income to a traditional account.
Over the n-year investment horizon, each contributed dollar grows to Vn dollars. For example, if the annual return is 5 percent and the investment horizon is 20 years, Vn is 2.65 (1.0520). The analysis assumes that the individual liquidates the account’s entire balance at the end of the investment horizon.5 It also assumes that the individual will be at least age 59½ at that time and that the investment horizon is at least five years. The individual thus will not incur the 10 percent penalty for early distributions, and a Roth account distribution will be tax-free.
After-tax accumulation (ATA). If the individual contributes to a Roth account, the C0(1–t0) contribution will grow to C0(1–t0)Vn, which is also the ATA because no tax will be imposed. If the individual instead contributes to a traditional account, the C0 contribution will grow to C0Vn before paying taxes at the Year n marginal tax rate (tn).6 The ATA is C0 Vn(1–tn).
Mean of ATA. Vn and tn are uncertain because they occur in the future. The possible values of Vn have a statistical distribution with a mVn mean and a s2Vn variance, and the distribution of tn has μtn mean and a s2tn variance.7,8 The uncertainty of Vn and tn means that the actual ATA of a Roth or traditional account contribution is also uncertain. The statistical distributions of these ATAs’ possible values have the following means (if Vn and tn are uncorrelated):9
Mean of Roth account’s ATA =
C0(1–t0)mVn (1)
Mean of traditional account’s ATA =
C0(1–mtn)mVn (2)
The ATA’s mean is greater for a Roth account than for a traditional account when Expression (1) is greater than Expression (2). This comparison simplifies t0 < mtn, a result with which many financial planners are familiar. That is, if the tax rate is expected to increase from Year 0 to Year n, the expected ATA is higher for a Roth account than for a traditional account. Conversely, a traditional account’s expected ATA is higher if the tax rate is expected to decrease.
Variance of ATA. It can be shown that the ATAs’ variances are as follows (if Vn and tn are uncorrelated):
Variance of Roth account’s ATA =
C20(1–t0)2s2Vn (3)
Variance of traditional account’s ATA =
C20(1–mtn)2s2Vn + C20s2tn(s2Vn+m2Vn) (4)
As noted earlier, one might think that the ATA’s variance is higher for a traditional account than for a Roth account because the former (but not the latter) involves s2tn. A comparison of the two expressions shows that this is not necessarily so.
The second term of Expression (4) is positive, which tends to make it greater than Expression (3). This tendency for the ATA’s variance to be greater for a traditional account is consistent with what one might think about the two variances. However, the first term of Expression (4) is less than Expression (3) if mtn is greater than t0. This means that the ATA’s variance could be lower for a traditional account than for a Roth account, inconsistent with what one might think.
Setting Expression (4) to be greater than Expression (3), the variance of a contribution’s ATA is higher for a traditional account than for a Roth account if (assuming Vn and tn are uncorrelated):
(5)
Some insights can be gleaned from Expression (5), despite its complexity.10 Note that the right hand side is positive. This means that the ATA’s variance is higher for a traditional account if the left hand side is negative, which occurs if t0 is greater than mtn (i.e., the tax rate is expected to decrease). However, a traditional account has a higher mean ATA than a Roth account in this situation, which means there is a tradeoff: a higher expected ATA but more ATA uncertainty for a traditional account versus a lower expected ATA but lower ATA uncertainty for a Roth account.
Another insight from Expression (5) is that the right hand side is often small, so the left hand side may be greater than it.11 This means that the variance of a contribution’s ATA is lower for a traditional account than for a Roth account if the tax rate is expected to increase by more than a small amount. However, a Roth account has a higher mean ATA than a traditional account in this situation, which means there is a tradeoff: a higher expected ATA but more ATA uncertainty for a Roth account versus a lower expected ATA but lower ATA uncertainty for a traditional account.
Intuition. The tradeoff between the expected ATA and its uncertainty relates to the fact that the ATA’s variance can be lower for a traditional account contribution than for a Roth account contribution. One way to understand why this can occur is to think of the government as a traditional account’s silent partner (Reichenstein 2007). Distributions from the account are taxable, so the government effectively owns a portion of it. This means that the government shares the investment returns’ risk, and it shares more of the risk when the future tax rate is higher. For example, if this rate were 91 percent (the top individual tax bracket for much of the 1950s), an individual would realize little of a traditional account’s balance after taxes, but that portion would bear little of the entire account’s investment return risk.12
Numerical Examples
Two numerical examples illustrate the models and their results. They differ in the type of account for which the expected ATA and its uncertainty are higher (Roth for Example 1, and traditional for Example 2).
Example 1. Table 3 summarizes Example 1, and the appendix presents supporting calculations. Mary has $10,000 of before-tax income to contribute, and her current tax rate is 24 percent. Mary thus contributes $7,600 ($10,000 × (1 – 0.24)) to a Roth account or $10,000 to a traditional account.
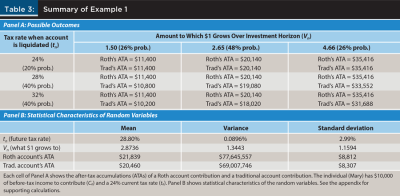
Because of the government’s budget deficits, Mary believes that tax rates are likely to increase in the future, but she is unsure about the extent of the increase. She believes her future tax rate has a 20 percent chance of being 24 percent (no increase), a 40 percent chance of being 28 percent, and a 40 percent chance of being 32 percent. Her uncertain future tax rate thus has a mean of 28.8 percent and a variance of 0.0896 percent (2.99 percent standard deviation).
For the investments in her Roth or traditional account, Mary believes there is a 26 percent chance that each dollar contributed grows to $1.50, a 48 percent chance it grows to $2.65, and a 26 percent chance it grows to $4.66.13 The uncertain growth thus has a 2.8736 mean and a 1.3443 variance (1.1594 standard deviation).
There are nine possible combinations of Mary’s future tax rate and growth of her investments. The ATA’s mean for these outcomes is $21,839 for a Roth account and $20,460 for a traditional account. The mean is higher for a Roth account, consistent with the expected tax rate increase (from 24 percent to 28.8 percent). The ATA’s variance of $77,645,557 for a Roth account is higher than the $69,007,746 for a traditional account (standard deviations are $8,812 and $8,307, respectively). Mary faces a tradeoff between a Roth account’s higher expected ATA and a traditional account’s lower ATA uncertainty.14
Example 2. Table 4 summarizes Example 2, and the appendix presents supporting calculations. Kevin has $8,000 of before-tax income to contribute, and his current tax rate is 22 percent. Kevin contributes $6,240 ($8,000 × (1 – 0.22)) to a Roth account or $8,000 to a traditional account.
Like Mary, Kevin believes that tax rates in general are likely to increase. However, he expects his future taxable income to be lower because he plans on retiring to his hometown, where the cost of living is lower than where he currently lives. Kevin believes his future tax rate has a 20 percent chance of being 12 percent (current tax bracket for his expected future taxable income), a 40 percent chance of being 16 percent, and a 40 percent chance of being 20 percent. His uncertain future tax rate thus has a mean of 16.8 percent and a variance of 0.0896 percent (2.99 percent standard deviation).
Kevin has the same beliefs as Mary about the growth of the investments in his Roth or traditional account. The uncertain growth again has a 2.8736 mean and a 1.3443 variance (1.1594 standard deviation).
Because Kevin’s tax rate is expected to decrease (from 22 percent to a 16.8 percent mean), the models indicate that that the ATA’s mean and variance are higher for a traditional account than for a Roth account.15 The mean is indeed higher for a traditional account ($19,127 versus $17,931), as well as the variance ($60,105,311 versus $52,343,000; standard deviations of $7,753 versus $7,235). Kevin faces a tradeoff between a traditional account’s higher expected ATA and a Roth account’s lower ATA uncertainty.
Other Relevant Factors
The analysis considers important factors that affect the decision to contribute to a Roth or traditional account, but it does not consider all factors. For example, the analysis assumes that the account will be liquidated as a lump sum rather than a series of distributions, it does not consider required minimum distributions, and it assumes that investment returns and the future tax rate are uncorrelated (see endnotes 5 and 9). The models that would result from relaxing these assumptions would be more complex, making it more difficult to see the economic intuition regarding tax rate uncertainty that the simpler analysis highlights.
For the same reason, the analysis does not consider qualified charitable distributions (QCDs), where an individual age 70½ or older directs that a payment be made directly from their traditional IRA to a qualified charity (limited to $100,000 annually). The individual does not report a QCD as gross income, so it can be a tax-advantageous way of contributing to charity (Geisler and Harden 2019). The models indicate that, because QCDs are taxed at a 0 percent rate, they increase the expected ATA and its uncertainty for a traditional IRA contribution.
The analysis also does not consider, for a traditional account, the embedded option to later convert it to a Roth account (Hulse 2003). If the tax rate in a year after contribution but before distribution happens to be low, it may be advantageous to convert a traditional account to a Roth account. The possibility that this might occur increases the expected ATA for a traditional account contribution. It also can decrease the ATA’s uncertainty because the individual would convert only if the tax rate were sufficiently low in such an interim year. That is, an individual would opt to incur a conversion tax only for a portion of the tax rate’s statistical distribution in interim years.
Conclusion
This paper examines tax rate uncertainty with respect to the Roth versus traditional account contribution decision. It shows that the type of account with the higher expected after-tax accumulation generally also has higher uncertainty for it (a Roth account if the tax rate is expected to increase; a traditional account if it is expected to decrease). This means there generally is a tradeoff between these two considerations. If an individual chooses the account type with the higher expected accumulation, they generally must accept higher uncertainty. If an individual chooses the account type with lower uncertainty, they generally must accept a lower expected accumulation. These two considerations’ importance varies among clients, and a financial planner can use this paper’s results to help them decide how to best make this tradeoff.
Citation
Hulse, David S. 2023. “Roth Versus Traditional Account Contributions and Tax Rate Uncertainty.” Journal of Financial Planning 36 (3): 68–76.
Endnotes
- See, e.g., Anderson and Murphy (1998).
- The ATA’s mean and variance are modeled in the next section of the paper.
- A 10 percent penalty generally applies to distributions before the individual attains age 59½. The five year requirement for Roth accounts applies separately for Roth 401(k)s and Roth IRAs (Internal Revenue Code Sections 402A(d)(2)(B) and 408A(d)(2)(B)).
- The analysis assumes that C0 does not exceed the contribution limit (for 2023, $22,500 for a 401(k) account and $6,500 for an IRA, generally).
- The analysis assumes a lump-sum liquidation to better highlight the effect of tax rate uncertainty. If this assumption were relaxed to allow for a series of distributions, the models would be more complex, making it more difficult to see the economic intuition highlighted here. For the same reason, the analysis does not consider required minimum distributions.
- A traditional account distribution can cause additional Social Security benefits to be taxable or increase income-related monthly adjustment amounts for Medicare (Reichenstein and Meyer 2022). One can think of the marginal tax rate as reflecting these consequences, in addition to the tax bracket.
- A variable’s standard deviation is the square root of its variance. The models use variances because an amount that is based on two or more random variables (e.g., Vn and tn) has a variance that is based on those variables’ variances. The other variables in the models (C0 and t0) are assumed to be known with certainty. Note that the models do not specify the distributional forms of Vn and tn. Each of these random variables could have a normal distribution or some other distribution.
- It is acknowledged that specifying mtn and s2tn can be challenging due to tax law uncertainty. These parameters should be viewed in the context of the models’ purpose, which is to validate the results and economic intuition that flow from them. These results and intuition should be valid when one cannot precisely specify mtn and s2tn.
- One might expect Vn and tn to be positively correlated because a higher Vn may bump the individual into a higher tax bracket. The analysis assumes that Vn and tn are uncorrelated because the resulting models are simpler, which better highlights the effect of tax rate uncertainty. If this assumption were relaxed to allow Vn and tn to be correlated, the models for the ATA’s mean and variance for a traditional account would also include terms for this correlation. However, the economic intuition highlighted here would similarly apply in such a more complex analysis.
- Expression (5) can be solved for mtn, but the resulting formula is challenging to interpret.
- For example, the left hand side of Expression (5) is 0.0707 in Example 1 (discussed later), and the right hand side is 0.0064. Expression (5) is not true, consistent with the ATA’s variance being higher for a Roth account in Example 1.
- Another way to understand why the ATA’s variance can be lower with a traditional account is to note that its actual ATA can be expressed as C0Vn – C0Vntn. The variance of this difference is the sum of the two term’s variances minus twice their covariance. There is substantial covariance between the two terms; the tax (C0Vntn) is higher when the amount being taxed (C0Vn) is higher. The net effect of summing the variances and subtracting twice the covariance could be greater or lesser than the ATA’s variance for a Roth account contribution.
- These growths of 1.50, 2.65, and 4.66 have annualized returns over a 20-year period of approximately 2, 5, and 8 percent, respectively.
- Expression (5) is not true for Example 1, consistent with the ATA’s variance being higher for a Roth account in it. See the appendix for supporting calculations.
- Expression (5) is true for Example 2, indicating that the ATA’s variance is higher for a traditional account. See the appendix for supporting calculations.
References
Anderson, Kenneth E., and Daniel P. Murphy. 1998. “Framework for the Roth IRA Decision.” Journal of the American Society of CLU & ChFC 52 (2): 60–71.
Geisler, Greg, and Bill Harden. 2019. “Should Charitable Taxpayers Donate Directly from an IRA or Donate Appreciated Securities?” Journal of Financial Planning 32 (12): 46–56.
Hulse, David S. 2003. “Embedded Options and Tax Decisions: A Reconsideration of the Traditional vs. Roth IRA Decision.” Journal of the American Taxation Association 25 (1): 39–52.
Reichenstein, William. 2007. “Calculating After-Tax Asset Allocation Is Key to Determining Risk, Returns, and Asset Location.” Journal of Financial Planning 20 (7): 44–53.
Reichenstein, William, and William Meyer. 2022. “Social Security Coordination to Create a Tax Efficient Withdrawal Strategy.” Journal of Financial Service Professionals 76 (2): 38–48.