Journal of Financial Planning: July 2023
Executive Summary
- Academics, practitioners, and investors at large typically have a preference for making decisions based on a single variable that is supposed to be maximized or minimized. This approach is usually appropriate, but it may also be misleading.
- When selecting an optimal retirement strategy, a retiree may aim to maximize the coverage ratio, a novel metric superior to the failure rate. This article suggests focusing on the whole distribution of coverage ratios instead, or at least on some percentiles that may be of particular interest to a retiree.
- Although such an approach may not be as neat as making decisions based on optimizing a single variable, it does enable the consideration of the relevant trade-offs a retiree needs to evaluate in order to find an ideal retirement strategy.
- The approach proposed is illustrated by considering the distributions of coverage ratios for several asset allocations and initial withdrawal rates for the United States, as well as for several asset allocations for 21 countries and the world market.
Javier Estrada, Ph.D., is a professor of finance at IESE Business School in Barcelona, Spain. He is also a partner and financial adviser at Sports Global Consulting Investments, an independent financial advisory company that provides wealth management advice to professional athletes and other clients, and he is the sole adviser of the investment strategy of Alpha Investments, a publicly traded mutual fund.
NOTE: Click on the tables below for PDF versions
Acknowledgement: I would like to thank Mark Kritzman and Jack Rader for their comments. Ignacio Talento provided valuable research assistance. The views expressed below and any errors that may remain are entirely my own.
Two critical variables that retirees and their financial planners need to consider when deciding an optimal strategy for the retirement period are the initial withdrawal rate and the portfolio’s asset allocation. The standard methodology to make these choices properly is to first select a target variable that needs to be maximized or minimized, and then to choose the optimal initial withdrawal rate and asset allocation that solve the optimization problem.
Although there is a substantial literature on target variables to be considered, the most typical choice is the failure rate; that is, the proportion of retirement periods in which a strategy failed to sustain a retiree’s planned withdrawals. However, this variable has two major flaws: it neither distinguishes between a failure early or late in a retirement period nor does it account for any bequest left.
In order to overcome both flaws, Estrada and Kritzman (2019) introduced the coverage ratio, which is the number of years of withdrawals supported by a strategy relative to the length of the retirement period considered; this variable does take into account how early or late a strategy fails when it does and the size of the bequest when one is left. They also proposed a utility function that penalizes failures more than it rewards bequests, and suggested that the optimal strategy is the one that maximizes the expected utility of the coverage ratios across all the retirement periods considered.
Although selecting an optimal retirement strategy following the approach proposed by Estrada and Kritzman (2019) clearly improves upon selecting the strategy that minimizes the failure rate, a potential shortcoming is that retirees are typically not familiar with utility functions. Hence, they would not be able to implement the methodology themselves nor would they welcome (or even understand) their financial planners’ explanation of the underlying approach.
A potential solution may be to skip the utility function and simply select the strategy that yields the highest average coverage ratio across all the retirement periods considered, but this alternative may suffer from a typical problem with averages. Just like the individual that drowned crossing a river four feet deep on average, a high average coverage ratio may be hiding many periods in which a strategy failed, which are compensated by a few periods in which the strategy left very large bequests.
The approach proposed in this article, besides avoiding utility functions, also avoids focusing on just one average number. In fact, the suggestion here is to focus on the whole distribution of coverage ratios, or at least on some relevant percentiles of such distribution. Doing so would enable a retiree to carefully consider not just the mean or median coverage ratio but also the coverage ratios that may happen with a low probability, particularly on the left tail of the distribution. Clearly, this approach is not as neat as selecting a strategy that maximizes or minimizes the value of a target variable, but it does enable retirees to consider likely (average) scenarios and unlikely (positive or negative) scenarios, as well as to weigh them according to their individual preferences.
The approach proposed here is illustrated with a discussion of distributions of coverage ratios for all 30-year rolling retirement periods between 1900 and 2019 for 22 markets, and over a longer period for the United States. Furthermore, for retirees or financial planners who still prefer to focus on a single number, a risk-adjusted coverage ratio is introduced, discussed, and reported for each market and asset allocation considered.
The rest of the article is organized as follows. The next section discusses the failure rate, the coverage ratio, their pros and cons, and the approach proposed in this article; the following section discusses the evidence, based on an extensive database of 22 markets over 120 years, and over a longer period for the United States; and the final section provides an assessment. An appendix with tables concludes the article.
The Issue
The Failure Rate and Alternative Metrics
The literature on the evaluation of retirement strategies begins with Bengen’s (1994) seminal article, in which he aims to determine a safe withdrawal rate. He found that withdrawing 4 percent of a portfolio at the beginning of retirement and adjusting all subsequent withdrawals by inflation would be safe in the sense that, historically, it would have never depleted a balanced portfolio of U.S. stocks and bonds before 30 years (which he considered a minimum requirement for portfolio longevity). Bengen’s pioneering article did not only give birth to the widely used 4 percent rule as a withdrawal strategy but also pioneered the failure rate as a metric to evaluate retirement strategies. In addition, it inspired a huge literature on the topic, which expanded Bengen’s scope to other countries, assets, time periods, withdrawal strategies, and evaluation metrics.
The failure rate implicitly used by Bengen (1994) to find a safe withdrawal rate has a neat intuition and is very widely used, but it is also flawed (Milevsky 2016). One of its shortcomings is that it is indifferent between two strategies that fail, say, five years or 25 years into a retirement period; obviously no retiree would be indifferent between those two failures. Another shortcoming is that it is indifferent between two strategies that leave, say, a $1 million or a $10 million bequest; again, no retiree would be indifferent between those two bequests.
These two and other shortcomings of the failure rate led academics and practitioners to propose many alternative metrics to evaluate retirement strategies. Blanchett (2007) proposed the success-to-variability ratio; Frank and Blanchett (2010) proposed the probability of failure; Blanchett, Kowara, and Chen (2012) proposed the sustainable spending rate; Suarez, Suarez, and Walz (2015) and Clare, Seaton, Smith, and Thomas (2017) proposed the perfect withdrawal amount; Estrada (2017, 2018a, 2018b, 2018c) proposed shortfall years, risk-adjusted success, the maximum withdrawal rate, and downside risk-adjusted success; and Estrada and Kritzman (2019) proposed the coverage ratio. The focus of this article is on this last metric.1
The Coverage Ratio
The coverage ratio proposed by Estrada and Kritzman (2019) aims to overcome the two shortcomings of the failure rate highlighted above. Thus, it aims to distinguish, first, between a strategy that fails early and another that fails late into a retirement period; and second, between a strategy that leaves a small bequest and another that leaves a large bequest.2 Formally, let Yt be the number of years of inflation-adjusted withdrawals sustained by a strategy, both during and after the retirement period, and L be the length of the retirement period considered. Then the coverage ratio in retirement period t (Ct) is given by
Ct = Yt/L (1)
By definition, C < 1 indicates that the strategy depleted the portfolio before the end of a retirement period; C > 1 indicates that the strategy sustained withdrawals through an entire retirement period and left a bequest; and C = 1 indicates that the strategy sustained withdrawals exactly through the end of a retirement period and left no bequest.
To illustrate, consider a 30-year retirement period, a $1,000 retirement portfolio, annual inflation-adjusted withdrawals of $40, and three strategies. The first strategy depleted a portfolio in 24 years, the second did so in exactly 30 years, and the third sustained withdrawals for 30 years and left a bequest of $240 (which can support another six years of $40 withdrawals). Then, Yt would be 24, 30, and 36, for the first, second, and third strategies; and Ct would respectively be 0.8, 1.0, and 1.2.
The Distribution of Coverage Ratios
For any given strategy, Estrada and Kritzman (2019) propose to calculate the coverage ratio for each (historical or simulated) retirement period considered, then to calculate the utility of each coverage ratio, and finally to average the resulting utilities thus obtaining an expected (or average) utility value. After doing the same for all the strategies considered, the optimal strategy is that for which the expected utility value is the highest.
Although ultimately not disagreeing with such methodology, this article proposes an alternative approach that does not involve the use of a utility function. The main reason for doing so is that most retirees are unfamiliar with utility functions, thus making it unlikely that they can implement themselves a utility-based approach; or perhaps more importantly, making it unlikely that they welcome or understand an adviser’s explanation of such methodology.
For any given strategy, the approach proposed here consists of first calculating a coverage ratio for each (historical or simulated) retirement period considered, and then focusing on the distribution of coverage ratios. This would enable a retiree or adviser to consider not only the mean or median coverage ratio for each strategy but also some relevant percentiles of the distribution, such as those extreme scenarios that occur with a low (1 percent, 5 percent, or 10 percent) probability, particularly on the left tail of the distribution. The relevant percentiles to focus on and the relative importance given to each would be chosen by a retiree depending on their own preferences, thus indirectly involving their utility function, but without having to specify a functional form. The next section illustrates how the approach proposed could be applied.
Evidence
Data and Methodology
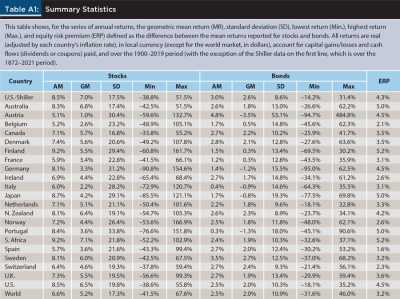
The data used in this article consists of two samples. One is the Dimson-Marsh-Staunton (DMS) database, described in detail in Dimson, Marsh, and Staunton (2002) and in the annual updates of the database documentation. It contains annual stock returns for stocks and government bonds over the 1900–2019 period for 21 countries and the world market. The returns used in this article are real (adjusted by each country’s rate of inflation), in local currency, and account for both capital gains/losses and cash flows paid (dividends or coupons). Real returns for the world market are in dollars and adjusted by the U.S. rate of inflation.
Although the DMS database includes the United States, a somewhat longer perspective for this market can be obtained from the data provided by Robert Shiller on his web page, which covers the 1872–2021 period for both stocks and government bonds.3 The focus here is on real returns that account for capital gains/losses and cash flows paid. Table A1 in the appendix reports some summary statistics for all the series of stock and bond returns in both samples.4
The analysis is based on a portfolio of 1,000 units of local currency at the beginning of retirement, 30-year retirement periods, an initial withdrawal rate of 4 percent (unless otherwise stated), 30 inflation-adjusted withdrawals made at the beginning of each year in retirement, and annual rebalancing to each of the 11 asset allocations considered. If a strategy does not fail, after the last withdrawal at the beginning of the last year in retirement, the portfolio compounds for one more year and its terminal value becomes a bequest.
Focus on the United States
Table 1, based on the Shiller sample, characterizes the distribution of 121 coverage ratios, one for each of the 121 retirement periods beginning with 1872–1901 and ending with 1992–2021, for 11 different allocations to stocks (S) and bonds (100 – S), in all cases based on a 4 percent initial withdrawal rate. Unsurprisingly, the mean and median coverage ratio increase monotonically with the allocation to stocks in the portfolio. This may seem to suggest that a retiree should select a very aggressive (or the most aggressive) asset allocation, but an important insight of the approach proposed here is that such a limited analysis may be misleading.
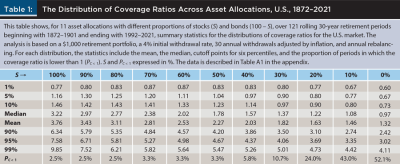
It is conceivable (although clearly not the case in Table 1) that a high mean or median coverage ratio may stem from, say, 49 percent of the retirement periods in which a strategy depleted a portfolio in year three (for a coverage ratio of 0.1 = 3 / 30), and 51 percent of the retirement periods in which a strategy left a bequest equal to 60 years of withdrawals (for a coverage ratio of 3.0 = 90 / 30). Hence the mean and median coverage ratios of 1.6 and 3.0 would be masking what most retirees would consider an unacceptably high failure rate of 49 percent. In other words, the mean or median coverage ratios for a strategy may not be enough, and may even be a misleading way to properly select an ideal retirement strategy; additional information provided by the distribution of coverage ratios should also be considered.
To illustrate, Table 1 shows that, if history is any guide, a portfolio fully invested in stocks has a 1 percent probability of delivering a coverage ratio not higher than 0.77; with the same probability, an 80–20 stock–bond portfolio delivers a higher (0.83) coverage ratio. Similarly, a portfolio fully invested in stocks has a 5 percent probability of delivering a coverage ratio not higher than 1.16; with the same probability, an 80–20 allocation delivers a higher (1.25) coverage ratio. Thus, a retiree who focuses on bad and unlikely scenarios may prefer an 80–20 allocation over a portfolio fully invested in stocks because the former would provide better outcomes in those extreme circumstances.
Furthermore, although it is typically the case that gains and losses of the same size imply asymmetric pain and gain (with the former being roughly twice as large as the latter), the upside potential of different strategies is far from irrelevant; hence a retiree may also consider unlikely but positive scenarios, such as those indicated by coverage ratios in the 90 percent, 95 percent, or 99 percent percentiles on the right tail of the distribution. Importantly, although the failure rate suffers from the flaws already discussed, it is neither irrelevant nor likely to be ignored by retirees. The last line of the table shows the proportion of periods in which the coverage ratio was lower than 1 (PC < 1), which by definition is the same as the failure rate.
Table 1 is designed to determine an ideal asset allocation taking the initial withdrawal rate as given; obviously, a similar analysis could be done by taking an asset allocation as given in order to determine an ideal initial withdrawal rate. To that purpose, Table 2 characterizes the distribution of 121 coverage ratios, one for each of the 121 retirement periods beginning with 1872–1901 and ending with 1992–2021, for nine initial withdrawal rates (IWR) between 2 percent and 6 percent, in all cases based on a 60–40 stock–bond allocation.
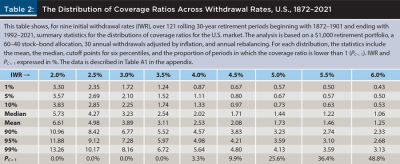
Unsurprisingly, mean and median coverage ratios, as well as cutoff levels for all percentiles, monotonically decrease as the IWR increases. On the contrary, the failure rate shown in the last line of the table is 0 percent for IWRs up to 3.5 percent, turns positive (3.3 percent) for an IWR of 4 percent, and from that point on spikes rather dramatically.5 Furthermore, for IWRs 5 percent or higher, bad and unlikely (1 percent, 5 percent, and 10 percent) scenarios are characterized by fairly low coverage ratios; on the other hand, for IWRs 3.5 percent or lower, even bad and unlikely scenarios are characterized by fairly high coverage ratios.
The section on “Usefulness for Financial Planners” explores further how the approach proposed here can be used by financial planners. But before that discussion, it may be useful to assess how distributions of coverage ratios vary across countries, an issue that is tackled immediately below.
Global Evidence
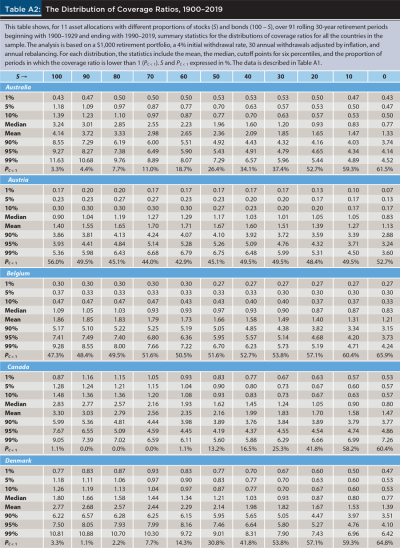
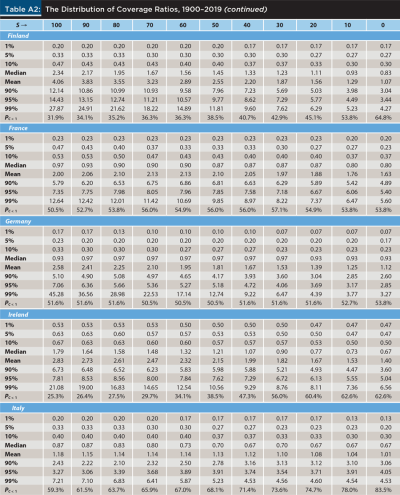
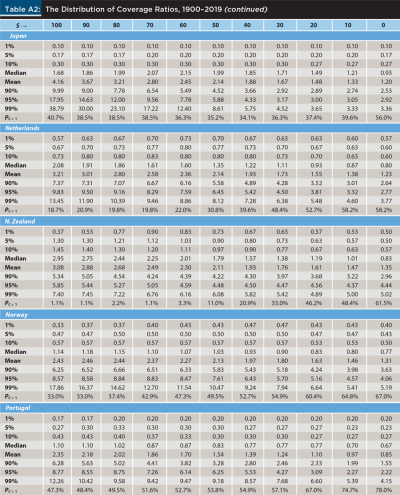
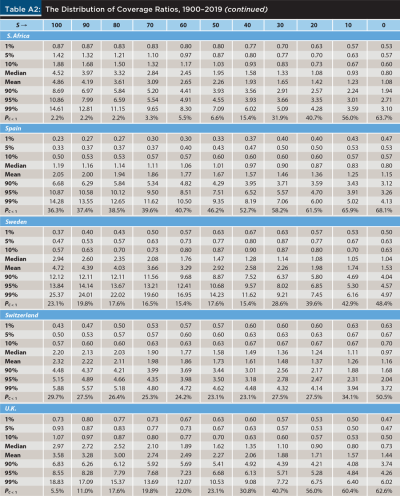
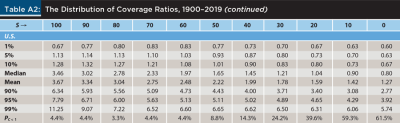
The selection of an ideal asset allocation and initial withdrawal rate depends not only on the preferences of each retiree but also on the evidence considered. Put differently, three retirees with identical preferences may reach very different conclusions about their ideal retirement strategy if they were to consider evidence from Australia, Germany, or Sweden. In order to inform the decisions of retirees and financial planners in different countries, Table A2 in the appendix provides the same information reported in Table 1 but for each of the 21 countries in the sample;6 Table 3 below provides again the same information but for the average country in the sample (Avg.) and for the world market.7
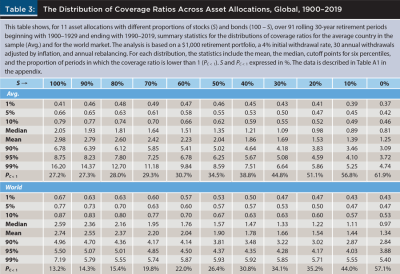
The coverage ratios in Table 3 are, in general, lower than those in Table 1; on the contrary, the failure rates in the former are quite a bit higher than those in the latter. Furthermore, the coverage ratios (failure rates) in the top panel of Table 3 are generally lower (higher) than those in the bottom panel. None of these facts should be surprising given that, first, the long-term performance of stocks and bonds in the United States has been better than that in most of the other countries in the sample; and second, the United States is a far larger market in terms of capitalization than any other market in the sample.
The top panel of Table 3 shows that for the average country in the sample failure rates have been quite high (above 27 percent) for all the asset allocations considered. Much the same but to a lesser degree is the case for the world market (in which the United States has a much larger weight than it has in an equally weighed portfolio), with failure rates above 13 percent for all the asset allocations considered. Furthermore, in both panels the coverage ratios in bad and unlikely (1 percent, 5 percent, and 10 percent) scenarios are all lower than 1, thus implying failed strategies. In short, given that the table is based on an IWR of 4 percent, the evidence suggests that for both the average country in the sample and the world market such IWR may be too high and lower IWRs may need to be considered.
Table A2 shows, rather unsurprisingly, that the performance of the same strategies has delivered a markedly different experience to the retirees of different countries. In particular, whereas retirees in countries such as Australia, Canada, Denmark, New Zealand, South Africa, the U.K., and the United States have had a relatively good experience, those of Austria, Germany, Italy, Japan, and Portugal have had a relatively bad experience.
Usefulness for Financial Planners
The approach proposed here can easily be used by financial planners to advise retirees on how to select an ideal retirement strategy. As previously discussed, focusing just on the mean and median coverage ratio of different strategies is likely to be insufficient and perhaps even misleading. For this reason, planners would help retirees greatly if they discussed other percentiles of the distribution, focusing on those more important to each retiree.
Some retirees may be very risk averse and focus on bad scenarios, however unlikely, in which case planners can discuss the coverage ratios expected with low (say, 1 percent, 5 percent, or 10 percent) probability of the left tail of the distribution. As already mentioned, Table 1 shows that although the highest mean and median coverage ratio are expected for portfolios fully invested in stocks, planners could highlight that in particularly bad scenarios expected to occur with a 1 percent and 5 percent probability, portfolios with 20 percent or even 30 percent in bonds would yield higher coverage ratios.
Furthermore, the fact that all the coverage ratios in Table 2 monotonically decrease (and the failure rate monotonically increases) as the IWR increases does not necessarily imply that retirees should choose a very low (let alone the lowest) IWR. To illustrate, consider a retiree whose overriding goal is to find a strategy that sustains their planned withdrawals during the retirement period, and their secondary goal is leaving a bequest. In that case, a planner should highlight that moving from right to left in Table 2 (that is, decreasing the IWR) would not necessarily make the retiree better off.
In fact, and importantly, a planner may explain that with an IWR of, say, 3.5 percent, the retiree should feel confident enough that the strategy will sustain all their planned withdrawals, and lowering the IWR beyond that point will inflict on them a marginal cost (foregoing a more comfortable retirement) higher than the marginal benefit they obtain (leaving a larger bequest). Put differently, the approach proposed enables planners to incorporate retirees’ preferences in the selection of an ideal strategy, but without having to specify (hence explain) a utility function.
In short, the approach proposed here, although clearly not as neat as selecting the strategy that maximizes or minimizes the value of a target variable, provides retirees and their financial planners with enough information and flexibility to evaluate all the trade-offs they may consider relevant. Furthermore, rather than dealing with utility functions, which most individuals do not know or understand, the methodology advanced here enables planners to discuss with their clients the likely and unlikely scenarios deemed to be more relevant, and to weight them according to their clients’ preferences. Put differently, the approach proposed is consistent with a utility-based approach but does not involve the explicit use of utility functions.
The Risk-Adjusted Coverage Ratio
The approach proposed in this article, based on the distribution of coverage ratios for each of the relevant strategies considered, has several desirable traits: It avoids focusing on just one average figure, which may often be misleading; it considers unlikely scenarios, particularly on the left tail of the distribution; and it makes it possible to weigh different scenarios according to each retiree’s goals and priorities, thus implicitly incorporating preferences. Furthermore, it avoids the use of utility functions, which most retirees are unfamiliar with, and replaces them with coverage ratios in different scenarios that retirees can easily understand and financial planners can easily explain.
That said, perhaps the main drawback of the approach proposed is that it is not as neat as selecting the retirement strategy that maximizes or minimizes the value of a target variable. Put differently, the best strategy in the approach proposed stems from a careful consideration of the relevant trade-offs rather than from the solution of an optimization problem. Retirees and financial planners who prefer the convenience of the latter approach have at least two options, one of which is to follow the methodology proposed by Estrada and Kritzman (2019), thus determining the optimal retirement strategy by maximizing an expected utility function.
Another alternative, suggested here, is to assess the coverage ratios of the retirement strategies considered together with a measure of their risk, thus focusing on a risk-adjusted coverage ratio. Such an approach requires a definition of risk, and a possible (though not necessarily the only) candidate is the standard deviation of the distribution of coverage ratios. Thus, the risk-adjusted coverage ratio of strategy i (RACi) is given by:
RACi = CiM/CiSD (2)
where CiM and CiSD denote the mean and the standard deviation of the distribution of coverage ratios for strategy i.
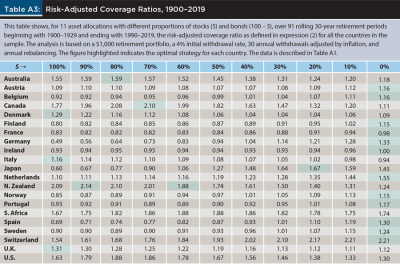
Table 4 reports, for the same 11 asset allocations considered in previous tables, the mean and standard deviation of the distributions of coverage ratios, and the risk-adjusted coverage ratio as defined in (2), for the U.S. market based on the Shiller data, as well as for the average country in the sample (Avg.) and the world market, both based on the DMS data; Table A3 in the appendix does the same for the rest of the countries in the sample. In both tables, the figures highlighted indicate the optimal strategy (asset allocation) based on maximizing the risk-adjusted coverage ratio.
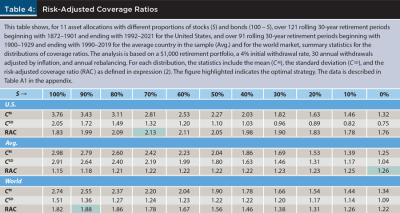
Unlike the analysis based on Tables 1–3, which may lead different retirees considering the same evidence to select different retirement strategies, Table 4 shows an optimal strategy for each of the three cases considered. More precisely, for the United States, for the average country in the sample, and for the world market, the optimal stock–bond allocations respectively are 70–30, (perhaps surprisingly) 0–100, and 90–10. Table A3 shows (perhaps unsurprisingly) that the optimal strategy varies widely across countries.
To be sure, as is always the case with risk-adjusted metrics, these are optimal choices as long as a retiree’s view of risk is consistent with the definition of risk built into the metric considered. In other words, in the same way that most risk-adjusted return metrics have an objective part (return) and a subjective part (risk), the risk-adjusted coverage ratio also has an objective component (the coverage ratio) and a subjective component (its risk). For this reason, a retiree’s choice of an optimal retirement strategy is bound to be dependent on the way they view and assess the risk of the strategies considered.
Shortcomings and Further Discussion
It is hopefully clear by now that the approach proposed here has several advantages over an approach that deals with utility functions, and even more advantages over the simplistic approach of selecting the strategy that minimizes the failure rate. That said, no approach is free from shortcomings, including the one advanced in this article.
First, all the figures discussed ignore the impact of taxes; needless to say, that is something a planner simply cannot do. The usual justification, common to the vast majority of the literature on retirement planning, is that taxes are very different across individuals, and even more so across countries. In other words, taxes may unnecessarily complicate the discussion when introducing a new metric or methodology, as is usually done in the literature, but of course they are critical for planners when discussing the ideal retirement strategy of a given individual.
Similarly, as is the case in the vast majority of the literature on retirement planning, the discussion here ignores the impact of transaction costs. Given that the strategies discussed incorporate annual rebalancing (hence very little trading), and that such rebalancing frequency is the same for all the strategies considered, this omission is clearly less important than the omission of taxes.
Third, note that the cross-country analysis implicitly assumes that a retiree in any given country invested only in the stocks and bonds of that country. Obviously, this does not have to be, and ideally should not be, the case. Diversification across countries, even at the global level, has become very easy and very cheap to implement; hence retirees, and investors in general, should perhaps pay more attention to the aggregate figures discussed in Table 3 than to the figures of each individual country discussed in Table A2.
Fourth, the risk-adjusted coverage ratio introduced considers the standard deviation of the distribution of coverage ratios as the proper measure of risk. As is always the case when assessing risk, other measures of risk could have been used. To illustrate, retirees who choose allocations heavily tilted toward stocks would typically have to bear more volatility during their retirement than those who choose allocations heavily tilted toward bonds. The volatility of a portfolio during the retirement period could be a plausible alternative to adjust average coverage ratios by risk.
Fifth, all the distributions of coverage ratios reported and discussed stem from historical data, thus being restricted to what Paul Samuelson would call the one sample of history we have. An alternative (and clearly complementary) approach would have been to create a large number of scenarios with Monte Carlo simulations and discuss the aggregate results.
Finally, although the failure rate is well known and widely used, however flawed it may be, the coverage ratio is currently neither. This new metric introduced by Estrada and Kritzman (2019) is in an incipient stage, and some planners may hesitate to adopt it. That said, its advantages over the failure rate are clear, and perhaps planners would be wise to incorporate it at least as another metric in their toolkit.
Assessment
The importance of selecting a good, and ultimately optimal, retirement strategy can hardly be overstated; a retiree’s ability to enjoy the lifestyle planned for retirement, and to leave a bequest if so desired, critically depend on this choice. Making this decision by minimizing the failure rate is both typical and flawed; the alternative proposed by Estrada and Kritzman (2019), making this choice by maximizing the expected utility of coverage ratios, is clearly superior. And yet that would imply the use of utility functions, which retirees are unlikely to be familiar with; hence they would not be able to implement the methodology themselves nor would they welcome or understand their financial planners’ explanation of the underlying approach.
The alternative proposed in this article is to avoid the use of utility functions and focus on the distribution of coverage ratios instead. More precisely, for each strategy contemplated, the recommendation here is to first calculate a coverage ratio for each (historical or simulated) retirement period considered, and then focus on the distribution of those coverage ratios. This approach enables retirees to focus on likely and unlikely scenarios; to determine which of the latter are particularly important to them; and to weigh all scenarios according to their goals and priorities, thus involving their individual preferences in the final choice.
Granted, the methodology proposed here is not as neat as determining an optimal retirement strategy by maximizing or minimizing the value of a target variable. And yet the approach has several desirable traits, such as avoiding the focus on a single average figure; considering unlikely scenarios, particularly on the left tail of the distribution; weighing likely and unlikely scenarios according to each retiree’s individual preferences; and sidestepping the use of utility functions, but ultimately being consistent with a utility-based approach.
The methodology proposed was illustrated with the selection of retirement strategies (asset allocations and initial withdrawal rates) for the U.S. market. By design, the analysis did not determine an optimal asset allocation or initial withdrawal rate; rather, it presented information and discussed some of the relevant trade-offs a retiree would need to evaluate or a planner would need to highlight. Similar information was also reported for the distribution of coverage ratios in 22 markets, which may be useful to retirees and financial planners when selecting an ideal retirement strategy in those countries. As was the case with the United States, and again by design, no single optimal strategy for each market was determined.
For retirees or financial planners who prefer a neater approach, an alternative methodology (that still avoids the use of utility functions) was suggested, which involves the mean and standard deviation of the distribution of coverage ratios combined into a new metric, the risk-adjusted coverage ratio. Maximizing the value of this metric does enable retirees or their financial planners to select a single optimal retirement strategy, which was highlighted for all the markets in the sample.
In short, the importance of selecting an ideal retirement strategy can hardly be overstated. Many approaches have been suggested in the past, and many others will most likely be suggested in the future. The approach proposed in this article has many desirable traits, including the fact that it is easy for retirees to understand and for financial planners to explain, and will hopefully help both when making or advising on such a critical decision for such an important period of life.
Citation
Estrada, Javier. 2023. “Retirement Planning—Is One Number Enough?” Journal of Financial Planning
36 (7): 64–81.
Endnotes
- See also Estrada (2021) on how to evaluate the sustainability of retirement strategies.
- A word of caution: The term coverage ratio is also used in a very different context, to assess a company’s ability to service its debt. The ratio between some definition of earnings (typically, but not exclusively, earnings before interest and taxes) and the interest expense (which may or may not include the repayment of principal) is usually referred to as coverage ratio, debt service coverage ratio, or interest coverage. That debt-related definition has nothing to do with Estrada and Kritzman’s (2019) definition.
- See www.econ.yale.edu/~shiller/data.htm.
- As already mentioned, the DMS sample also includes the United States, but it does so over a shorter time period and with somewhat different data than does the Shiller sample.
- Incidentally, this table seems to validate Bengen’s (1994) suggestion that IWRs higher than 4 percent are not safe in the sense that they result in high failure rates.
- As already mentioned, the United States is also included in this sample but in this case over a shorter (1900–2021) period and with the DMS (rather than with the Shiller) data.
- The difference between them is that the former (Avg.) gives equal weight to the 21 countries in the sample whereas the latter (World) weighs them by market capitalization.
- Once again, the results in the appendix include the United States but over a shorter (1900–2021) period and with the DMS (rather than with the Shiller) data.
References
Bengen, William. 1994. “Determining Withdrawal Rates Using Historical Data.” Journal of Financial Planning 7 (4): 171–180.
Blanchett, David. 2007. “Dynamic Allocation Strategies for Distribution Portfolios: Determining the Optimal Distribution Glide Path.” Journal of Financial Planning 20 (12): 68–81.
Blanchett, David, Maciej Kowara, and Peng Chen. 2012. “Optimal Withdrawal Strategy for Retirement Income Portfolios.” Retirement Management Journal 2 (3): 7–20.
Clare, Andrew, James Seaton, Peter Smith, and Stephen Thomas. 2017. “Reducing Sequence Risk Using Trend Following and the CAPE Ratio.” Financial Analysts Journal 73 (4): 91–103.
Dimson, Elroy, Paul Marsh, and Mike Staunton. 2002. Triumph of the Optimists—101 Years of Investment Returns. Princeton University Press.
Estrada, Javier. 2017. “Refining the Failure Rate.” Journal of Retirement 4 (3): 63–76.
Estrada, Javier. 2018a. “From Failure to Success: Replacing the Failure Rate.” Journal of Wealth Management 20 (4): 9–21.
Estrada, Javier. 2018b. “Maximum Withdrawal Rates: An Empirical and Global Perspective.” Journal of Retirement 5 (3): 57–71.
Estrada, Javier. 2018c. “Replacing the Failure Rate: A Downside Risk Perspective.” Journal of Retirement 5 (4): 46–56.
Estrada, Javier. 2021. “The Sustainability of (Global) Withdrawal Strategies.” Journal of Financial Planning 34 (11): 82–98.
Estrada, Javier, and Mark Kritzman. 2019. “Toward Determining the Optimal Investment Strategy for Retirement.” Journal of Retirement 7 (1): 35–42.
Frank, Larry, and David Blanchett. 2010. “The Dynamic Implications of Sequence Risk on a Distribution Portfolio.” Journal of Financial Planning 23 (6): 52–61.
Milevsky, Moshe. 2016. “It’s Time to Retire Ruin (Probabilities).” Financial Analysts Journal 72 (2): 8–12.
Suarez, Dante, Antonio Suarez, and Daniel Walz. 2015. “The Perfect Withdrawal Amount: A Methodology for Creating Retirement Account Distribution Strategies.” Financial Services Review 24 (4): 331–357.