Journal of Financial Planning; October 2014
Charlene M. Kalenkoski, Ph.D., is an associate professor in the Department of Personal Financial Planning at Texas Tech University. She received her Ph.D. in economics from the George Washington University in 2002.
Eakamon Oumtrakool is a Ph.D. candidate in the Department of Personal Financial Planning at Texas Tech University. He earned a Master of Science in finance from West Texas A&M University. His research interests include consumer behavior, investment, and retirement planning.
Executive Summary
- Knowing how retirees spend their time informs decisions about how much income they will need in retirement. This study examines the top 20 activities of middle- and high-income retirees.
- Results suggest that individuals spend more time on inexpensive leisure activities in retirement, such as watching television and reading for personal interest.
- Findings also indicate individuals spend more time on household production activities in retirement, such as preparing meals at home, than non-retirees.
- The allocation of time varies by demographic characteristics. As such, financial planners should ask their clients about leisure and household production activities when discussing retirement plans with their clients as a way to account for differences in time allocation.
Financial planners help their clients maximize expected lifetime utility, which is defined as a client’s happiness or satisfaction. Standard household economic theory (Becker 1965) posits that individuals consume and derive utility from household produced commodities such as meals, a clean house, and a nice garden. These commodities are produced with goods and services but also with time. Production of a household commodity can be “goods intensive.” That is, it can utilize more goods and services than time, or “time intensive,” utilizing more time than goods and services. Because individuals are consuming commodities rather than goods and services directly, financial planners must consider individuals’ time use, as well as their purchases of goods and services, upon retirement.
In addition, because retirees have more available time than non-retirees, they may shift toward more time-intensive production of commodities and away from goods-intensive production (Hurd and Rohwedder 2003; Ward-Batts 2008). Thus, retirees may spend less and require less income than one might think based only on how much they consumed in goods and services before retirement. Therefore, it is important for a financial planner to understand how retirees spend their time. The primary objective of this study was to compare the time use of retirees and workers so that planners can use this information to plan for their clients’ retirement.
This study used data from the U.S. Bureau of Labor Statistics’ 2010–2012 American Time Use Surveys (ATUS) to examine the time allocation of middle- and high-income retirees. The ATUS is a nationally representative data set of Americans 15 years of age and older. The ATUS primarily consists of a 24-hour time diary completed by each respondent, together with a trained telephone interviewer, that covers the 24-hour period starting at 4 a.m. on the day prior to the interview and ending at 4 a.m. on the day of the interview. Interviewers take respondents through their day, asking about all activities that they completed, the order in which they completed them, and the beginning and ending times of all activities. The ATUS data provide a complete picture of each respondent’s diary day. Although each respondent completed a diary for only one day, diaries were completed by respondents for almost every day of the year in order to make the data representative of all days.
In addition to providing the time diary data, respondents self-reported their age and labor force status. Information about each respondent’s age, race, ethnicity, completed education level, and family income also was provided with the ATUS data but came from respondents’ prior recent participation in the Current Population Survey, a survey conducted for the U.S. Bureau of Labor Statistics by the U.S. Census Bureau.
Survey weights provided with the ATUS data were used in this study to ensure that the findings would be generalizable to the U.S. population. Therefore, the results of this study can be generalized to current retirees and those nearing retirement in the United States. However, they may not be generalizable to retirees in the distant future because of changes in health, technology, and culture over long periods.
In this study, retirees were defined to be individuals aged 50 and older who reported that they were not in the labor force (not employed and not looking for work) or that they were retired. A small number of self-identified non-workers reported some time working, engaging in work-related activities, or engaging in work-related travel on their diary days. These individuals were counted as full- or part-time workers rather than as retirees to ensure a truly non-working sample of retirees. Because the purpose of this paper was to compare retirees with workers, non-working individuals under age 50 were excluded from the analyses.1
Low-income individuals are not likely to seek and pay for financial advice; therefore, low-income individuals were not included in this study. According to Finke, Huston, and Winchester (2011), individuals with at least $500,000 in financial assets are significantly more likely to purchase financial advice than those with a lower amount of financial assets. Information on financial assets was not available in the ATUS, but it does include information about income. According to the 2010 Health and Retirement Study (HRS), the median household income of retirees with net financial assets of at least $500,000 was $62,332. Therefore, the individuals included in this study were those who reported at least $60,000 in household income.2
Time Use of Retirees vs. Workers
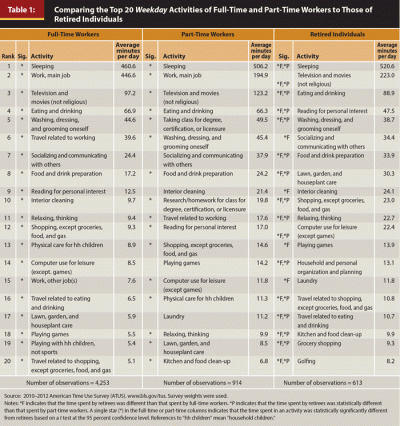
Table 1 compares the average daily minutes that full-time workers, part-time workers, and retirees spent on their top 20 daily activities on weekdays over the period 2010–2012. An activity rank of 1 indicates that the most time was spent on this activity; an activity rank of 2 indicates that the next-largest amount of time was spent on this activity; the same coding explains the top 20 activities. Beyond the top 20, very little time was spent in individual activities.

As shown in Table 1, sleeping was everyone’s top activity, but retired individuals slept more than full-time and part-time workers on weekdays (521 minutes compared to 461 and 506 minutes, respectively). Working took the next largest amount of time for full-time and part-time workers. By definition, retirees were doing no work, so this activity did not make the top 20 list of retirees’ activities. This also was true for travel related to work. On average, full-time workers worked 447 minutes and part-time workers worked 195 minutes. They also engaged in 40 minutes and 18 minutes of work-related travel, respectively.
Related to market work, part-time workers also spent 50 minutes taking a class for a degree, certification, or licensure and 20 minutes on related research and homework. These education-related activities did not appear in the top 20 lists of full-time workers or retirees. However, even if this educational “work” were added to market work, part-time workers were still working less in total than full-time workers. Sticking to the traditional definition of market work, it appears that as work time decreased, individuals used some of this additional time for sleeping. Another personal care activity that increased was eating and drinking. Retirees spent more time eating and drinking (89 minutes) than full-time and part-time workers (67 and 66 minutes, respectively). However, retirees spent slightly less time washing, dressing, and grooming themselves (39 minutes) than full-time and part-time workers (45 minutes).
Retired individuals also spent more time in inexpensive leisure activities than workers. Retired individuals spent 223 minutes watching television and movies, which was more than the 97 minutes and 123 minutes spent by full-time and part-time workers, respectively.3 It appears that as work time decreased, individuals were using some of this time watching television and movies. They also spent more time reading for personal interest (48 minutes) compared to 13 minutes for full-time workers and 17 minutes for part-time workers. Retirees spent more time relaxing and thinking (23 minutes) than full-time workers who spent 9 minutes and part-time workers who spent 10 minutes. Retirees also spent more time using the computer for leisure (22 minutes) versus 9 minutes for full-time workers and 12 minutes for part-time workers. Thus, it appears that retirees were using some of the time freed up by not working to engage in inexpensive leisure activities.
Retirees also were spending more time in expensive leisure activities such as non-grocery shopping. They spent 23 minutes doing this activity, compared to 9 minutes for full-time workers and 15 minutes for part-time workers. Another expensive leisure activity in which retirees engaged was golfing, at an average of 8 minutes. This activity did not make the top 20 list of activities for either full-time or part-time workers.
As household production theory suggests, retirees also were spending more time in household production than workers, turning to more time-intensive (and less goods-intensive) production of household commodities. As work time decreased, time spent in food and drink preparation increased, with retired individuals spending 34 minutes per day on this activity on average, compared to 17 minutes by full-time workers and 24 minutes by part-time workers. Similarly, as work time decreased, lawn, garden, and houseplant care increased. Retirees spent more than 30 minutes on average on these activities, compared to 6 minutes for full-time workers and 9 minutes for part-time workers.
Another big household production activity for retirees was interior cleaning, with retirees spending 24 minutes on this activity on average. Full-time workers spent only 10 minutes on this activity while part-time workers spent 21 minutes. In addition, retirees spent 13 minutes on household and personal organization and planning; this activity did not even enter the top 20 lists of the full-time or part-time workers. Similarly, retirees spent 12 minutes on laundry compared to 11 minutes by part-time workers; laundry did not enter the top 20 list of full-time workers. Retirees spent 10 minutes on kitchen and food cleanup compared to 7 minutes for part-time workers. This activity did not make the top 20 list of full-time workers. Finally, retirees spent 9 minutes on grocery shopping; this activity did not make the lists of either full- or part-time workers.
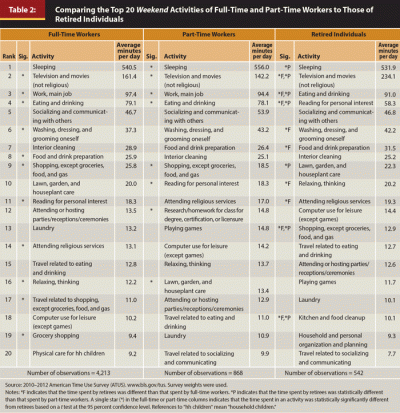
Table 2 compares the activities of retirees and full-time and part-time workers on weekends. There were slightly fewer statistically significant differences primarily because workers should have had, on average, more time for non-work activities on the weekend. However, full-time workers still spent 97 minutes doing work, while part-time workers spent 94 minutes completing work during weekends. Sleeping was still the No. 1 activity on weekends, but the differences in time spent sleeping among the groups were different from those on weekdays. On weekends, full-time workers spent the same amount of time sleeping as retirees, but part-time workers slept more. Similar to weekdays, retired individuals spent more time eating and drinking, on average, than either group of workers.

Regarding inexpensive leisure activities on the weekend, retirees spent more time watching television and movies than either full-time or part-time workers. On weekends, retirees spent more time than workers of either type reading for personal interest, and relaxing and thinking. Thus, retirees spent more time on inexpensive leisure activities on the weekend, compared to weekdays, than workers.
In relation to expensive leisure activities on the weekend, however, both full-time and part-time workers spent more time engaging in non-grocery shopping, which was the opposite of what occurred on weekdays. Unlike weekdays, golf did not make the top 20 list of weekend activities for retirees. Retirees were not spending more time than workers on expensive leisure on the weekends.
Regarding household production activities, retirees still spent more time in food and drink preparation than full-time workers on the weekends. Time spent on lawn, garden, and houseplant care, and time spent on kitchen and food cleanup, also remained higher for retirees than for part-time workers on the weekends. In summary, similar to weekdays, retirees still spent more time performing household production activities than workers on the weekends.
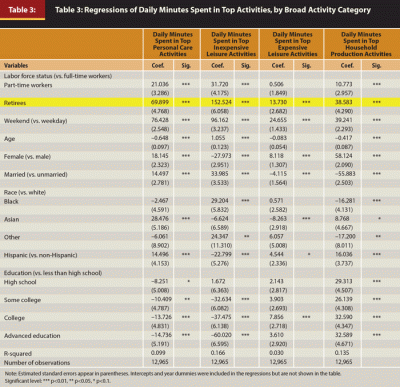
Table 3 shows the results of continuous regressions of daily minutes spent performing personal care, inexpensive leisure, expensive leisure, and household production activities on indicators for part-time worker and retiree labor force status (versus full-time worker status) and indicators for various demographic characteristics.

Personal care activities included sleeping, washing, dressing, grooming oneself, eating and drinking, and travel related to eating and drinking.
Inexpensive leisure activities included socializing and communicating with others, relaxing or thinking, watching television and movies, playing games, computer use for leisure (except games), reading for personal interest, attending religious services, and travel related to socializing and communicating.
Expensive leisure activities included non-grocery shopping, attending or hosting parties/receptions/ceremonies, golfing, and travel related to non-grocery shopping.
Household production activities included interior cleaning, laundry, food and drink preparation, kitchen and food cleanup, lawn, garden, and houseplant care, household and personal organization and planning, physical care for household children, playing with household children except for sports, and grocery shopping.
The highlighted row in Table 3 shows the associations between retirement status and daily minutes spent in personal care, inexpensive leisure, expensive leisure, and household production controlling for demographic characteristics, weekday/weekend status, and diary year. Conditional on all these variables, retirees spent 70 minutes more performing personal care activities, 153 minutes more on inexpensive leisure activities, 14 minutes more engaging in expensive leisure activities, and 39 minutes more on household production activities than full-time workers. Similar, but smaller associations, were noted for part-time workers versus full-time workers.
Table 3 also shows the associations of the other factors with time spent in each of the broad activity categories. More time was spent in all four broad, non-work activity categories on weekends than on weekdays. Older individuals spent less time on personal care and household production and more time doing inexpensive leisure activities than younger individuals. Females spent more time engaging in personal care, expensive leisure activities, and household production activities and less time on inexpensive leisure activities than males. Married individuals spent more time carrying out personal care and inexpensive leisure activities and less time engaging in expensive leisure and household production activities than unmarried individuals. More educated individuals spent less time on personal care and inexpensive leisure activities and more time doing expensive leisure activities and household production than less educated individuals.
Finally, there were differences by race and ethnicity that should be considered. Asians were more likely to report performing personal care activities than whites. Hispanics were more likely to report performing personal care activities than non-Hispanics. Blacks and individuals identifying themselves as “other race” spent more time doing inexpensive leisure activities than whites. Hispanics spent less time on inexpensive leisurely pursuits and more time on expensive leisure activities than non-Hispanics. Asians spent less time engaging in expensive leisure activities than whites. Blacks and those identifying themselves as “other race” were less likely to spend time performing household production activities than whites, while Asians spent more time. Hispanics spent more time on household production activities than non-Hispanics.
How Findings Relate to the Practice of Financial Planning
This study compared the top 20 activities of retirees to those of non-retirees in order to determine how time use changes with retirement. The results show that retirees spent more time engaging in inexpensive leisure activities such as watching television and movies, reading for pleasure, and relaxing and thinking. Findings also show that retirees spent more time engaging in household production activities than workers. These results suggest that financial planners should ask their clients how they plan to spend their time in retirement, focusing their discussions on their clients’ expected leisure and household production pursuits. These discussions will help inform decisions about the level of income that clients will need in retirement.
Endnotes
- Regressions comparable to those in Table 3 were run that included non-workers under 50. These workers were identified with a dummy variable. This did not change the results for retirees, so these results are not presented.
- Household income information in the ATUS is categorical in nature; $60,000 was the closest to $62,332 that was possible.
- The ATUS separately classifies television and movies (not religious) from religious television and movies. Time spent in the separate category of religious television and movie watching was quite small (less than one minute, on average) and did not make any group’s top 20 list. Therefore, the television and movie watching reported here includes only non-religious viewing.
References
Becker, Gary S. 1965. “A Theory of the Allocation of Time.” The Economic Journal 75 (299): 493–517.
Finke, Michael S., Sandra J. Huston, and Danielle D. Winchester. 2011. “Financial Advice: Who Pays.” Journal of Financial Counseling and Planning 22 (1): 18–26.
Hurd, Michael, and Susann Rohwedder. 2003. “The Retirement-Consumption Puzzle: Anticipated and Actual Declines in Spending at Retirement.” NBER Working Paper No. 9586.
Ward-Batts, Jennifer. 2008. “Household Production and Consumption Before Versus After Retirement: Evidence from Time Diary Data.” In How Do We Spend Our Time? Evidence from the American Time Use Survey, edited by Jean Kimmel, 81–105. Kalamazoo, MI: W.E. Upjohn Institute for Employment Research.
Citation
Kalenkoski, Charlene, and Eakamon Oumtrakool. 2014. “How Retirees Spend Their Time: Helping Clients Set Realistic Income Goals.” Journal of Financial Planning 27 (10) 48–53.