Journal of Financial Planning: September 2018
James Farrell, Ph.D., CFA, is an associate professor of finance and economics at Florida Southern College. His prior work included positions as a senior quantitative analyst with the Florida State Board of Administration and in the brokerage industry for Merrill Lynch and TD Waterhouse. His research interests include behavioral investing, pension and labor studies, and regional economics.
Executive Summary
- This paper revisits the question of whether it is better for homebuyers to finance their home purchase with a 30-year mortgage, or 15-year mortgage with the excess cash going into a portfolio.
- The simulation analysis found that given current market conditions and adjustments for risk, it is favorable to choose the 15-year mortgage.
- This choice is further strengthened when considering additional refinancing options at the expiration of the 15-year mortgage as well as a simulation to mimic the typical movement of homeowners, with the repeated 15-year mortgage strategy again topping the 30-year mortgage strategy.
- The conclusions drawn from this analysis can be used by financial planners at all levels to advise clients on a strategy to build wealth by managing the leverage on a home to generate investible assets.
When purchasing a home, 88 percent of homebuyers in the U.S. finance the purchase with a mortgage, according to the National Association of Realtors.1 The choice on which loan is best for each buyer may be determined by a variety of factors, such as affordability, expected length of time in the home, expectations about future interest rates, and risk preferences.
Given the 33.1 percent of expenditures spent on housing among homeowners with mortgages, according to the Bureau of Labor Statistics2, mortgage choice matters for the long-run wealth of homebuyers. Currently, the most common mortgage is the 30-year fixed rate mortgage (FRM) (Becketti 2017); but could there be potential gains from using the less-common 15-year FRM?
Prior research found that the 30-year mortgage is often better given a 30-year investment horizon, however this analysis found the opposite was true. This paper deviated from the prior work on investment horizon and strategy.
Prior studies (Vruwink and Fisher 1995; Goff and Cox 1998; Aulerich 2004; Basciano, Grayson, and Walton 2006) found significant benefit from taking the 30-year mortgage when the investment horizon was 30 years, 15-year mortgage holders contributed to the investment portfolio after their mortgage was paid off, and mortgage interest was fully tax deductible at a variety of rates. This paper revisited the comparison between those two options, but also considered that most homebuyers do not remain in their homes with the same mortgage for the full 30 years (Emrath 2013). This paper also used updated market returns that included the less-favorable returns of the housing collapse, and it accounted for recent changes in tax laws.
Related literature addressed the trade-off between prepaying the mortgage and making investments in tax-deferred accounts to generate tax arbitrage (Amromin, Huang, and Sialm 2007). This issue was not directly addressed in this paper, however, Amromin et al.’s findings—which suggested that many households could benefit from not prepaying their mortgage and instead investing those assets in tax-deferred accounts—would likely be diminished by the same factors that diminished the prior literature’s findings, namely the lower market returns and changes in tax policy.
When considering the issue of strictly paying off a mortgage or keeping assets in investments, Michelangeli (2012) found conditions where keeping the mortgage was beneficial, due to liquidity risk and the potential for adverse shocks, when homeowners had relatively low non-housing wealth.
A New Approach
Most homebuyers do not remain in their homes for 30 years; half typically move by year 15 (Emrath 2013). Because previous analyses on the less-common case of buyers remaining in their homes for 30 years generally did not consider the financial results to the majority of homebuyers who move in the interim, the literature is incomplete.
This research found that when considering homebuyer wealth at intermediate time periods, using a 15-year mortgage is more beneficial, on average. Findings indicated that there was no mortgage duration between one and 15 years where a homebuyer would have been more likely to be financially better off with the 30-year mortgage than the 15-year mortgage.
This paper then simulated an alternative investment strategy to match the 30-year investment horizon, where homebuyers took two consecutive 15-year mortgages as opposed to a 30-year mortgage. The advantage found with 30-year mortgages in prior literature was built upon three characteristics.
First, there was greater use of leverage when a 30-year mortgage was taken out, particularly in the latter 15 years where a 15-year mortgage holder had completely de-levered. The simulation model here addressed this by allowing 15-year mortgage holders to remortgage their house at the termination of their first mortgage, borrowing an amount equal to the then-current balance of the 30-year mortgage, and begin repaying the mortgage again. The proceeds plus or minus any difference in payment were then invested in an investment portfolio for the balance of the 30-year horizon. This allowed for greater comparability of investment options given the more similar use of leverage while ensuring that the 15-year mortgage holder was not more levered. This did, however, introduce interest rate risk to the borrower. While existing literature expressed concern with the risk of equity extraction in contributing to defaults (Laufer 2017), the equity extraction was used in this model so that the 15-year strategy never had a higher mortgage balance than the 30-year mortgage.
The second important characteristic was the investment period chosen. In Aulerich (2004), the investment period was the relatively robust period of September 1991 through March 2002, one which was followed by a challenging period. The return on the S&P 500 was 10.8 percent from September 1991 to March 2002; it falls to 7.2 percent once April 2002 to December 2016 is included. Prior literature on the topic typically used the more robust investment returns in their simulations. Given the meaningful change in market conditions over the past 15 years, it seemed worthwhile to revisit this exercise. Comparing simulation results using both sets of assumptions on market performance helped parse out if the difference in outcomes was more a function of asset returns or simulation design/mortgage strategy.
The third characteristic was the tax treatment. Prior research emphasized the importance of the tax deductibility of mortgage interest along with tax sheltering of investment gains. Based on 2009 data, 22 percent of tax returns had a claim for the mortgage interest deduction (Stansel and Randazzo 2011). With recent changes per the Tax Cuts and Jobs Act, fewer homeowners will benefit from the tax deductibility of mortgage interest, let alone receive full deductibility. An analysis by Zillow3 suggested that the percentage of homes, if newly purchased, that would benefit from itemized deductions instead of the homeowner taking the updated standard deduction would fall from 44 percent to 14.4 percent under the new tax laws. The tax advantages afforded to the 30-year mortgage strategy are unlikely to persist for many borrowers.
Data and Summary Statistics
To study the viability of using investable income toward a 15-year mortgage, this paper collected historical monthly mortgage rates for 30-year and 15-year mortgages from the Freddie Mac Survey,4 along with monthly returns on the S&P 500 and 10-year Treasury Note from September 1991 through December 2016. This paper then examined the outcomes from using a 15-year mortgage compared to a 30-year mortgage along with an investment account, on a $100,000 mortgage taken out each month through December 2015.
The 30-year mortgage rate was higher, on average, than the 15-year rate by 0.54 percent, with a range of 0.25 percent and 0.98 percent. Also, the S&P 500 returned a higher rate than the 10-year Treasury Bond (0.67 percent and 0.37 percent monthly, respectively), albeit, with greater standard deviation (4.13 percent and 0.14 percent, respectively).
Additional calculations show that the mortgage rates moved together, with a correlation of 0.998. The spread and the spread as a percentage of the 30-year rate were negatively correlated (–0.71 and –0.88, respectively) with the 30-year rate.
Calculations of Mortgage and Portfolio Balances
To evaluate, from a historical perspective, whether investing in a 15-year mortgage would have been worthwhile during the 15-year investment horizon, standard time value of money calculations were used to determine the required monthly payment (principal and interest only) of a $100,000 mortgage for each of the starting periods5 and initial mortgage duration, as shown in Equation 1.
Where:
PV is the initial mortgage balance,
r is the monthly interest rate on the mortgage,
nM is the number of periods for the mortgage, and
PMT is the resulting fixed payment of principal and interest for mortgage type M (15-year or 30-year) starting in period t. The balance of each mortgage was then calculated as shown in Equation 2:
Where:
Bal is the balance of either the 15-year or 30-year mortgage, which initiated at time t, at period N, where N is the length of time since the mortgage was initiated.
The difference between those balances of the 30-year and 15-year mortgages is the gross value (GV) of the investment in the 15-year mortgage, as shown in Equation 3.
The tax benefit (TB) due to the mortgage interest deduction is found with Equation 4:
Where:
Int is the interest from the mortgage initiated in period t, currently in period I, and MTR is the marginal tax rate, assumed to be fixed over the duration of the investment horizon.
The investment in the mortgage was calculated as the difference in the monthly payment between the 15-year mortgage and the 30-year mortgage. To determine the opportunity cost of such an investment, this paper calculated the annual balance of an account where the excess monthly payment (EP) was invested in a portfolio of risky (S&P 500) and risk-free (10-year Treasury) assets with allocations ranging from 100 percent risky to 0 percent risky at 20 percent intervals. Given that these were fixed-rate mortgages, EP varied with the period t but not N, as shown in Equation 5.
The value of the investment portfolio (VIP) at time N for a mortgage initiated at period t with an equity allocation of A was then found by Equation 6:
Where:
r is the return of the portfolio in period t given the investment allocation, A.
The returns were calculated as a weighted average of the monthly returns from the previously specified indices, with allocation weights of either 100 percent, 80 percent, 60 percent, 40 percent, 20 percent, or 0 percent equity.
The difference between the value of the 15-year mortgage and the portfolio at each annual interval is the net value of the 15-year mortgage (NV), using Equation 7:
Historical Analysis
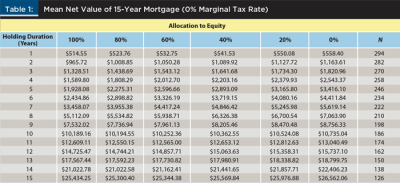
As can be seen from Table 1, the mean value of investing in a 15-year mortgage rather than a portfolio of various combinations of risky and risk-free assets grew steadily over time. The higher equity allocation led to lower relative performance for the 15-year mortgage investment; however, the 15-year mortgage remained a standout investment.
Although the mean return for each duration was positive, not all observations within each year were positive. Table 2 shows the percentage of observations for which the 15-year mortgage investment had a positive net value, compared to the portfolio. These calculations show that at low levels of equity investment (20 percent and 0 percent), given the initial assumptions regarding taxation, investing the excess payment never paid off at any holding duration. It is only with larger equity positions that the portfolio beat the 15-year mortgage in some observations. The best the portfolio did was win about one-third of the time when the holding period was between five and seven years. For holding periods of 13 years and longer, the portfolio never beat the 15-year mortgage.
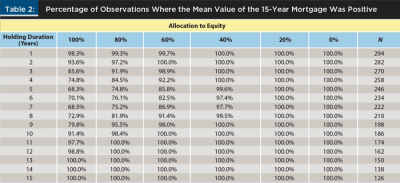
According to a study based on the 2009 and 2011 American Housing Surveys, the duration for single family homebuyers was about 13 years (after adjusting for the atypical housing period). Nearly two-thirds of single family homebuyers remained in their homes after year seven, with only 15 percent moving out during years five through seven (Emrath 2013). If all single-family homebuyers invested in a 100 percent equity portfolio, and mortgages were ended according to the study’s mobility rate, approximately 10 percent of buyers would have been better off without the 15-year mortgage, while 90 percent would have been better off with it.
Simulation Analysis
Although the historical analysis revealed the outcomes homebuyers would have faced in the past, they are not necessarily applicable to future results. Therefore, to explore potential outcomes, results were simulated based on market returns and mortgage rates under a variety of assumptions and refinancing strategies.
In the first simulation, neither mortgage was refinanced over the 30-year investment horizon. This was the typical scheme in the existing literature. Here, the difference in payments between the 30-year and 15-year mortgage was invested in a combination of equity and fixed income with a 100 percent allocation to equity (Model 1) and the initial mortgage rates set to the historical average rates of 6.16 percent and 5.62 percent for the 30-year and 15-year mortgages, respectively, and asset returns simulated 1,000 times.
Figure 1 shows that the 30-year mortgage outperformed the 15-year mortgage at the mean (statistically less than 0 at the 99 percent level, two-sample t-test with unequal variances) and median, with just over half of the simulations favoring the 30-year mortgage and a greater upside potential. Comparing the means alone, however, fails to account for the difference in risk between these investments. The secondary axis plots the standard deviation of the net balances (the portfolio values and the mortgage balances) for each investment over the 30-year horizon.
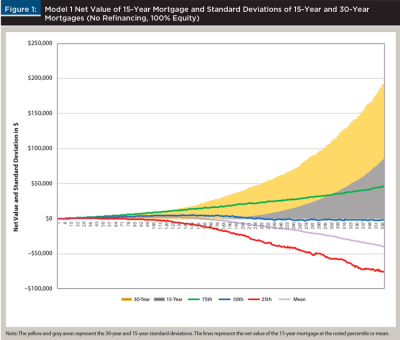
Figure 1 shows that although the 30-year investment may beat the 15-year investment on average, it does so with much greater risk—this is an apples-and-oranges comparison of investments when equity is set to 100 percent. To better gauge a risk-adjusted return, the equity allocation can be set so that the standard deviation at 30 years is roughly equal for the two investments. To adjust for this, equity was set to 60 percent, and the simulations were re-run (Model 2), as shown in Figure 2.
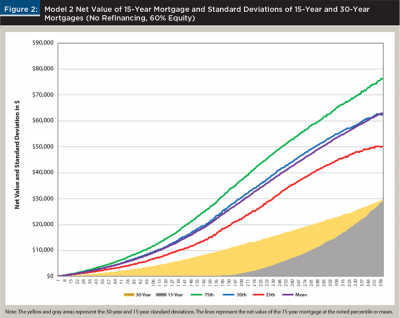
At 60 percent equity, the 15-year investment bested the 30-year investment at the mean (statistically greater than 0 at the 99 percent level, two-sample t-test) and median, as well as at the 75th and 25th percentiles. This effort to risk-match the two strategies highlights the importance of adjusting for the risk, as this approach clearly favors the 15-year investment over the 30-year investment.
Comparison to Return Data from Prior Literature
As mentioned earlier, prior literature conducted similar analysis and concluded that the 30-year mortgage was often superior. One critical characteristic of that research was the time frame of the investment returns upon which the simulations were based. Over the September 1991 to March 2002 period, the average equity return was 10.8 percent, while the 30-year mortgage rate was 7.70 percent and the 15-year rate was 7.26 percent. With the assumption of 100 percent equity (Model 3), the 30-year mortgage outperformed the 15-year mortgage in the majority of simulations and at the mean (statistically less than 0 at the 99 percent level, two-sample t-test with unequal variances), however, once the equity allocation was relaxed to a more comparable 60 percent equity (Model 4), the 15-year mortgage once again outperformed at the mean (mean statistically greater than 0 at the 99 percent level, two-sample t-test). This supports the argument that the selected time frame for historical data used to form assumptions for the simulation has had a meaningful impact on the conclusions drawn.
Consideration of Tax Deductible Interest
Prior literature also included considerations for the tax deductibility associated with mortgage interest. As mentioned earlier, most homeowners did not itemize deductions and therefore did not take the mortgage interest deduction, and given the increase in standard deduction and new limits on mortgage interest deductions, it is expected that even fewer homeowners will itemize and take the deduction in the future. That said, running comparable simulations to Model 1 and Model 2, with the exception of the mortgage interest being fully deductible at the 25 percent rate to explore the impact of adding tax deductibility, remained worthwhile for comparisons to prior literature.
At the 100 percent equity allocation (Model 5), the addition of the tax deductibility further strengthened the argument for the 30-year mortgage (mean statistically less than 0 at the 99 percent level, two-sample t-test with unequal variances). However, at the 60 percent equity allocation (Model 6), the tax deductibility reduced the value of the 15-year mortgage relative to the 30-year mortgage, but even at the 25th percentile, the 15-year mortgage outperformed the 30-year mortgage (mean statistically greater than 0 at the 99 percent level, two-sample t-test).
As prior literature has shown, allowing for the tax deductibility does strengthen the case for the 30-year mortgage, but when considering a risk-matched investment portfolio with 60 percent equity, the additional tax savings were not enough to make the 30-year mortgage more attractive than the 15-year mortgage.
In sum, the choice of data period mattered, and an updated returns history favored the 15-year mortgage over the 30-year mortgage. Additionally, it was important when comparing returns of investments to account for the differences in risk level. Here, the riskier 100 percent equity allocation favored the 30-year mortgage, particularly once tax impacts were accounted for. However, the 30-year mortgage investment carried more risk than the 15-year investment at this allocation.
It is also important to note that the likelihood of having a tax impact will increase with mortgage value and be influenced by state and local taxes. Adjusting the risk by shifting the allocation toward fixed income (60 percent equity allocation) yielded more risk-comparable investments, and strongly favored the 15-year investment. Although prior literature supported the advice to homeowners that there were long-run gains in using a 30-year mortgage, once more current market returns, tax implications, and risk were accounted for, this advice no longer held up.
One-Time Refinance
This analysis considered alternative investment schemes to take advantage of the additional equity built with a 15-year mortgage. One such scheme allowed two sequential 15-year mortgages, where the second mortgage was taken once the first mortgage was paid off, with a new balance equal to the balance one would have with a 30-year mortgage at that point (i.e., the investor never had more leverage with the 15-year mortgage than the 30-year mortgage). The cash generated from this new mortgage was invested as a lump sum into the investment portfolio. This, of course, introduced interest rate risk into the 15-year investment as the homeowner refinanced at some unknown rate. The advantage of this for the investor would be to put the equity to work, as it would earn a 0 percent return once the first 15-year mortgage had been paid off.
Assuming a 2 percent cost to refinance at year 15, and the second rate drawn from a normal distribution with the mean and standard deviation of the 30-year rate, and margin between the 30-year and 15-year rates, the 15-year investment outperformed more frequently, had roughly the same mean (statistically not different than 0 at the 90 percent level, two-sample t-test with unequal variances), and had a greater upside than downside. It did, however, introduce a meaningful change in the relative risk of the two options. The risk of the 30-year investment was reduced (this was caused by changes in the net contributions in some simulations), and the risk of the 15-year investment was increased. There did remain, however, a difference in risk that should be adjusted for in order to make a fair comparison.
To adjust for risk, the equity allocation was set to 82 percent (Model 8), which yielded roughly the same standard deviations for the alternatives. With this allocation, the 15-year investment outperformed the 30-year investment in most cases, with only slight underperformance at the 25th percentile (mean statistically greater than 0 at the 99 percent level, two-sample t-test).
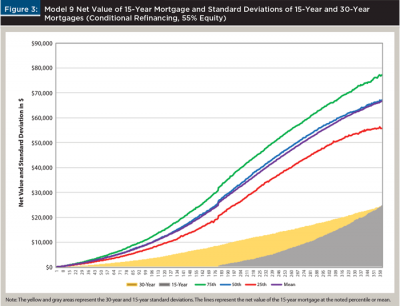
This alternative example illustrated a blind refinancing, where the homeowner had to refinance even if the rate at the time made little sense. To add a bit of sensibility to this, a rule was set up so that the refinance at year 15 only took place if the rate drawn on the 15-year mortgage was less than the expected rate of return on the investment portfolio. Acknowledging that there are certainly more ways to improve on this strategy, this simple rule had a meaningful impact on the outcomes. Adding the sensibility to not refinance in a disproportionally high interest rate environment improved the performance and reduced the risk of the 15-year investment. To risk-match, the equity allocation was set to 55 percent (Model 9). As shown in Figure 3, this approach showed the value of the option to refinance later, as this strategy yielded a higher relative performance at a lower risk than the no refinance with 60 percent equity option shown by comparing Model 9 to Model 2.
Clearly, there are likely many superior refinancing strategies available to both the 30-year and 15-year mortgage homebuyers to optimize costs whether considering the cash-out option or
not. Adapting strategies covered in the literature (Agarwal, Driscoll, and Laibson 2013) would be a way to extend this concept to see whether the 30-year or 15-year mortgage strategies perform better while optimizing the refinancing.
In sum, allowing for refinancing improved returns and lowered risk for the 15-year mortgage investor. Ultimately, a target level of risk can be achieved by combining portfolio allocations with a refinancing strategy.
Simulated Moving
As a final exercise, this paper considered a simulation where both the 30-year and 15-year homebuyers moved based on a draw from a distribution of homeownership mortality. Using the homeownership mortality estimated by Emrath (2013), this simulation attempted to emulate a more realistic pattern of home buying and moving. In this simulation, both homebuyers (one that always takes a 15-year mortgage and one that always takes a 30-year mortgage) sold their homes at the same time, bought a new home at the same cost as the initial home, borrowing the same $100,000 each time, and putting the built-up equity into their portfolios at each move. The equity allocation was set to 60 percent to risk-match the two investments (Model 10). The performance of the 15-year strategy bested the 30-year strategy by nearly $60,000, on average, over the 30-year horizon (mean statistically greater than 0 at the 99 percent level, two-sample t-test).
In sum, an average household, considering the options of financing all homes with 30-year mortgages or 15-year mortgages, had a meaningful advantage with the 15-year mortgage strategy (only seven of the 1,000 simulations had the 30-year mortgage strategy besting the 15-year mortgage strategy).
Assumptions and Caveats
There were some clear, and challengeable, assumptions that this methodology took on. First, this paper assumed in most of the simulations that there was no difference in the tax treatment of any of the returns. There were potentially many scenarios in which that would not be true. What was required for that to be true would be that the mortgage interest was not tax deductible for the investor. Although U.S. tax code allowed for the itemized deduction of mortgage interest up to a limit, most taxpayers did not claim the deduction and decided to use the standard deduction instead (Stansel and Randazzo 2011). The use of the deduction varied some over time, but stayed within a range of roughly 20 percent to 25 percent of taxpayers. Its usage varied with age and income as well, with younger and higher income households having claimed the deduction more frequently. Use of the deduction lowered the gross value of the 15-year mortgage as the larger tax deduction generated by higher interest rates and, over time, larger balances, generated a tax refund (or incentivized lower withholding), which was added to the investment portfolio. Although the recent tax changes created conditions favorable to the 15-year mortgage strategy, individual investment advice should be based on individual circumstances with this framework in mind.
This assumption also required that the returns from the portfolio could grow and be accessed without generating a tax liability. Under current tax law, it is not completely unreasonable to get tax-free growth using non-income-generating equities and non-taxable bonds; however, the returns to the equities would still be taxable upon sale without further tax sheltering. This, of course, could be simplified by assuming the investments were being made into a Roth IRA with after-tax income, or some other tax-sheltering vehicle. Without complete tax sheltering, the 15-year mortgage investment’s performance would improve relative to the investment portfolio, as taxation either during the investment phase or at the point of withdrawal would diminish the portfolio’s value.
The model used in this analysis was based on the premise that the decision of how much to spend on a house and how to finance it were independent. What this assumption imposed was a scenario where the borrower had set a budget for housing based on a 30-year mortgage and had investible income that could be allocated either to afford a 15-year mortgage or a portfolio of investments. For many borrowers that may not be the case.
This paper did not attempt to study the relative return of spending less on a home to have the monthly payment from a 15-year mortgage equal to that of a more expensive home with a 30-year mortgage. There were several major differences between those approaches. First, the decision of spending more or less on a home would open up the issue of the marginal utility generated from buying a more expensive house. By only comparing the financing choice and not the spending decision, that was not an issue for this paper.
Second, because the home purchased was the same under the two alternatives, the value of the home impacts the value of the mortgage investment and the portfolio equally, assuming the owner was not in a foreclosure or short-sale position when ending the mortgage. Clearly, a distressed sale may have a significant impact on the equity position of a home. Further analysis may be able to estimate the relative impacts associated with distressed sales, accounting for differing mortgage balances and outside assets. This paper assumed that the borrower did not default on their mortgage or was in a negative equity position at the time of the mortgage ending.
On the back end, there may be an advantage to having a higher portfolio balance for easily accessible cash (as home equity is relatively illiquid) when transitioning to a new home. A homeowner may, at a cost, borrow against their equity to create the liquidity. Additionally, accessing the portfolio’s balance may have tax consequences. Ultimately, there are pros and cons for both options with respect to liquidity.
Refinancing more frequently was also not directly accounted for in this paper, but it remains a viable option for both mortgage strategies. An improved equity position in the home only enhances the viability of refinancing, should the market conditions favor refinancing, thus improving the relative standing of the 15-year strategy. Although the simulation assumed a mobility rate, it may be interesting to create a model with endogenously determined refinancing and mobility.
Discussion and Implications
These simulations explored the concept of trading off traditional investments for move favorable borrowing terms and the sensitivity of the outcomes to different repayment strategies and market conditions. A summary of results for the 10 simulation models is shown in Table 3.
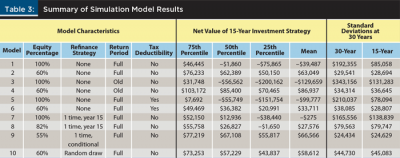
Because a 15-year mortgage (without refinancing) forced the investor to tie up their equity in an asset that returns 0 percent for the final 15 years, prior literature suggested that the 30-year mortgage and investment portfolio strategy was typically best. Once updated market conditions were accounted for, the mean net value improved from –$129,659 to +$39,487, while reducing the standard deviation from $131,283 to $85,058 for the 15-year investment (as opposed to $343,156 and $192,355, respectively, for the 30-year investment). After risk was adjusted, the mean net value improved from –$39,487 to +$63,049 with standard deviation improving to $28,694. Even allowing for full tax deductibility of the mortgage interest at a 25 percent rate only reduced the mean net value back to $33,711.
Imposing a mandatory refinance at year 15 for the 15-year mortgage investment drove the risk up and the net value down. However, allowing for an optional refinance at that point based on a simple rule that compared the interest rate drawn with the investment portfolio expected return, drove the return up ($66,566) and the risk down ($24,629) once risked-matched to the 30-year mortgage investment. This finding supports initial purchases using a 15-year mortgage, even for young buyers, because of the option to refinance upon payoff for a higher-return, lower-risk strategy than the 30-year mortgage strategy, where excess equity would be invested after earning greater returns initially.
Prior models in previous research assumed that the investor was in the same home for the 30-year investment horizon. This is unrealistic. The final model simulated results based on a homeownership mortality table and found that, after adjusting for risk, the 15-year mortgage strategy had a net value of $58,612, with the clear majority of simulations favoring the 15-year mortgage strategy.
Advising homebuyers when they are unsure of their homeownership path (i.e., whether they will be movers or stayers), can be difficult, but this analysis supported the argument that taking the 15-year mortgage strategy is more likely to pay off.
For financial planners, the old advice of taking the 30-year mortgage and investing the difference in a portfolio is likely not appropriate advice for many clients, particularly ones who are not expected to itemize their deductions given the updated standard deduction. While using a mortgage as leverage to free up investible assets is still viable, homebuyers stand to yield greater returns by using the 15-year mortgage and investing their excess equity from strategically timed refinances.
Endnotes
- See “Highlights from the Profile of Home Buyers and Sellers” from the National Association of Realtors at nar.realtor/research-and-statistics/research-reports/highlights-from-the-profile-of-home-buyers-and-sellers.
- See the Consumer Expenditure Survey’s average expenditure, share, and standard error table for “Housing Tenure and Type of Area” for 2015 and 2016 at bls.gov/cex/tables.htm.
- See “Tax Reform With $750k Cap on Mortgage Interest Deduction Would Leave 1 in 7 U.S. Homes Eligible” from Zillow at zillow.com/research/mortgage-interest-deduction-750k-17620.
- See 2017 mortgage rates at freddiemac.com/pmms.
- The starting periods ran monthly from September 1991 through January 2016 in order to provide at least a one-year holding period for each mortgage.
References
Agarwal, Sumit, John C. Driscoll, and David I. Laibson. 2013. “Optimal Mortgage Refinancing: A Closed Form Solution.” Journal of Money, Credit, and Banking 45 (4): 591–622.
Amromin, Gene, Jennifer Huang, and Clemens Sialm. 2007. “The Tradeoff Between Mortgage Prepayments and Tax-Deferred Retirement Savings.” Journal of Public Economics 91 (10): 2,014–2,040.
Aulerich, John R. 2004. “Effect on Net Worth of 15- and 30-Year Mortgage Term.” Journal of Financial Counseling and Planning 15 (2): 12–21.
Basciano, Peter M., James M. Grayson, and James Walton. 2006. “Is the 30-Year Mortgage Preferable to a 15-Year Mortgage?” Journal of Financial Counseling and Planning 17 (1): 14–21.
Becketti, Sean. 2017. “Why America’s Homebuyers and Communities Rely on the 30-Year Fixed-Rate Mortgage.” Freddie Mac Perspectives. Available at freddiemac.com/perspectives/sean_becketti/20170410_homebuyers_communities_fixed_mortgage.html.
Emrath, Paul. 2013. “Latest Study Shows Average Buyer Expected to Stay in a Home 13 Years.” National Association of Home Builders. Available at nahbclassic.org/generic.aspx?genericContentID=194717.
Goff. Delbert C. and Don R. Cox. 1998. “15-Year vs. 30-Year Mortgage: Which Is the Better Option?” Journal of Financial Planning 21 (11): 88–95.
Laufer, Steven. 2017. “Equity Extraction and Mortgage Default.” Review of Economic Dynamics 28 (4): 1–33.
Michelangeli, Valentina. 2012. “Should You Pay Off Your Mortgage or Invest?” Economics Letters 115 (2): 322–324.
Stansel, Dean, and Anthony Randazzo. 2011. “Unmasking the Mortgage Interest Deduction: Who Benefits and By How Much?” Reason Foundation Policy Study No. 394. Available at reason.org/wp-content/uploads/files/mortgage_interest_deduction.pdf.
Vruwink, David R., and Dann G. Fisher. 1995. “The Effects of Income Tax Rates and Interest Rates in Choosing Between 15- and 30-Year Mortgages.” The CPA Journal 65 (11): 72–75.
Citation
Farrell, James. 2018. “Revisiting the 15-Year Mortgage as an Investment.” Journal of Financial Planning 31 (9): 46–55.