Journal of Financial Planning: September 2018
David M. Blanchett, Ph.D., CFA, CFP®, is head of retirement research at Morningstar Investment Management. He is a recipient of the Journal’s 2007 Financial Frontiers Award and its 2014 and 2015 Montgomery-Warschauer Award.
Executive Summary
- This research explores the implications of early retirement on required savings levels and variables that can help predict when someone might retire earlier than expected.
- Research suggests people tend to retire earlier than expected. Retiring early can have a significant (negative) impact on a retiree’s likelihood of achieving retirement success.
- A nonlinear relation exists between actual and expected retirement age, where individuals targeting retirement before age 61 tend to retire later than expected, and those targeting retirement at an age after 61 generally retire approximately a half-year early for each additional year targeted past age 61.
- Incorporating retirement age uncertainty into a financial plan can have a significant impact on required retirement savings levels.
- Financial planners should consider modeling early retirement to prepare clients for the (likely) possibility that it may occur, especially for individuals targeting retirement past age 65.
A growing body of research notes that retirement age projections are inconsistent with actual retirement age decisions—people tend to retire earlier than expected. Retiring early can have a significantly negative impact on a retiree’s likelihood of meeting his or her retirement income goal by reducing the time for saving and investing, lowering the potential Social Security benefit, and potentially extending the retirement period (assuming the decision to retire early is independent from any kind of health shock).
This paper explores the extent to which certain variables1 can help predict early (or late) retirement; it also explores the implications of early retirement on required savings levels.
Few of the variables considered for the analysis have statistically significant coefficients, which suggests there is a significant amount of uncertainty (i.e., randomness) associated with the decision to retire early. One variable, though—expected age of retirement—drove the majority of the predictive effect of the model.
The forecast error associated with expected retirement age is nonlinear, where individuals targeting a retirement before age 61 tend to retire later than expected; individuals targeting a retirement age of 61 retire when expected; and those targeting a retirement age after 61 generally retire approximately a half-year early for each additional year of work planned past age 61 (e.g., an investor targeting a retirement age of 69 would actually retire around age 65).
Incorporating retirement age uncertainty into the retirement planning process can significantly impact required retirement savings levels. For example, a 55-year-old targeting a retirement age of 65 and a 4 percent initial withdrawal rate would need approximately 25 percent more savings (at age 55) to achieve the same income level with the same probability of success, assuming no retirement age variability. Additional required savings for equivalent outcomes can exceed 50 percent, or even 100 percent, for those scenarios with a later retirement age (e.g., age 70) or higher probabilities of success.
Overall, these findings suggest retirement age uncertainty is an important consideration for financial planners. Financial planners should consider modeling early retirement to prepare clients for the (likely) possibility that it may occur, especially for those individuals targeting a retirement past age 65.
Retirement Age Trends
When making a financial plan, the expected retirement age is typically provided by the client. In theory, the client should have a relatively good idea of when he or she will retire, especially as the client gets closer to retirement. In reality, there is a growing body of research demonstrating that investors do not tend to retire when expected, primarily retiring earlier. This effect is noted in Figure 1, where Panel A includes data on actual versus expected retirement age from Gallup surveys, and Panel B includes historical data on the probability of retiring when expected from EBRI’s 2017 Retirement Confidence Survey (Greenwald, Copeland, and VanDerhei, 2017).
Both panels in Figure 1 suggest individuals tend to retire earlier than expected. For example, in Panel A, the average difference between actual and expected retirement has been approximately four years (i.e., people are retiring four years earlier than expected), and while the average actual age among retirees has been increasing (from 59 to 62), so too has the expected age (from 63 to 66). This is similar to the results noted in the EBRI Retirement Confidence Survey in Panel B, where the median expected retirement age among workers was 65 versus an actual age among retirees of 62 (a three-year difference).
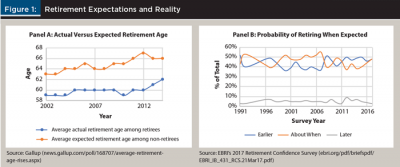
In Panel B, the percentage of workers retiring earlier than expected has averaged approximately 45 percent since 1991, versus 50 percent retiring about when expected, and 5 percent retiring later than planned. Greenwald, Copeland, and VanDerhei (2017) noted that those who retired early tended to cite health problems or disability (41 percent), downsizing or closure (26 percent), or having to care for a spouse or another family member (14 percent) as a reason to retire early, while some reported being able to afford an earlier retirement (24 percent) or wanting to do something else (10 percent).
Increasing retirement ages is a relatively recent phenomenon over the last century. Workforce participation of men aged 65 and over has decreased from 75 percent in 1880 to approximately 20 percent by 1980, but it’s begun to slowly creep back up. Additionally, the average retirement age for men in 1962 was approximately 65, dropping to 62 in the 1990s, and increasing back to 64 by 2013 (Munnell 2015).
This recent trend toward later retirement age is a global phenomenon. For example, among the 34 countries in the Organisation for Economic Co-operation and Development (OECD), the average retirement age for men in 1949 was 64.3 years, decreasing to 62.4 years in 1999, and then increasing to 64.2 years in 2012.2 This recent increase in retirement age has corresponded to increases in the eligibility for government retirement pensions along with financial incentives to delay retirement.
Literature Review
Although most workers expect to retire at a specific age (Settersten and Hägestad 1996), the academic perspective of retirement has evolved over time. Researchers now more commonly view retirement as a transition rather than a discrete event. A comprehensive model of retirement behavior created by Beehr (1986) incorporated a variety of factors, such as environmental (including work and non-work factors) and personal (including health and economic well-being factors).
Fisher, Chaffee, and Sonnega (2016) provided a detailed review of the existing literature on a variety of factors related to retirement timing, including physical factors (e.g., cognitive health, mental health, and economic status); demographic factors (e.g., age, gender, education, and race); psychological factors (preferences and expectations regarding retirement and retirement timing, attitudes toward retirement, role identity, and personality characteristics); subjective life expectancy; family factors; work factors; and macroeconomic factors.
An increasing number of studies have examined relationships between retirement expectations and subsequent behavior at the individual level and concluded that expectations provide useful information for projecting future retirement outcomes (Anderson, Burkhauser, and Quinn 1986; Bernheim 1987; Dwyer 2001), and the noted roles of these factors have varied.
One of the most explored drivers of early retirement is health. A loss of control of retirement age (i.e., because of a health shock) can negatively affect physical health, mental health, well-being, life satisfaction, and adjustment to retirement (Quine, Wells, De Vaus, and Kendig 2007). Dwyerand Mitchell (1999) found that health problems influence retirement plans more strongly than economic variables, where men in poor overall health are expected to retire one to two years earlier, on average.
McGarry (2004) noted that subjective reports of health are powerful predictors of an individual’s expected probability of working at a specified future age, and that the effect of poor health is substantially larger than the effects of financial variables. Other health-related issues like mortality risk have also been noted to affect retirement, because those workers who anticipate having fewer years to live out their retirement may decide to retire early (Hurd, Smith, and Zissimopoulos 2002).
Other things, such as family caregiving responsibilities, which are often unanticipated, may also affect actual retirement timing, especially for women (Zimmerman, Mitchell, Wister, and Gutman 2000). Montalto, Yuh, and Hanna (2000) noted that planned retirement age increases as people get older and (to a lesser degree) have higher noninvestment income.
Postponement of retirement may occur in periods of economic downturns (Goda, Shoven, and Slavov 2011). Stock market fluctuations seem to be more important for the retirement plans of higher socioeconomic status groups, whereas changing unemployment rates tend to have a greater effect among lower socioeconomic status groups (Coile and Levine 2011). Rutledge, Gillis, and Webb (2015) found that the decrease in defined-benefit pension coverage from previous jobs and the decline in retiree health coverage between the Health and Retirement Study (HRS) and the Survey of Income and Program Participation cohorts each pushed the retirement age up by approximately one year, all else equal.
The Uncertainty of Retirement Forecasts
Three key variables are required to estimate the cost of retirement, or really any financial goal: (1) the need (or annual cash flow, CF); (2) how long the goal lasts (in years, N); and (3) the expected returns on the portfolio each period (ri). For example, Equation 1 can be used to estimate the cost of retirement (assuming income begins immediately). This approach is similar to a concept introduced by Blanchett, Kowara, and Chen (2012), which was used to estimate the “sustainable spending rate.”
Portfolio returns are generally the only variable treated as random in a financial plan (i.e., in a Monte Carlo simulation). Incorporating uncertainty around future returns is an improvement over using a single return assumption (e.g., that the portfolio increases by 5 percent per year), because the randomness enables a financial planner to provide additional uncertainties associated with investing. In reality, though, each of these three key variables has some degree of uncertainty. For example, it’s possible the retirement need could change considerably over time (e.g., if the client enters a nursing home), and it’s impossible to know exactly how long retirement will last.
Just because an input is uncertain, though, does not necessarily mean it should be treated as a random variable in a financial plan. An important consideration when determining which variables should be treated as random has to do with the effective control the individual has over the decision. For example, with respect to returns, while a client can control the general risk of the portfolio (i.e., the equity allocation), the client has no control over the underlying components (e.g., the return on stocks and bonds). In contrast, the client typically has significant control over the cash flows withdrawn from the portfolio each year (total control, we could argue). Although withdrawing less than some target amount may be unpleasant (i.e., result in a significant change in lifestyle), it can generally be accommodated.
While many studies have modeled investment returns—potentially along with withdrawal rates and longevity—as random variables, few have treated retirement age as a random variable, and this is the key innovation this study offers.
Data
Data for the analysis was obtained from the first 12 survey years, or waves, of the Health and Retirement Study (HRS), from 1992 to 2014. The HRS is a panel household survey specifically focused on the study of retirement and health among individuals over the age of 50 in the United States. The HRS is sponsored by the National Institute on Aging and the Social Security Administration and is conducted by the University of Michigan. The survey was first conducted in 1992, and respondents are resurveyed every other year with additional households added to the survey to keep it representative of the target population. HRS fields are combined with data from the RAND HRS, which is a user-friendly version of a subset of the HRS developed at the RAND Center for the Study of Aging with funding from the National Institute on Aging and the Social Security Administration.
The HRS has detailed information about household retirement expectations and decisions. For example, Figure 2 includes information about the distribution of planned retirement age by HRS wave (i.e., survey year) for all responses available in each wave.
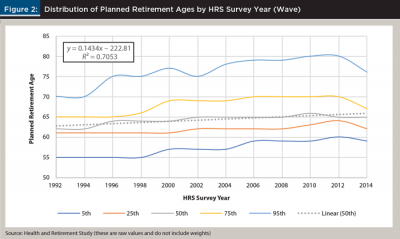
Planned retirement ages have increased by about three years across waves (approximately 0.14 years per year, across the 22 years). This change is directionally similar but roughly half the annual increase noted in the Gallup poll (Figure 1, Panel A), where the slope, or year-over-year change, has been 0.29 (consistent with a three-year increase in expected retirement age from the year 2002 to 2014).
Various filters were applied to the available data. First, the analysis was limited to respondents coded as working with a minimum annual wage of $10,000 (adjusted to 1992 dollars3) for the respective wave. Second, the respondent must have had at least five years before the expected retirement age and four years remaining after the expected retirement age to be included (these are each from the respective survey year). Third, the respondent had to be coded as actually becoming fully retired during the period of analysis (i.e., sometime between the first and last waves). The second and third filters ensured the analysis captured respondents retiring before and after their expected retirement age. These filters mean the last wave that considered expected retirement ages was 2004 (although later waves were used to check for the actual retirement age).
The first available expected retirement age provided by the respondent, assuming it met the previously noted criteria, was used for the analysis. This results in most retirement age estimates coming from the first wave, 1992. While an individual’s retirement estimate is likely to change as he or she approaches retirement, the earliest available estimate was used to reflect initial expectations for the respective household. This also ensured the estimates were ex-ante.
Variables
The variables considered for the analysis were:
Actual retirement age: the age when the respondent fully retired.
Planned retirement age: the age when the respondent expected to retire.
Years to planned retirement age: the difference between the expected retirement age and the current age.
Years of education: the number of years of education completed.
Marital status: a dummy variable with a value of 1 if the person is married, 0 if other.
Gender: a dummy variable with a value of 1 if the person is male, 0 if other.
Years of tenure at current job: the self-reported tenure of current employment.
Total household income: this variable is log-transformed to reduce the skewness.
Net housing wealth/total household income: the log-transformed value of the net value of the home minus liabilities (i.e., mortgage) divided by the log-transformed income. A minimum value of $100 was assumed.
Non-housing wealth/total household income: the log-transformed value of the non-housing wealth (which includes all financial assets) divided by the log-transformed income. A minimum value of $100 was assumed.
Total household Social Security wealth/total household income: the log-transformed total value of Social Security benefits for the household divided by the log-transformed income. A minimum value of $100 was assumed.
Pension: a dummy variable with a value of 1 if the person is covered by a defined-benefit pension, 0 if not.
Probability of living to age 75: the self-assessed probability of living to age 75.
Job stress level: whether the respondent agreed with the statement that his or her job involves a lot of stress. This is technically a categorical variable, with four possible responses, but was treated as continuous as a simplifying assumption. Higher values are associated with lower levels of stress.
Job physical effort: the extent to which the respondent said his or her job requires a lot of physical effort. This is technically a categorical variable, with four possible responses, but was treated as continuous. Higher values are associated with lower levels of physical effort.
Health limits work: whether an impairment or health problem limited the kind or amount of paid work for the respondent. This is a dummy variable with a value of 1 if health problems do limit work, 0 if not.
Health status: the respondent’s self-reported general health status. This is technically a categorical variable, with five possible responses, but was treated as continuous as a simplifying assumption. Higher values are associated with lower health status levels.
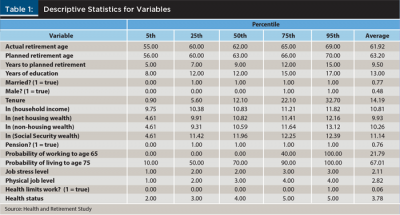
The economic intuition for including most of these variables is somewhat obvious, and many have been considered in past research exploring retirement ages or decisions. To be included in the analysis, data must have been available for all variables. There was relatively little correlation among the variables; therefore, multicollinearity was not a concern for the regressions (e.g., the variance inflation factors, or VIFs, for all variables were less than 2). Table 1 shows descriptive statistics for the variables.
Analysis
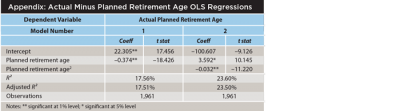
A series of ordinary least squared (OLS) regressions were conducted, and the results are included in Table 2. The dependent variable for Model 1 was the actual retirement age; the dependent variable for Model 2 was the planned retirement age; the dependent variable for Model 3 was the difference in the expected and actual retirement ages (i.e., does the person tend to retire before or after the expected age); and the dependent variable for Model 4 was the absolute difference in the actual and expected retirement age (i.e., the general accuracy of the prediction). The independent variables changed slightly based on the model. The regressions include weights from the respective HRS wave.
Table 2 offers important takeaways, explored next by model number.
Model 1. With respect to actual retirement age, respondents who tended to retire at older ages planned to retire later, were closer to retirement, had shorter job tenures, lower household incomes, lower levels of housing wealth, had a higher self-assessed probability of working to age 65, and tended to be in worse health. The significance of the retirement age coefficient (the t-statistic is 25.712) suggests individuals have some general idea of when they are going to retire.
Model 2. With respect to planned retirement age, respondents who planned to retire later tended to be further from retirement, were single, male, had lower incomes, less financial assets saved, lower Social Security benefits, were not covered by a pension, had a higher self-assessed probability of working to age 65, and more job stress. The years to planned retirement age variable was obviously somewhat endogenous to planned retirement age, therefore the high t-statistic is not surprising.
Model 3. With respect to the difference in the actual and planned retirement age, among respondents with positive differences (i.e., tended to retire later than expected), the difference was largest for those who were further from retirement, had more years until retirement, longer job tenures, higher incomes, more housing wealth, and had a lower self-assessed probability of working to age 65. This is perhaps the most important model among the four, because it drives the primary objective of the analysis.
Model 4. With respect to the absolute difference in the actual and planned retirement age, which provides some perspective on the ability to correctly forecast retirement age, the difference (i.e., forecast error) was largest for those who were further from retirement. Certain variables (e.g., years of education, income, or financial assets) were not predictive, suggesting the retirement age is effectively random (beyond planned retirement age).
Figure 3 includes information about the distribution of differences in actual and planned retirement ages by age (Panel A) and the values that result using the regression models introduced in Appendix 1 (Panel B).
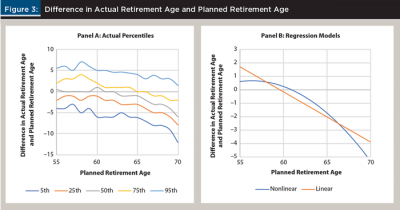
Figure 3 demonstrates that the error in actual and planned retirement ages is nonlinear. Individuals targeting a retirement before age 61 tend to retire later (e.g., someone targeting to retire at age 57 will actually retire around age 58). Those targeting a retirement age of 61 tend to retire approximately at that age, and those targeting retirement after age 61 generally retire approximately a half a year early for each additional year planned to work past age 61 (e.g., a client targeting a retirement age of 69 would actually retire around age 65). These differences are an important distinction to consider, instead of assuming all individuals retire early, because the implications of early retirement predominately affect individuals with older target retirement ages (e.g., past age 65, since they are retirees who are actually retiring before the expected retirement age).
The Impact of Retirement Age Uncertainty on Required Retirement Savings
Early retirement, especially the uncertainty surrounding it, can potentially have significant implications on required retirement savings. This section quantifies the potential cost associated with this uncertainty.
For this analysis, a 5,000-run Monte Carlo simulation was conducted. The individual’s age for the analysis was assumed to be 55. Retirement ages between 60 and 70, in one-year increments, were considered. Total retirement savings were assumed to be $500,000 (at age 55), with annual savings of $10,000. The Social Security benefit at full retirement age (FRA), or age 67, was assumed to be $30,000. All values are in real terms (i.e., adjusted for inflation) and taxes were ignored for the analysis. Note, the savings and Social Security values were estimated assuming annual wages of $100,000.
Social Security retirement benefits were assumed to be claimed upon retirement (although no earlier than age 62). The benefit amount at full retirement age (assumed to be $30,000) was adjusted based on early or late retirement based on the adjustments noted by the Social Security Administration.4 For example, if claimed at age 62, the annual benefit would be $21,000 (70 percent of the FRA benefit); and if claimed at age 70, the annual benefit would be $37,209 (124 percent of FRA benefits). The average indexed monthly earnings (AIME) was not assumed to change based on early or late retirement (i.e., Social Security benefits were not assumed to increase even if the person worked longer).
The portfolio was assumed to be invested in 40 percent equities and 60 percent fixed income, with respective components generally being a U.S. large-cap equity portfolio and a U.S. aggregate bond portfolio. The assumed real annual arithmetic return of the portfolio was 2 percent with a standard deviation of 8 percent. These return assumptions were similar to JP Morgan Asset Management’s 2017 capital market assumptions5 as well as Morningstar Investment Management’s 2017 20-year capital market assumptions.6 The returns implicitly assumed an investment management fee of 0.5 percent (i.e., the assumed return would be 2.5 percent if a fee was not included). Retirement was assumed to last until age 95 regardless of when it commenced.
Three approaches were considered. For the first approach, the retirement age was assumed to happen with certainty. This is the traditional approach taken by planners when generating a financial plan.
For the second approach, the nonlinear regression model introduced in the Appendix was used to determine the actual retirement age based on the projected retirement age (e.g., for a target retirement age of 69, the actual retirement age was assumed to be 65). For this model, there was no assumed randomness associated with the retirement age decision (you were assumed to potentially retire at an age that differed from your target, but that retirement age was constant across runs).
The third approach built on the second approach but incorporated potential randomness around the actual retirement age. The randomness was assumed to follow a normal distribution with a mean of zero and a standard deviation of 3 (consistent with the error associated with the nonlinear model in the Appendix). The maximum positive change in retirement age was two standard deviations (i.e., six years), although Social Security benefits were always assumed to commence no later than age 70 and never before age 62. The maximum negative change in retirement age was also two standard deviations (six years) or the current age of the investor (e.g., a 55-year-old targeting a retirement age of 60 could retire no earlier than age 55).
Figure 4 includes the results from simulations where the base retirement need was assumed to be $50,000 (in constant real dollars). The amount was not assumed to change based on retirement age. The amount represents a median withdrawal of 3.7 percent from the portfolio in the first year of retirement at age 65.
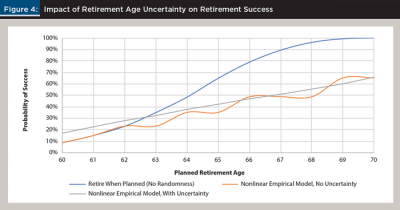
Figure 4 contains a variety of information. First, delaying retirement can have a significant, positive impact on the probability of an investor achieving a retirement goal. Within the context of this analysis, delaying retirement gives the investor more time to save, more time for the portfolio to grow, a larger Social Security retirement benefit, and a shorter retirement period (retirement is assumed to end at age 95 regardless of retirement age).
Second, incorporating average retiree behaviors (i.e., the nonlinear error model) resulted in higher success rates for individuals targeting a younger retirement age (i.e., those targeting a retirement age at 60) because these retirees tended to retire later than expected, but resulted in lower success rates for those targeting an older retirement age.
Third, incorporating uncertainty (beyond simply using the nonlinear model) did not result in significantly different outcomes than the base nonlinear model (i.e., being aware of when someone was likely to retire given their target age appeared to capture the clear majority of the impact of the model).
Next, an analysis was conducted to determine the additional savings required to achieve the same probability of success for a given withdrawal rate when incorporating retirement age uncertainty versus more traditional retirement modeling (i.e., assuming the individual always retired when expected). This was determined through stochastic simulation (i.e., different current savings levels were tested until the one that resulted in the same probability of success was determined). For example, assuming a retiree is targeting a retirement age of 65 and a 4 percent median initial withdrawal rate (across simulations) the total retirement need (at age 65) would be $52,076.7 The probability of success of achieving this income level (to age 95) was 56 percent. To achieve the same probability of success (56 percent) for the same income level ($52,076), the current balance at age 55 would need to increase by 28 percent to $641,450 (from the assumed $500,000).
This analysis was conducted for retirement ages from 60 to 70, in one-year increments, and for initial withdrawal rates (at the target retirement age) of 3 percent, 4 percent, and 5 percent. To make the results more intuitive, simply note the 3 percent initial withdrawal target as a high probability of success, the 4 percent initial withdrawal target as a moderate probability of success, and the 5 percent initial withdrawal target as a low probability of success. The results are shown in Figure 5.
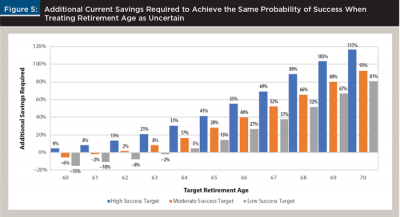
Incorporating retirement age uncertainty can significantly increase the required savings levels, especially for individuals targeting later retirement ages (e.g., age 70) and with a higher target probability of success (i.e., a retiree who would take a 3 percent initial withdrawal). If the “average investor” is assumed to be seeking a 4 percent initial withdrawal rate (i.e., a moderate success target) and wants to retire at age 65, the impact of retirement age uncertainty would require approximately 25 percent more savings than suggested by traditional models (28.29 percent to be exact).
These results suggest ignoring retirement age uncertainty can potentially have a significant (negative) impact on potential retirement outcomes. Therefore, financial planners should consider showing clients the implications of an early retirement to potentially get them to save more than they would using a more traditional approach where retirement age is treated as certain.
Conclusion
A financial plan is only as good as its assumptions. While financial planners are increasingly treating returns as a random variable in financial plans (through Monte Carlo simulations), there is obviously a good deal of uncertainty associated with other key assumptions. This paper explored the implications of retirement age uncertainty and found that many individuals are likely to retire at earlier ages than expected, and that this can potentially have a significant impact on required savings (or retirement success). Therefore, it is essential that financial planners understand the implications associated with the expected retirement age assumption.
Endnotes
- The variables tested were: target retirement age, years until planned retirement, years of education, marital status, gender, job tenure, household income, net housing wealth, non-housing wealth, Social Security wealth, whether the individual is covered by a pension, self-assessed probability of working to age 65, self-assessed probability of living to age 75, job stress, physical nature of job, whether health limits the individual’s ability to work, and self-assessed heath status.
- See “OECD Pensions at a Glance” at dx.doi.org/10.1787/pension_glance-2013-en.
- 1992 was used as the base year because it was the most common retirement age expectation wave.
- See ssa.gov/OACT/ProgData/ar_drc.html.
- See am.jpmorgan.com/lu/institutional/our-thinking/ltcma-2017.
- Not publicly available; contact the author for more information.
- Note that $26,000 of this would be covered from Social Security retirement benefits, so the remainder ($26,076) would need to be funded by the portfolio, which had a median value of $652,147 at retirement, before withdrawals began. This resulted in a 4.0 percent initial withdrawal rate ($26,076/$652,147 = 4.0 percent).
References
Anderson, Kathryn H., Richard V. Burkhauser, and Joseph F. Quinn. 1986. “Do Retirement Dreams Come True? The Effect of Unanticipated Events on Retirement Plans.” ILR Review 39 (4): 518–526.
Beehr, Terry A. 1986. “The Process of Retirement: A Review and Recommendations for Future Investigation.” Personnel Psychology 39 (1): 31–55.
Bernheim, B. Douglas. 1987. “The Timing of Retirement: A Comparison of Expectations and Realizations.” NBER Working Paper No. 2291. Available at nber.org/papers/w2291.
Blanchett, David, Maciej Kowara, and Peng Chen. 2012. “Optimal Withdrawal Strategy for Retirement Income Portfolios.” Retirement Management Journal 2 (3): 7–18.
Coile, Courtney C., and Phillip B. Levine. 2011. “The Market Crash and Mass Layoffs: How the Current Economic Crisis May Affect Retirement.” The B.E. Journal of Economic Analysis & Policy 11 (1), article 22. crr.bc.edu/working-papers/planning-for-retirement-the-accuracy-of-expected-retirement-dates-and-the-role-of-health-shocks.
Dwyer, Debra Sabatini, and Olivia S. Mitchell. 1999. “Health Problems as Determinants of Retirement: Are Self-Rated Measures Endogenous?” Journal of Health Economics 18 (2): 173–193.
Fisher, Gwenith G., Dorey S. Chaffee, and Amanda Sonnega. 2016. “Retirement Timing: A Review and Recommendations for Future Research.” Work, Aging and Retirement 2 (2): 230–261.
Goda, Gopi Shah, John B. Shoven, and Sita Nataraj Slavov. 2011. “What Explains Changes in Retirement Plans During the Great Recession?” The American Economic Review 101 (3): 29–34.
Greenwald, Lisa, Craig Copeland, and Jack VanDerhei. 2017. “The 2017 Retirement Confidence Survey—Many Workers Lack Retirement Confidence and Feel Stressed About Retirement Preparations.” EBRI Issue Brief No. 431. Available at ebri.org/pdf/briefspdf/EBRI_IB_431_RCS.21Mar17.pdf.
Hurd, Michael D., James P. Smith, and Julie M. Zissimopoulos. 2002. “The Effects of Subjective Survival on Retirement and Social Security Claiming.” NBER Working Paper No. w9140. Available at nber.org/papers/w9140.
McGarry, Kathleen. 2004. “Health and Retirement: Do Changes in Health Affect Retirement Expectations?” The Journal of Human Resources 39 (3): 624–648.
Montalto, Catherine Phillips, Yoonkyung Yuh, and Sherman Hanna. 2000. “Determinants of Planned Retirement Age.” Financial Services Review 9 (1
): 1–15.
Munnell Alicia H. 2015. “The Average Retirement Age—An Update.” Center for Retirement Research Working Paper No. 15-4. Available at crr.bc.edu/briefs/the-average-retirement-age-an-update.
Quine, Susan, Yvonne Wells, David De Vaus, and Hal Kendig. 2007. “When Choice in Retirement Decisions Is Missing: Qualitative and Quantitative Findings of Impact on Well-being.” Australasian Journal of Ageing 26 (4): 173–179.
Rutledge, Matthew, Christopher Gillis, and Anthony Webb. 2015. “Will the Average Retirement Age Continue to Increase?” Center for Retirement Research Working Paper No. 2015-16. Available at crr.bc.edu/wp-content/uploads/2015/07/wp_2015-16.pdf.
Settersten Jr., Richard A., and Gunhild O. Hägestad. 1996. “What’s the Latest? Cultural Age Deadlines for Family Transitions.” The Gerontologist 36 (2): 178–188.
Zimmerman, Lillian, Barbara Mitchell, Andrew Wister, and Gloria Gutman. 2000. “Unanticipated Consequences: A Comparison of Expected and Actual Retirement Timing Among Older Women.” Journal of Women & Aging 12 (1-2): 109–128.
Citation
Blanchett, David M. 2018. “The Impact of Retirement Age Uncertainty on Retirement Outcomes.” Journal of Financial Planning 31 (9): 36–45.