Journal of Financial Planning: September 2012
An Informative Illustration’s Perspective on GNL Policies
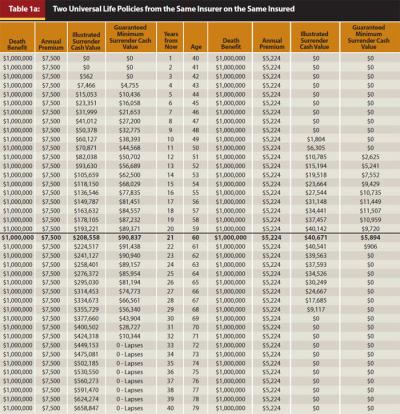
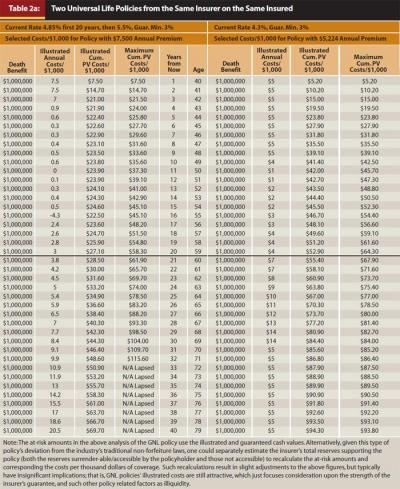
Table 1a presents illustration data for two policies for the same insured and from the same insurer, each with a level $1 million death benefit. The first policy is a conventional universal life (UL) policy with a $7,500 annual premium; the second is a guaranteed no-lapse (GNL) universal life policy with a $5,224 annual premium. Surprisingly, the policy that is guaranteed never to lapse has a premium that is smaller—approximately two-thirds the size of the policy that could lapse in 33 years. Quantifying this counterintuitive anomaly, Table 2a shows the illustrated current costs and the cumulative present values per $1,000 of coverage provided for both illustrated and guaranteed maximum costs for these two policies. Notice that the GNL policy, with its significantly smaller guaranteed maximum cost over 33 years ($82 versus $115 per thousand dollars of coverage), somehow has a much greater cost over the first 20 years, on both an illustrated ($52 versus $27) and a guaranteed basis ($65 versus $58).
These oddities raise a critically important question: what is happening with the GNL policy? The policy’s lower crediting rate on cash values provides some indication, as does its zero cash values in the latter years. Specifically, GNL policies do not adhere to the industry’s traditional non-forfeiture principles; that is, a GNL policyholder’s cash values do not closely correspond with the insurer’s reserves backing up and guaranteeing the policy. Consequently, if or when GNL policyholders surrender their policies, they are in essence forfeiting a large portion of the value they previously paid. Life insurers use the anticipated windfalls of these surrenders, and these policies’ low crediting rates on cash values, to build the insurer’s reserves—another way that GNL insurers build reserves not claimable by policyholders to pay, and thereby subsidize, the costs of claims for the persisting policyholders.
As noted in the full article on traditional whole life policies, to which this appendix belongs, consumers should not buy based on illustrations but instead demand and obtain the necessary and relevant information on the insurer’s financial performance and operating practices. The same is just as true for GNL policies. Even though GNL policies are “guaranteed,” there’s always a question with any guarantee: when is a guarantee too good to be true? That is fundamentally a financial analysis question and one beyond the scope of this article on illustrations. But when this vital question is made obvious, the financial mechanics of this GNL type of policy and its annual costs of coverage are made clear, as is the usefulness of the informative illustration together with marketplace benchmark data (or in this case, the insurer’s alternative policy). Note to GNL policyholders and trustees: given that these policies’ annual reports to policyholders do not provide adequate information to assess the policies’ long-run viability, it could be prudent to conduct due diligence reviews regularly, thoroughly, and properly.
Allocated Historical Costs for the Whole Life Policy (Shown in Table 3 of the Full Article)
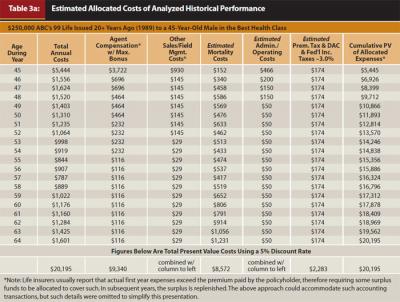
Table 3a, introduced in the full article, shows the aggregate cost of the historical performance of a whole life policy. Table 3a shows estimated allocated costs of the historical performance of the whole life policy. Of these costs, approximately 11 percent were for taxes paid by the insurer, 42 percent were for claims, administrative costs, etc., and 47 percent were sales related.