Journal of Financial Planning: September 2012
R. Brian Fechtel, CFA, is a life insurance agent and founder of Breadwinners’ Insurance, providing consumers and financial planners the information they need, including analysis of life insurers’ financial statements.
Executive Summary
- This article provides a process or approach financial planners and their clients can use to make better decisions about life insurance policies, especially regarding cash value or permanent life insurance policies.
- Currently used sales illustrations do not readily provide the necessary framework or adequate information for assessing life insurance policies.
- The paper introduces an informative illustration format, one built on the structure or mechanics of life insurance policies; that is, that policies comprise streams of annual costs and rates of return. This approach facilitates policy comprehension and emphasizes the need for relevant financial performance information.
- This perspective is then used to compare historical performance of traditional whole life policies and to evaluate such policies with the alternative of buying term and investing the difference. (An online appendix applies the approach to analyze a guaranteed no-lapse (GNL) universal life policy, at https://www.financialplanningassociation.org/article/journal/SEP12-september-2012-fechtel-appendix).
- By clarifying all policies, this educational approach brings new understanding to the marketplace, and thereby contains all the inherent possibilities, such as better value for clients and more opportunities for agents and planners to demonstrate greater expertise and provide superior service.
That risk management is an inherent part of financial planning is an irrefutable truth. Just as all mortgage lenders make sure every homeowner has fire insurance before approving any loan and all new car buyers make sure their auto policy covers their purchase before they drive it off the dealer’s lot, almost all acknowledge that protecting against catastrophes is a financial planner’s paramount obligation, if not first imperative. Life insurance assessments and analysis, consequently, are an intrinsic part of any good and thorough financial planning done for individuals, families, or businesses. The life insurance industry, however, has unfortunately not adopted the transparent practices that characterize the financial planning profession, having largely developed independently from its financial planning industry peers. This has resulted in some agents and financial planners having inadequate knowledge of life insurance matters. This article aims to remedy this by providing agents and financial planners with specific information and approaches for successfully addressing how to obtain good value in a life insurance policy.
Nearly 20 years ago, the Society of Actuaries stated, “Sales illustrations [of life insurance policies] should not be used for comparative policy purposes.”1 And yet, unfortunately, even today, relatively few life insurance marketplace participants—agents, financial planners, and consumers—fully understand this fact and its implications. While there is certainly some awareness that an illustration is not the policy, until illustrations and policies are genuinely and separately understood, obtaining good competitive value in the life insurance marketplace will remain a very challenging endeavor—even for those who prefer term insurance.
This article begins by showing how illustrations of any and all cash value life insurance policies can be transformed into useful illustrations, and how doing so brings genuine and insightful understanding of these policies to all. From such transformation springs the realization of the critical importance of actually understanding a cash value life insurance policy’s financial mechanics, its operating practices, and the insurer’s future financial performance. Given that a policy’s financial performance depends on a series of annual costs and annual rates of returns, this article shows several specific ways financial planners and agents can use the understanding gained from these transformed illustrations. The significance of these changes is manifold: better value for consumers, better product usage, better societal allocation of resources, and a transformation both in the practice and in the public perception of the expertise, trustworthiness, and overall professionalism of those advising about and selling life insurance products.
A Review of Cash Value Life Insurance Policy Illustrations and Analytical Approaches
Illustrations show various policy-related values, such as premiums, death benefit, cash values, etc., for possibly every year until the insured’s potential 121st birthday. These pages of numbers, however, are not projections; that is, they are not meant as estimates of future performance. An illustration is simply a snapshot of current or assumed performance; the underlying factors of performance are illustrated, remaining essentially constant (or as currently is) over the many future years. Illustrations are fundamentally nothing but calculations of numerous policy-related values based on the assumed and largely undisclosed input factors, the underlying factors of performance.
Countless problems have arisen from misunderstandings of the limited nature of illustrations. The sales scandals of the 1980s and 1990s, where premiums did not “vanish” as proclaimed, are well known examples.2 Responding to such, the National Association of Insurance Commissioners (NAIC) mandated multi-page illustrations that now contain not only guaranteed and illustrated values but also mid-point values and definitions of terminology. While mid-point values do indicate that there is some uncertainty about the “illustrated values,” they do little to foster the necessary and genuine understanding of cash value policies.3 Many consumers now erroneously think that the mid-point values are somehow more likely and reasonable than the illustrated values.
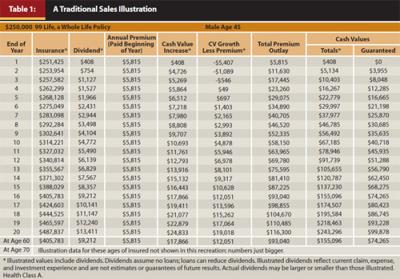
More problematic, many insurers and agents also currently rank policies as competitive or not based on policy illustrations.4 Misleading conclusions about a policy’s attractiveness are also frequently drawn, for example, from its illustration’s cash value rate of return after 20 years, without simultaneously acknowledging that such attractiveness is merely produced by the illustration’s assumptions and is therefore virtually meaningless in measuring real competitiveness. Moreover, agents—especially when selling whole life and other cash value policies—most often use a supplemental illustration like that shown in Table 1; they save the NAIC multi-page form, with its text that tediously covers simple matters while ignoring significant ones, for the insured to sign when completing the application. While there is currently no news in the mainstream media regarding problematic life insurance illustrations and sales practices, there are still extensive and serious problems in the life insurance marketplace arising from the use and misuse of policy illustrations and information.
A review of the literature shows that a handful of approaches have been used to try to analyze cash value life insurance policies. The NAIC introduced the interest-adjusted indices in the 1970s, but this approach is inherently flawed. Its attempt to represent what is at least a two-dimensional product with one measurement is as flawed as trying to completely describe a rectangle with one measurement. Its measurements are neither a rate of return nor a readily understood cost, and therefore not helpful in the financial world where costs and rates are the primary concerns. It cannot be used to compare “dissimilar” policies, and, as currently disclosed and implemented, it is solely based on illustrated values.
Some practitioners still use an approach developed in the 1960s by actuary Albert Linton. This approach analyzes whole life policies by making assumptions about the cost of such term coverage and calculating a yield or rate or return on the stream of “net” premiums (net of mortality costs) and the illustrated cash values.5 Professor Joseph Belth, on the other hand, has proposed a policy disclosure approach that relies on applying an individually chosen discount rate to an illustration’s values to calculate yearly costs.6 Neither Linton’s nor Belth’s approach, given their assumptions, can be called disclosure as neither provides an explanation of what really is being illustrated or what really occurred, in the case of an actual policy history. Both approaches are akin to viewing a policy through a funhouse mirror—they show you something, but not a truly accurate picture.
Some others use homespun analytical approaches, often focusing on one aspect of these three approaches, such as rate of return of cash values or death benefits on premiums paid. Still other practitioners who advocate viewing cash value policies as packages of options (not an invalid perspective, as almost anything can be viewed from an options perspective, but also not a particularly useful one) have then either failed to provide the costs of such bundled products or have erroneously confused analysis of an illustration for analysis of a policy.7 But all such approaches fall short of proper, accurate, and complete analysis of a cash value life insurance policy.
An Informative Illustration: Its Construction and Use
Cash value life insurance policies, while bewildering to many, are fundamentally simple products.8 Annual costs and compounding rates are the building blocks of these policies and the basic input assumptions that create the illustration. Merely using a whole life policy’s illustration, as shown in Table 1, and its embedded information, Table 2 presents this whole life policy’s illustrated values in a much more informative way. This informative illustration is constructed by reverse-engineering the illustration’s values. To do so, the illustration’s current values in Table 1 are discounted by the illustration’s assumed dividend rate, and the guaranteed values are discounted by this policy’s guaranteed interest rate. Given that this particular whole life policy was issued in 1989, the then-current illustrated rate was 10 percent and the guaranteed rate was 5.5 percent. Just as it is essential in disassembling a house to take it apart by its components, it is similarly essential in deconstructing an illustration to take it apart by its components. Only by discounting with the rate used to construct the illustration does one acquire the specific stream of cost assumptions used in the illustration.9
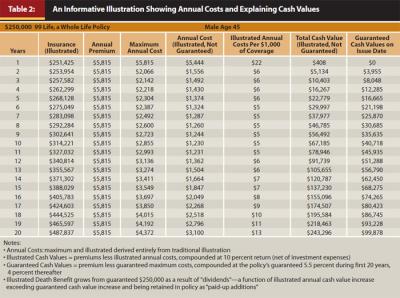
In addition to calculating the maximum and illustrated streams of annual costs for the total amount of coverage provided, it is useful to calculate the cost per thousand dollars of coverage by dividing each annual cost by that year’s specific at-risk amount. Only then, after the illustration’s specific stream of annual cost assumptions has been extracted, is it appropriate to use a user-chosen discount rate (in this case 5 percent) to discount the stream of costs to calculate present value figures, which then can be compared with other similarly calculated figures. And, as will be discussed below, the stream of total annual costs can be disaggregated into its three primary components: (1) sales related, (2) taxes, and (3) claims. The last includes all other non-sales and non-tax costs, such as underwriting and administration, which can be compared with or expressed as a percentage of the relevant maximum Commissioners Standard Ordinary (CSO) Mortality Table figures.
From this straightforward information, users can readily see the input assumptions regarding maximum annual costs, illustrated annual costs, illustrated costs per thousand dollars of coverage, and compounding rate(s) on which the illustration was built. Users can also readily comprehend that the differences between illustrated and guaranteed values are a function of: (1) the differences between the guaranteed and illustrated annual costs, and (2) the differences between the guaranteed compounding rate and the illustrated rate applied to cash values. This informative illustration perspective does not prevent or preclude a more traditional approach in which an illustration might be re-run at a lower interest rate or “mentally modified” to adjust for seemingly favorable and unrealistic mortality costs. Similarly, it does not prevent or preclude any practitioner from conducting any conventional rate-of-return analysis, such as a rate of return that the cash values provide on the premiums, which is simply a netting of the impact of insurance costs out of the illustration’s rate.
This perspective provides a more structured, straightforward, and simpler framework from which to make, disclose, and analyze policy features. For example, Table 2 shows that the insured in a whole life policy, belying common agent misrepresentations, does not pay for a lifetime of coverage upfront, and that the annual costs of coverage continue to increase as the insured ages. Table 2 could be amended to include any other Table 1 values, such as dividends. Table 2 brings a transformative understanding to the otherwise opaque traditional and NAIC illustrations. The illustration is shown to be the consequences of its assumptions, and those assumptions are revealed.
When a client buys a cash value policy, he or she is actually buying the insurer’s operating practices and future financial performance, not the illustration. Again, the illustration is not the policy; demystifying the illustration leads to a vivid understanding of this fact. When consumers and planners fully understand the mechanics of an illustration—that it is based on assumptions regarding annual costs and compounding rates—they are motivated to demand information relevant to assessing such matters for the actual policy. Insight and understanding lead to inquiry.
While no decision should ever be based on a sales illustration itself, by demystifying conventional illustrations, the informative illustration shines the spotlight on the input factors that are worthy of evaluation. Policy illustrations no longer remain simultaneously alluring and bewildering. Moreover, when the product’s factors of performance are revealed, they can be evaluated. Obviously, such evaluations require knowledge of financial benchmarks of attractive performance, which can be assembled from various sources of financial information. While reviewing such approaches is outside this article’s scope, one common approach to assessing future performance is reviewing (correctly, and with all the appropriate caveats) the competitiveness of past performance.
An Informative Illustration of Historical Policy Performance
Policy comprehension, in fact, dramatically expands when historical performance is presented on a year-by-year basis, as shown in Table 3 for the above illustrated whole life policy. (Again, the policy illustrated in Table 1 was actually a current illustration for a whole life policy sold in 1989; that is how its historical data are now available.) The historical performance shows that the insurer’s dividend rate declined over the 20 years, and that its actual costs were less than those originally illustrated. This combination of presenting an informative illustration as shown in Table 2 together with the historical information in Table 3 enables marketplace participants to readily comprehend policies and to ask various relevant and necessary questions. For instance, the illustrated 10th and 20th years’ costs were, respectively, $1,230 and $3,100, while in actuality they were $919 and $1,601. Table 3 clearly suggests that an attractive policy must provide competitive performance with respect to both cost and rate components.
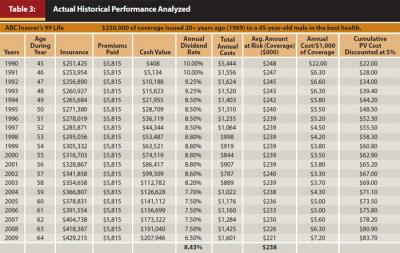
Again, actual historical policy performance, like any performance, needs to be assessed and understood in context and comparatively; that is, with knowledge of how it was achieved and how it compares with competitive alternatives. Table 3’s format clearly facilitates such comparisons, and many parties—life insurers, regulators, insurance professors, financial publishers, journalists, agents, and planners—could all play valuable roles in assembling the benchmark information necessary to conduct such comparisons.
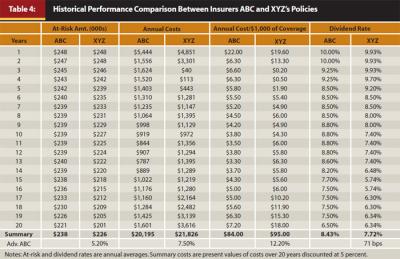
The comparison of two policies’ actual performance data even more thoroughly shows the real value of the informative illustration format with its emphasis on policy performance factors. Policy XYZ in Table 4 has, especially over the last several years, significantly greater costs and significantly lower cash value returns. While applying historical performance data should only be done with a full understanding of its limitations (future investment performance being independent of past performance, and its possible inapplicability to new products), this comparison provides useful and powerful information regarding policy replacement questions.
Three important observations regarding this policy’s actual financial performance should be noted. First, this policy’s actual financial performance, along with that of all the insurer’s other policies, can be reconciled with the insurer’s actual financial performance as reported in its annual statement filed with the regulators.10 Admittedly, sufficiently precise reconciliations can be tediously challenging data collection and analysis projects, but, in contrast to some practitioners’ mistaken beliefs, they are hardly impossible. Second, attempts to misrepresent how a particular policy’s historical performance was achieved are largely self-defeating. For example, trying to overstate the policy’s average historical annual rate of return results in simultaneously overstating annual costs thereby undermining the objective of the attempt to overstate the rate, and can prove irreconcilable with company financials and its other policies’ performances. Third, financial performance on publicly marketed products is not proprietary; preserving the secrecy of such information in the life insurance marketplace merely forces consumers to unwittingly bear the costs and consequences of non-competitive policies.
Comparing Cash Value Policies with Buying Term and Investing the Difference
When life insurance policies are understood as nothing but the functioning of a stream of costs, rates of return on cash values, the insurer’s operating practices, and cash value policies’ tax privileges, it becomes relatively easy and straightforward to compare cash value and pure term policies, and to help clients understand these alternatives. While many insurers and agents produce illustrations that compare a whole life policy with buying term and investing the difference (the BTID alternative), most of their comparative illustrations do little to facilitate a consumer’s comprehension of the causes of the underlying differences.
Suppose, for example, that a 43-year-old female client wants $1 million of life insurance coverage until age 63, and is interested in assessing which alternative (a whole life policy or buying term and investing the difference (BTID)) provides the best value over this 20-year duration. Table 5 shows the usual comparative illustration values, but with the death benefits omitted (simply to save space, as they could be equal or immaterially different), and assuming the side fund grows without taxes until the end of each analyzed duration.11
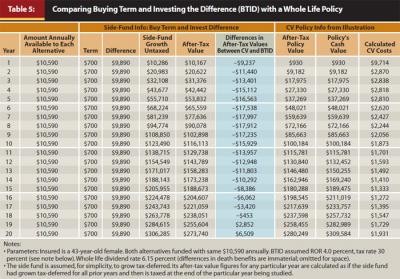
For the whole life policy, Table 5 also shows the illustrated annual costs, as these reverse-engineered figures are necessary to calculate and to explain the differences in after-tax values shown in Table 6. Table 6 shows that once the whole life policy’s cash value exceeds its cost basis, the differences in after-tax values between these two alternatives depends on three specific and quantifiable factors: (1) the value of the term cost tax shield, (2) the value forgone by any possible greater annual costs of the cash value policy, and (3) the differences between the rate of return assumptions in the two alternatives—all calculated applying simple formulas12 to the basic input data. No significance should be attached to this particular table’s results.
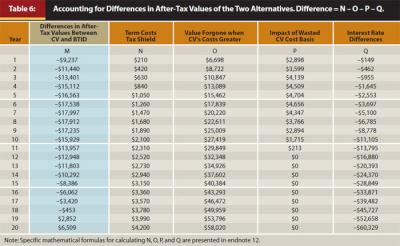
This analytical perspective and formula bring clarity to the age-old dispute between whole life and the BTID alternative. This dispute is not an ideological but rather an empirical matter. In particular, the 20th year’s $6,509 after-tax advantage of the cash value policy shown in Tables 5 and 6 provides no basis for generalization, as its advantage can be seen as arising strictly from its assumed inputs, which, given the assumed difference in rates of return between the cash value policy and the separate side fund (6.5 percent versus 4 percent), might well be deemed unrealistic or unjustified. But again, the numbers in the example have been chosen simply for educational purposes of showing how the formulas work. Table 6’s analysis facilitates comprehension of the reasons why one alternative or the other in any comparative illustration appears superior. This comprehension, just like the above comprehension of an illustration, leads to natural follow-up questions regarding the real world performance factors of the two alternatives.
The advantages of a cash value policy do not arise from it somehow avoiding the ever-increasing costs of coverage as the insured ages. Similarly, cash value policies do not inherently constitute unattractive investment vehicles (the historical investment-related performance in Table 3, where the whole life policy’s average annual rate of return over the recent 20-year period was 8.43 percent, certainly shows much conventional disparagement can be erroneous and misguided). This presentation can be very useful in confronting the misinformation that has been promoted by advocates on both sides of the dispute between whole life and term. As is so often the case with contentious issues, they can be readily resolved and dispelled with facts.
The fundamental advantages of traditional cash value life insurance arise from the product’s tax advantages. These advantages are free, non-proprietary inputs, which in a properly functioning marketplace cannot be used to extract value from an informed consumer. While whole life was created long before our current tax system, and while some of its sales agents prefer to pretend that it is not composed of term insurance, such pretensions in light of the above analysis will be futile. Whole life’s components and operational aspects are subject to mathematical analysis just like all other financial products. This analysis strongly suggests that the industry’s practices of paying large commissions for the sale of whole life and other cash value policies cannot be sustained in a marketplace of informed consumers. It also shows that assessing the competitiveness of any recommended life insurance policy, even a term policy, requires taking into account the tax advantages of a competitively priced cash value policy. The lowest-cost term policy over 20 or 30 years may not actually be the most competitive product on an after-tax cost basis—the most important basis on which to assess costs.
The costs of life insurance products comprise the following very basic components: sales-related costs, premium-related taxes, and claim costs—which include all non-sales and non-tax costs, such as underwriting expenses, administration, and profits. Of these component costs, some are subject to greater competitive pressures than others. For instance, while premium taxes are set by statute and claims are largely a function of underwriting standards and policyholder persistency, sales-related costs are potentially much more subject to market forces. The whole life policy shown in Table 3 actually had total cost over 20 years of $20,195, or $83.70 per thousand dollars of coverage (costs measured on a present value basis using a 5 percent discount rate). Of these costs, approximately 11 percent were for taxes paid by the insurer, 42 percent were for claims, administrative costs, etc., and 47 percent were sales related. (A table at the end of this article’s online appendix, at www.FPAnet.org/Journal/Sept12Appendix, shows the annual costs documenting these numbers.) Clearly, when the transparency provided by the informative illustration becomes pervasive, cash value policies with lower-than-traditional sales loads could become increasingly attractive.
Summary
We began by noting that current policy illustrations do not facilitate comprehension of a policy’s financial mechanics. Problems were identified with widely used policy analysis approaches (the NAIC’s, the Linton yield, Belth’s, and others). An informative illustration was created from a commonly used illustration, transforming it by revealing its inherent cost and rate assumptions. From such understanding, consumers’ demand for relevant additional information naturally rises.
Disclosure of life insurance, like that of virtually any financial product, has fundamentally been a two-step process: (1) provide a description of how the product or illustration works, and (2) provide performance information so that one can assess and search for competitive performance. The informative illustration shown in Table 2 achieves the first step. Tables 3 and 4 provide examples of some of the necessary performance information to complete the second step.
Using the analytical framework of a policy’s financial mechanics—as a system with a stream of annual costs and annual rates of return—a comparison of whole life with the alternative of buying term and investing the difference brings meaningful insight to this age-old controversy. A second example, available in the online appendix at www.FPAnet.org/Journal/Sept12Appendix, applies the informative illustration approach to a currently popular guaranteed no-lapse universal life policy. The informative illustration of a GNL policy makes clear this type of policy’s stark comparative cost differences with alternative policies’ costs. This insight reminds us that no one should buy a financial product they do not understand.
For clients’ in-force cash value policies, planners can transform any insurer-provided illustration into an informative illustration, and certainly should do likewise for any contemplated new purchase. Then planners can engage in financial analysis of life insurers’ operations to assess the likely competitiveness of the insurer’s future performance and that of its policies. These steps enable financial planners and agents to provide better advice to their clients, and help clients better understand life insurance matters.
Practitioners usually don’t assess the financial performance of life insurers’ policies with anything like the sophistication of financial analysis routinely applied to equities, bonds, mutual funds, or other important financial products. Now, however, financial planners and agents who understand the vital role risk management plays in financial planning but have been unsatisfied by non-transparent insurance products, can apply the analytical structure of an informative illustration to motivate and facilitate their work.
Endnotes
- Faucett, Judy, et al. 1992. “Final Report of the Task Force for Research on Life Insurance Sales Illustrations Under the Auspices of the Committee for Research on Social Concerns.” Society of Actuaries.
- Vanishing premiums that didn’t vanish were simply the most blatant problems with illustrations from the high interest rate era of the 1980s and 1990s. The fundamental problem, as the Society of Actuaries report demonstrates, is how, if in any way, illustrations should be used, given that they are not meant as credible figures upon which decision makers can rely.
- Other illustration-related reforms, such as regulations prohibiting the most egregious illustration practices of the era, have not resulted in the provision of necessary information any more than the 1970 regulation prohibiting policy comparisons based on the sum of annual or net premium resulted in more informative agent presentations.
- For a leading life insurer’s online ranking of its policy vis-à-vis its sales illustrations versus selected competitors’ illustrations, see www.BreadwinnersInsurance.com/rankingsbyillustrations.
- Linton, M. Albert. 1964. “Life Insurance as an Investment” in Life and Health Insurance Handbook. 2nd ed. Davis W. Gregg, ed. Homewood, IL: Richard D. Irwin Inc.
- Belth, Joseph. 1975. “Information Disclosure to the Life Insurance Consumer.” Drake Law Review 24: 727–752.
- Smith, Michael. 1982. “The Whole Life Insurance Policy as an Options Package.” Journal of Risk and Insurance 49: 583–601; Walden, Michael. 1985. “The Whole Life Insurance Policy as an Options Package: An Empirical Investigation.” Journal of Risk and Insurance 52: 44–58. Michael Smith in 1982 presented the perspective that a whole life policy is a package of options. Michael Walden’s 1985 empirical study makes the mistake of analyzing illustrations as if the illustrations were the policies themselves—a mistake common for those who are not well acquainted with the industry’s practices, as Walden readily admitted—and is therefore quite flawed analysis. Obviously, the list of all the “option-like” aspects of a cash value policy (borrowing privileges, or, on whole life policies, applying dividends to purchase paid-up additions) can be listed when comparing policy costs and benefits. Again, calling a policy a package of options does not eliminate the need for disclosure of the cost of the package of options.
- Fechtel, R. Brian. 2002. “New Perspectives on Age-Old Controversies About Buying Whole Life or Term and Investing the Difference.” Journal of Insurance Regulation 21: 3–24.
- The costs and rate of return calculations are shown net of investment management costs. Just as when one applies the informative illustration approach to a variable life insurance policy illustration, where one has a clear choice of reporting costs and rate information either on a gross or net basis, the same is true when analyzing traditional policies. In both cases, confusion regarding calculated figures is avoided simply by defining what is being measured. As is obvious from such cost and rate figures for a variable policy, the meaning of the combined cost and rate measurements with either definition is the same because the result being analyzed is the same. Reporting returns net of investment management costs is similar to other financial industries and products. Furthermore, such returns can be meaningfully compared with the insurer’s own investment returns on its portfolio supporting the policy and/or the entire company, and the returns on the insurer’s own capital. Additionally, insurers’ investment management costs can be readily calculated from an insurer’s annual statement filed with the NAIC.
- Let me be clear about such reconciliations. First, there can always be an idiosyncratic process that life insurers use in building a policy (some particular group of policyholders’ mortality costs could be subsidized by another group’s mortality costs or investment earnings). But aside from lapse-supported pricing approaches, precise knowledge of such idiosyncrasies is seldom necessary in real-world matters such as multi-year life insurance coverage. Such idiosyncrasies, if they have a meaningful impact, either become measurable and observable, or they remain immaterial because of their insignificance. While there can always be challenging borderline cases, the differences—for example, between competitive and uncompetitive life insurance policies’ financial performance—are typically so large that impact of insurers’ possible or hypothetical idiosyncratic processes is insignificant, at least in my own real-world advisory practice.
- The death benefit in the BTID alternative is the sum of the side fund and the term policy’s level death benefit; the whole life policy’s death benefit grows as a result of paid-up additions. The slight differences in death benefit are, in this case, insignificant and not relevant to the analysis of the fundamental cause of the different outcomes. (An alternative BTID comparison could have readily been presented to maintain exactly equal death benefits, but such is atypical of the real world where one buys and holds without annually adjusting the death benefit.) Also, for simplicity, in this discussion and Tables 5 and 6, it is assumed that the alternative investment would only be taxed upon surrender of the term policy, not annually; that is, the after-tax values shown each year for the BTID alternative assume that the side fund grew untaxed until that particular year. This assumption can be replaced with a real-world assumption in more sophisticated versions of this mathematical model, but that level of complexity is best understood only after comprehending the basics. Lastly, with respect to the possibility that coverage could be continued beyond age 62, it is noted that the term policy could be converted and the difference between these two alternatives would at that moment be the actual expense of putting the side-fund’s cash value into a permanent policy—a potential cost that is quite different from how this matter is represented in common sales presentations.
- Formulas: the amount by which the cash value policy’s after-tax cash value exceeds (falls short of) the side fund’s after-tax value is given by the following equations:
Cash value policy’s after-tax value – side fund’s after-tax value = M
M = N – O – P – Q, where the values for N, O, P, and Q are calculated as follows:
N (the after-tax value of the tax shield arising from the term costs) = Sum of all annual term costs * tax rate.
O (the after-tax value forgone when the cash-value policy’s costs are greater than the costs of only term) = (1 – tax rate) * future value of the present value of the extra costs calculated at the policy’s compounding rate. This formula involves a multi-step process of first calculating the cash value policy’s annual costs, then calculating the stream of annual amounts by which these costs differ (exceed or fall short) from the term costs, then calculating the present value of this stream of annual differences, and finally calculating the future value of this present value. While the above language assumes that the cash value policies’ annual costs will exceed those of the term policies (at least in the initial years because of premium taxes and the industry’s traditional compensation practices), there is nothing inherent in this formula that requires this, and the formula works just as well where the cash value policy actually has lower costs.
P (the after-tax impact or value of any wasted cost basis of cash value policy). If policy’s cash value is less than cost basis, then P = (the amount by which the cost basis exceeds the cash value) * tax rate. If cash value equals or exceeds cost basis, then P = zero.
Q (the after-tax value of the difference in the side fund when its compounding rate is that of the side fund versus when its compounding rate is that of the cash value policy) = (1 – tax rate) * ((value of the side fund at the side fund’s compounding rate) – (value of the side fund if the side fund had grown at the policy’s compounding rate)).
This formula clearly separates and identifies the possible causes for the after-tax values between the two alternatives to be different. It facilitates a logical discussion about the differences between term and cash value policies. Obviously, the formula can be modified to compare values when: (1) the side fund is taxed annually or (2) the cash value policy is not surrendered, but continued; that is, when its cash values remain untaxed. The upshot is that the straightforward information about the alternatives, their annual costs and compounding rates, together with the logic of the formulas, bring a very useful and beneficial perspective to the life insurance marketplace.