Journal of Financial Planning: October 2016
William J. Klinger has more than 35 years of experience in finance and software engineering. He is currently a business professor at Raritan Valley Community College. He holds an MBA in finance from the University of Chicago and a master’s degree in computer science from the University of Wisconsin–Madison.
Executive Summary
- Prior research on retirement withdrawal strategies has focused primarily on success rates. This research studied the characteristics of portfolio failures found in Monte Carlo- simulated scenarios using various retirement strategies.
- Asset balances, withdrawal rates, and portfolio returns preceding retirement failures were examined in order to identify events leading to failure early enough to rescue the portfolio. Simulating the well-known 4 percent rule, the average time to a failure was 24 years.
- An increase in the initial withdrawal rate can be an early warning sign of a future portfolio failure, as is a decrease in the real portfolio value relative to its initial value. These early warning signs were evaluated using four different withdrawal strategies.
- Guardrails using early warning signs may be added to a retirement strategy to rescue portfolios in danger of failing. Results show the trade-offs between using different early warning sign values and the resulting failure rate, retirement income, and legacy.
A primary objective of any retirement plan is to ensure that the retiree does not run out of money. To provide guidance on how to achieve that goal, numerous researchers have defined various safe withdrawal strategies, and financial institutions have created calculators designed to forecast a retiree’s assets and income over time. And yet, better ways to manage withdrawals are still being sought (Updegrave 2016).
All retirement strategies carry some risk, which is often quantified by declaring a particular strategy to be successful in some percentage of simulated retirement scenarios. When a particular retirement strategy is said to succeed, say 85 percent of the time, it means 85 percent of the scenarios tested resulted in the retiree having a positive asset balance at the end of retirement. Much of the past research has focused on scenario successes. However, what may be more important than the successes are the scenario failures.
The research presented here took an in-depth look at the failures arising from using several retirement withdrawal strategies. Failure scenarios describe situations where a retiree ran out of money. Examining these failures can provide valuable insight into early warning signs of a future failure. These early warning signs can then be used to establish guardrails that modify a retirement strategy by providing corrective action to avoid failure.
This research focused on analyzing the asset balances, withdrawal rates, and portfolio returns preceding failure. The earliest and average years in retirement when failures occurred were noted. The goal was to identify events leading to failure early enough to rescue the portfolio.
Background
The seminal research on safe withdrawal strategies was done by Bengen (1994). Bengen’s original research looked at 30-year historical periods and concluded a maximum safe initial withdrawal rate was between 4.10 percent and 4.58 percent, depending upon the asset allocation. His conclusions are now popularly referred to as the 4 percent rule, which states that a retiree may withdraw 4 percent of his or her portfolio in the first year of retirement, and adjust it for inflation in subsequent years. Even though the 4 percent rule succeeded in every historical period Bengen modeled, there was no expectation that any future 30-year period would be exactly like any of the historical periods modeled. Clearly, the 4 percent rule will fail in certain circumstances.
To address the shortcoming of using only historical periods, researchers have turned to using Monte Carlo simulations to better model possible future scenarios. Monte Carlo simulations are dependent on the assumptions used in creating the model, such as asset allocation and asset returns. Although the results vary somewhat, the 4 percent rule has usually been shown to have approximately an 85 percent success rate (Pfau 2015). This means in 10,000 simulations, there were 1,500 scenarios where the retiree ran out of money. The 85 percent success rate is interesting, but what a retiree may really want to avoid is being one of the 1,500 failures.
Approach
This research examined the failures that occur when using the 4 percent rule. The 4 percent rule was then tested, assuming portfolio returns were less than their historical averages—a so-called new normal. Then, the 4 percent rule was modified to be a 3 percent rule in order to observe the characteristics of failures using a more conservative withdrawal strategy.
Lessons learned from examining failures in the above retirement strategies were then applied to a withdrawal strategy that used a variable real withdrawal amount, Bengen’s (2001) floor-and-ceiling strategy.
Failures were analyzed and a set of early warning signs proposed. These warning signs were used to create guardrails to protect a retiree from depleting his or her portfolio. The 4 percent rule and floor-and-ceiling strategies were then retested using the proposed guardrails.
Research Methodology
A retirement strategy was specified by a withdrawal rate and an asset allocation. For each strategy tested, the initial simulated retirement portfolio was $1 million with 60 percent in equities and 40 percent in fixed income. Although the simulations used an initial $1 million portfolio, the results apply to an initial portfolio of any size.
A retirement scenario was a 30 year-by-year simulation of returns, withdrawals, and portfolio balances. Monte Carlo simulation was used to model the retirement years. At the beginning of a simulated retirement year, a withdrawal was made from the portfolio according to the strategy being tested. Transaction costs, taxes, and any other expenses had to be covered by the annual withdrawals. At the end of each simulated year, the return on the portfolio’s investments was calculated, the portfolio rebalanced, and adjustments made for inflation. This was repeated 30 times to simulate the 30 years of a single retirement scenario. If, during the scenario simulation, the portfolio balance fell below $1, the scenario was considered a failure. All strategies were tested with the same 10,000 retirement assumptions.
For each asset class, returns relative (i.e., 1+r, where r is the nominal rate of return) were assumed to be lognormally distributed, and returns were computed using a random draw. To handle correlated asset returns, the values from the random draws were multiplied by a Cholesky matrix created from historical returns. The historical returns used in this research were drawn from the Russell 3000 Index1 since its 1988 inception for stocks, with a mean lognormal return of 8.81 percent; the Federal Reserve2 for 10-year Treasury bonds beginning in 1962 with a mean lognormal return of 6.25 percent; and the Bureau of Labor Statistics3 CPI data since 1928 for inflation with a mean lognormal rate of 3.59 percent.
Portfolio returns, withdrawal rates, and portfolio values were tracked for each scenario, and the number of failures and the time to failure were recorded. Averages were calculated for the failure scenarios, and specific data was noted for the earliest failure scenario.
4 Percent Rule Failures
Simulations using the 4 percent rule with the above assumptions failed 13.7 percent of the time with a total of 1,369 failures. Figure 1 shows the distribution of the failures by year in retirement. The earliest failure scenario occurred 12 years into retirement. The earliest failure represents the worst case out of 10,000 scenarios and helps to put a lower bound on the failure period one needs to worry about.
In Figure 1, the “Failures in that Year” curve shows the percentage of all scenarios failing in any given year. The failures in any given year increased steadily to year 27 and then flattened out. The “Cumulative Failures” curve illustrates that there were no failures in the first decade of retirement; 1.4 percent of the scenarios failed in the second decade; and 12.3 percent failed in the third decade for a total of 13.7 percent. This means that if the retirement planning period was only 20 years, the failure rate would have been only 1.4 percent. The average failure occurred 24 years into retirement. At the average failure year, 24, the cumulative failure rate was 5.1 percent.
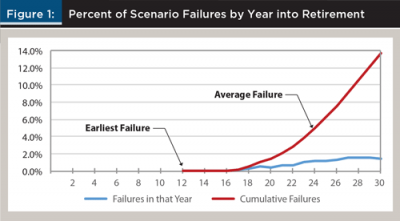
Table 1 summarizes key statistics of the 1,369 failure scenarios occurring using the 4 percent rule. The table focuses on the first decade of retirement for scenarios that ultimately failed sometime during the 30 years. No failures occurred in the first decade, so if we can identify early warning signs of a future failure, there may be time to rescue the portfolio.
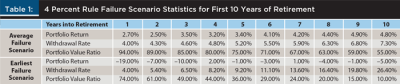
Portfolio returns are an important factor in whether a retiree runs out of money. This can be seen in the earliest failure scenario, which had negative returns in eight of the first 10 years, with the lowest returns (–19 percent, –7 percent, and –10 percent) occurring in the first three years of retirement. These negative early returns, coupled with annual withdrawals, delivered the fatal blow to the portfolio. Early negative returns are clear warning signs, but low, single-digit returns can also lead to failure.
The average returns in failure scenarios during the first 10 years of retirement were between 2.5 percent and 4.9 percent. Not shown in Table 1 is the fact that scenarios having positive returns in each of the first 10 years still failed 13.7 percent of the time. The 4 percent initial withdrawal rate and subsequent inflation overwhelmed the low portfolio returns.
In the average failure scenario for this strategy, the withdrawal rate started at 4 percent, increased to 4.8 percent in the fourth year, exceeded 6 percent in eight years, and was more than 7 percent in year 10. A withdrawal rate of 4.8 percent is a 20 percent increase over the initial 4 percent. In the earliest failure scenario, the withdrawal rate rose rapidly in the first 10 years. Table 1 shows the withdrawal rate exceeded 5 percent in the earliest failure scenario in only the second year, 6 percent in three years, and more than 26 percent after 10 years.
Table 2 shows the impact of increasing withdrawal rates. The increases in withdrawal rates shown in Table 2 are not single-year increases, but reflect the cumulative effects of low returns and increasing withdrawals. If at any time in the first 10 years the withdrawal rate was 20 percent over the initial rate (i.e., it exceeded 4.8 percent using the 4 percent rule), the scenario failed 27 percent of the time within 21 years. If the withdrawal rate was 50 percent higher at any point in the first 10 years (i.e., it exceeded 6 percent), half of the scenarios failed.
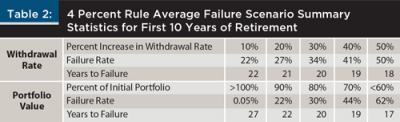
Every 10 percent increase in the withdrawal rate during the first decade resulted in failure occurring one year earlier. For example, in Table 2, if the withdrawal rate became 30 percent higher (i.e., 5.2 percent) at any time in the first 10 years, then failure would occur 20 years into retirement on average, a year earlier than if the withdrawal rate rose 20 percent.
Another way to measure the effects of asset returns, withdrawals, and inflation on a portfolio is to compare the real, inflation-adjusted value of a portfolio in a given year to the initial portfolio value; in other words, the portfolio value ratio. Table 1 shows that when using the 4 percent rule, the portfolio value ratio fell to 80 percent by year four in the average failure scenario and was only 55 percent in year 10. Although the portfolios rebounded in some scenarios, Table 2 shows that when a scenario had the portfolio value ratio drop to 80 percent of its initial value any time in the first decade, it would fail 30 percent of the time—more than twice the average of all scenarios. A portfolio value ratio drop to 60 percent or lower in the first decade resulted in failure 62 percent of the time.
Not only did a drop in portfolio value raise the failure rate, it also reduced the time to failure. Every 5 percent drop in the portfolio value ratio hastened failure by roughly a year. This suggests that although there was a high likelihood of failure, there may have been time to take corrective action. The earliest failure scenario was more closely examined to see if that was the case.
In the earliest failure scenario (see Table 1), the portfolio value ratio fell to 74 percent in the first year, dropped between 5 percent and 12 percent each year for the next nine years, and was 10 percent after 10 years—an obvious wake-up call. When the portfolio value ratio fell to 74 percent in the first year, there were still 11 years before failure, likely time enough to take action and avoid failure.
The question becomes, what early warning sign should be used to define a guardrail to rescue a declining retirement portfolio? It can easily be shown that for a constant, inflation-adjusted withdrawal strategy, the withdrawal rate ratio and portfolio value ratio are equivalent as early warning signs.
Let:
A(y) = nominal amount
withdrawn in year y of retirement,
y = 0 is beginning of retirement
P(y) = nominal portfolio value in year y of retirement
W(y) = withdrawal rate in year y
of retirement
I(y) = inflation factor for year y
of retirement from year 0
PVR(y) = ratio of the real portfolio
value in year y to the initial portfolio value, the portfolio value ratio
WRR(y) = ratio of the withdrawal rate in year y to the initial withdrawal rate, the withdrawal rate ratio
The withdrawal rate in year y is given by:
(1) W(y) = A(y) / P(y)
The amount of withdrawals each year is increased by inflation over the initial value.
(2) A(y) = I(y) * A(0)
In order to compare the portfolio values in real terms, the initial portfolio value is increased by the inflation factor.
(3) PVR(y) = P(y) / [I(y) * P(0)]
Rearrange (3) to get:
(4) P(y) = PVR(y) * I(y) * P(0)
Inserting (2) and (4) into (1) we get:
W(y) = [I(y) * A(0)] / [PVR(y) *
I(y) * P(0)]
The I(y) factors cancel out. Note
A(0) / P(0) is W(0) and we get:
W(y) = W(0) / PVR(y)
Then recognize W(y) / W(0) is WRR(y) and we end up with:
(5) WRR(y) = 1 / PVR(y)
Equation (5) says the withdrawal rate ratio in a given year is inversely and exactly proportional to the portfolio value ratio. This is supported by the data in the research simulation results. For example, when the withdrawal rate rose to 4.8 percent from an initial rate of 4 percent, then WRR(y) = 0.048 / 0.04 = 1.2, and then PVR(y) = 1 / 1.20 = 0.83 = 83 percent, which is exactly the value we get in the simulations. Either the withdrawal rate ratio or the portfolio value ratio can be used as an early warning sign for taking action and introducing a guardrail. Note that equation (5) holds only for constant, inflation-adjusted withdrawal strategies. Retirement strategies using variable real withdrawals are examined later.
New Normal Failures
What would failures look like in scenarios where future asset returns are less than their historical averages? What early warning signs might be used in simulations using a “new normal”? To answer these questions, simulations were run with asset returns 2 percentage points less than the historical averages for stocks and bonds. The 4 percent rule was again modeled using these new assumptions.
As expected, lower asset returns resulted in more failures. The failure rate rose from 13.7 percent to 38.7 percent. However, there were virtually no other differences in the results. The average number of years to failure went from 24 years to 23 years, and the earliest failure went from 12 years to 11 years. Like in the 4 percent rule scenarios, even if there were no negative returns in the first 10 years, the failure rate was equal to the average failure rate, 38.7 percent. The failure rate was between 36 percent and 43 percent regardless of the lowest return in the first 10 years.
Somewhat surprising was that the withdrawal rates for the average and earliest failure during the first decade using new normal returns were almost identical to those shown in Table 1, which used historical returns. The portfolio value ratios were also almost identical. This means both the withdrawal rate ratio and portfolio value ratio could be used as good early warning signs under market conditions of lower future asset returns.
3 Percent Rule Failures
Some suggest that if future returns are lower than their historical values, a 4 percent initial withdrawal rate may be too risky and a lower rate should be used (Finke, Pfau, and Blanchett 2013). To model this, the 4 percent rule was modified to use an initial 3 percent withdrawal rate. Historical asset returns were used, and the asset allocation and retirement period remained the same as for the 4 percent rule.
As one would anticipate, the risk of failure for the 3 percent rule was lower than when using the 4 percent rule. Out of 10,000 scenarios, there were 240 failures—a failure rate of 2.4 percent, compared to 13.7 percent with the 4 percent rule. The average number of years before failure was 25 years, versus 24 years with the 4 percent rule, and the earliest failure occurred after 17 years with the 3 percent rule, five years later than the 4 percent rule.
One characteristic of the failure scenarios, the failure rate, stayed relatively constant across different returns in the first decade of retirement. Using the 3 percent rule, even if the portfolio return was positive in each of the first 10 years, the strategy still failed in 2.3 percent of the scenarios. This result reinforced the observation that portfolios can fail even when returns in the first decade were non-negative, because relatively low positive returns were overcome by the withdrawal rate and inflation. Regardless of the single lowest annual return (e.g., –20 percent) in the first 10 years, scenarios failed at approximately the same rate as all scenarios.
The average failure withdrawal rate climbed from the initial 3 percent to 3.8 percent (a 26 percent increase) in year four, and was 5.8 percent (nearly a 100 percent increase) by year 10. Although those withdrawal rates were lower than those in the 4 percent rule (4.8 percent and 7.3 percent, respectively), there was a parallel. In both the 3 percent rule and 4 percent rule, the withdrawal rate increased 20 percent over the initial rate in the same four years. In other words, the withdrawal rate ratio was the same.
The average portfolio value ratios in the 3 percent rule failures were very similar to those from the 4 percent rule, differing by no more than 5 percent over the first 10 years. When the portfolio value ratio dropped below 80 percent there was an average of 23 years before failure, versus 21 years for the 4 percent rule. The portfolio value ratio profile for the earliest failure looked almost identical to the 4 percent rule shown in Table 1. Both the withdrawal rate ratio and the portfolio value ratio could serve as an early warning sign for this 3 percent rule.
Preliminary Observations
Asset return alone was not a good predictor of future portfolio failures. Portfolios exhibiting positive, yet low, asset returns during the first 10 years of retirement failed at the same average failure rate of all simulated scenarios, as the weak gains were overwhelmed by withdrawals.
The withdrawal rate ratio provided a good early warning sign of failure. An interesting finding was the withdrawal rate ratio of the average failure scenario increased at roughly the same rate in all three retirement strategies studied. For constant real withdrawals, the portfolio value ratio was shown to be equal to the inverse of the withdrawal rate ratio and also served as a good early warning sign.
The above findings held for constant real withdrawal strategies. Next, the same methodology was used to analyze a variable rate withdrawal strategy.
Floor-and-Ceiling Failures
In an attempt to increase the success rate of his basic 4 percent rule, Bengen (2001) defined the floor-and-ceiling strategy. The floor-and-ceiling strategy defines a fixed percentage for the withdrawal rate each year. This helps protect against failures by reducing the nominal withdrawal amount in periods where the portfolio value declines. To avoid too great a variation in withdrawals over time, Bengen established limits where the real withdrawal amount would not rise more than 20 percent from the initial year’s withdrawal, the ceiling, nor fall more than 15 percent, the floor. This strategy was simulated using a withdrawal rate of 4 percent and the same assumptions and methodology used earlier.
The floor-and-ceiling strategy failed in 8.1 percent of the scenarios, a 4.6 percentage point improvement over the 4 percent rule. In the 813 scenario failures, the average failure occurred after 25 years, and the earliest failure occurred in the 14th year. Consistent with earlier findings, no matter what the lowest asset return was in the first decade, scenarios failed at the average rate of all scenarios.
In the first 10 years, the withdrawal rate for the average failure scenario was within 0.6 percent of the 4 percent rule (results shown in Table 1). The portfolio value ratio for the average failure was also almost identical to the 4 percent rule, with at most a 1.5 percent difference.
While putting a ceiling on the withdrawal rates had the positive impact of reducing the failure rate over the 4 percent rule, the profile of the average failure using the floor-and-ceiling strategy remained similar to that in the 4 percent rule shown in Table 1. The portfolio value ratio and withdrawal rate ratio could both be used with this retirement strategy as early warning indicators of future failure. Next, explicit guardrails using the withdrawal rate ratio and portfolio value ratio are examined.
Guardrails
Guardrails are an easy-to-follow system to avoid portfolio failures. A guardrail can be applied to a retirement strategy specifying a reduction in the withdrawal rate to be taken when an early warning sign reaches a particular value. Either the withdrawal rate ratio or the portfolio value ratio can be used for an early warning sign. For the purpose of this research, withdrawal incomes were reduced by 10 percent when an early warning was reached. For example, a guardrail could be specified to decrease the withdrawal rate by 10 percent when the withdrawal rate ratio has increased 20 percent (an early warning). While other withdrawal reduction amounts could be used, 10 percent was used in this research because it was a reduction a retiree might reasonably make. A guardrail was only applied in the first 15 years of retirement with the reasoning that the withdrawal rate could increase later in retirement if the retiree was not concerned with their legacy.
Guardrail Using Withdrawal Rate Ratio
Guardrails using the withdrawal rate ratio as an early warning sign were applied to the 4 percent rule strategy. The lower the withdrawal rate ratio value used for the guardrail, the more frequent were the cuts in withdrawals. When the early warning sign for the withdrawal rate ratio was set at a higher value, the cuts became less frequent, but the chance of failure increased.
Table 3 shows the results for setting withdrawal rate ratio thresholds at different values while using the 4 percent rule. Each simulation assumed that if the withdrawal rate ratio threshold was reached, the withdrawal was subsequently reduced by 10 percent. Because the resulting failure rate was either zero or very low, additional metrics were captured in order to evaluate the use of the guardrail. As can be seen in the table, there are trade-offs between the risk of failure, retirement income, and the legacy.
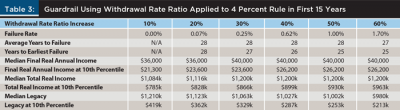
Simulations with guardrails using a withdrawal rate ratio as an early warning sign did not produce any failures until the withdrawal rate ratio reached 20 percent. Even at that level, there were only seven failures out of 10,000 scenarios for a failure rate of 0.07 percent. The average failure occurred 28 years into retirement.
The high level of success came as the result of taking cuts in retirement income. Applying a 20 percent withdrawal rate ratio early warning resulted in two reductions of income in the average scenario, a median final real annual income of $36,000, and a final real annual income of $23,600 at the 10th percentile of distribution. The median total real retirement income was $1,116,000 and was $828,000 at the 10th percentile of distribution. These should be compared to a total real income of $1,200,000, which would be achieved if there were no reductions. The median real legacy value was $1,123,000.
Adding a guardrail using a withdrawal rate ratio to the floor-and-ceiling strategy had no effect on the failure rate due to the fact that the floor-and-ceiling strategy already had protection in the ceiling limit. However, replacing the ceiling limit of the floor-and-ceiling strategy with a withdrawal rate ratio guardrail set at 20 percent did make a difference. In that case, the modified floor-and-ceiling strategy produced no failures. In addition, the median final real income increased from $37,600 to $40,700, an 8 percent increase.
Guardrail Using Portfolio Value Ratio
A guardrail can also be defined such that when the portfolio value ratio reaches a specified level, the retirement income is reduced by 10 percent. This guardrail was also applied to the 4 percent rule. Again, this rule was only applied in the first 15 years of retirement. Although there was a direct relationship between the withdrawal rate ratio and the portfolio value ratio for constant income strategies, there were differences in this case due to the fact that the retirement income was not fixed but could drop in real terms because the withdrawal amount was cut when the guardrail was hit.
Table 4 provides a summary of the results from using different portfolio value ratios as the early warning sign. Simulations using a portfolio value ratio guardrail did not produce any failures until the guardrail was lowered to 78 percent. Out of 10,000 scenarios at that level, there were only two failures, occurring 27 and 28 years into retirement.
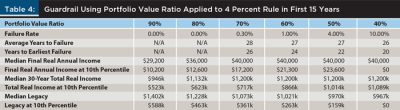
Again, the low failure rates came as the result of taking cuts in retirement income. With the guardrail set at 70 percent, there were two income reductions on average, and the median final annual income was $40,000. At the 10th percentile of distribution, the final real annual income was $17,200. The median present value of the total retirement income was $1,200,000 with a median legacy of $1,073,000. Setting the guardrail at a value higher than 70 percent resulted in more cuts producing lower income levels, while a lower guardrail produced fewer cuts with higher incomes but at an increased risk.
Simply adding a portfolio value ratio guardrail set at 80 percent to the floor-and-ceiling strategy reduced the failure rate from 8.1 percent to 6.0 percent. Going further and replacing the ceiling rule in this strategy with the portfolio value ratio guardrail at 80 percent resulted in no failures and the median final real income increased from $37,600 to $41,200, a gain of more than 9 percent.
Conclusions
This research focused on characterizing the potential failures occurring using commonly used retirement strategies with the objective of identifying early warning signs and creating guardrails to be used to save retirement portfolios from failure. It showed that a guardrail with an early warning sign could be added to a retirement strategy to reduce or eliminate the likelihood of portfolio failure.
The information in Table 1 and Table 2 can be used for guidance in assessing the risk of failure when using a 4 percent rule. For example, if in the third year of retirement the withdrawal rate rose above the average rate for failures, 4.6 percent from Table 1, to something like 4.7 percent, then it should serve as a warning indicator. Using Table 2 and calculating that a 4.7 percent withdrawal rate is a 17 percent increase over the initial 4.0 percent rate, one can see approximately 26 percent of those scenarios fail.
Asset returns alone were not a good early warning sign of failure. Even in scenarios where there were no negative returns in the first 10 years of retirement, the scenario failure rate was approximately the same as when there were negative returns. In fact, using the 4 percent rule, regardless of the lowest negative return in the first 10 years, the failure rate was remarkably constant.
The withdrawal rate ratio was a good indicator of future portfolio failure. Planners could use the data presented, together with the client’s risk propensity, to establish a corresponding guardrail. Guyton and Klinger (2006) proposed using a guardrail called the capital preservation rule as well as other decision rules to define a complete retirement withdrawal strategy. The capital preservation rule specifies cutting income 10 percent when the withdrawal rate increases 20 percent. Planners and retirees may wish to fine-tune that strategy using the data in Table 3.
The portfolio value ratio also provided an early indication of failure. When the portfolio value ratio dropped to 80 percent of the initial value in the first 10 years, the failure rate was more than twice the average failure rate. Table 2 shows the average years to failure dropped from 27 to 20. Setting a guardrail with a portfolio value ratio at a specified percent and reducing income 10 percent was an alternative to using a withdrawal rate ratio guardrail. This guardrail could be fine-tuned using the data in Table 4. An inconvenience with using the portfolio value ratio as a guardrail is the need to do present value calculations.
This research showed applying a guardrail to a retirement strategy could help ensure a financially successful retirement. Further research is required to assess the value of applying guardrails to other real, variable withdrawal strategies.
Endnotes
- Russell 3000 (^RUA) historical prices were accessed on August 31, 2015 at finance.yahoo.com.
- Federal Reserve “FRB: H15: Data Download—Build” accessed on August 28, 2015 at federalreserve.gov/datadownload/Build.aspx?rel=H15.
- Bureau of Labor Statistics’ “CPI Detailed Report” accessed on October 20, 2015 at www.bls.gov/cpi/cpid1509.pdf.
References
Bengen, William P. 1994. “Determining Withdrawal Rates Using Historical Data.” Journal of Financial Planning 17 (3): 172–180.
Bengen, William P. 2001. “Conserving Client Portfolios During Retirement, Part IV.” Journal of Financial Planning 14 (5): 110–119.
Finke, Michael, Wade D. Pfau, and David M. Blanchett. 2013. “The 4 Percent Rule Is Not Safe in a Low-Yield World.” Journal of Financial Planning 26 (6): 46–55.
Guyton, Jonathan T., and William J. Klinger. 2006. “Decision Rules and Maximum Initial Withdrawal Rates.” Journal of Financial Planning 19 (3): 49–57.
Pfau, Wade D. 2015. “Making Sense Out of Variable Spending Strategies for Retirees.” Journal of Financial Planning 28 (10): 42–51.
Updegrave, Walter. 2016. “What You Need to Know About the 4% Rule.” Real Deal Retirement, accessed March 24, 2016 at http://realdealretirement.com/what-you-need-to-know-about-the-4-rule/#sthash.9inbD8nm.dpuf.
Citation
Klinger, William J. 2016. “Guardrails to Prevent Potential Retirement Portfolio Failure.” Journal of Financial Planning 29 (10): 46–53.
Important Definitions
Withdrawal rate: the current annual withdrawal amount divided by the current portfolio value.
Withdrawal rate ratio: the withdrawal rate in a given year divided by the initial withdrawal rate. The withdrawal rate ratio is typically discussed in terms of its increase over the initial rate. For example, if the initial withdrawal rate is 4 percent, and in year five the withdrawal rate is 5 percent, then the withdrawal rate ratio in year five is 1.25 (0.05 / 0.04), for an increase of 25 percent.
Portfolio value ratio: the real portfolio value in a given year divided by the initial portfolio value. If the initial portfolio value is $1 million, but in year six it is $800,000 in real, inflation-adjusted terms, then the portfolio value ratio is 80 percent (800 / 1,000).