Journal of Financial Planning: May 2016
Stuart J. Heckman, Ph.D., CFP®, is an assistant professor of personal financial planning in the School of Family Studies and Human Services at Kansas State University. His research focuses on financial decisions involving uncertainty, especially among young adults and college students.
Editor’s note: This research was presented at the FPA Annual Conference—BE Boston 2015 as unpublished research, where it received the award from the Journal of Financial Planning and the Financial Planning Association for the best applied research presented at the conference.
Executive Summary
- A large literature from behavioral economics suggests that the risk of disability is likely overlooked and underinsured among U.S. households.
- Although the risk of disability can be transferred in other ways besides private disability insurance (DI), previous research suggests that other transfer strategies may be insufficient for many households.
- This study investigated which households are most likely to report disability and least likely to have DI. Results show that households that have less education and less access to group disability policies through their employers are most at risk.
- Using a financial planner was not a significant predictor of DI ownership, suggesting that this may be an overlooked risk exposure among planners. Suggestions for practitioners and directions for future research are discussed.
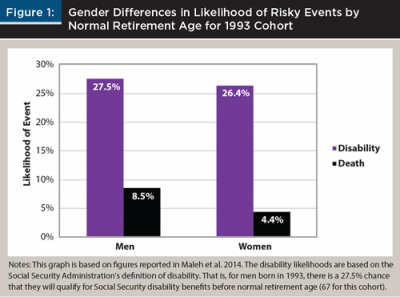
According to an actuarial note from the Social Security Administration, the risk of becoming disabled (i.e., qualifying for Social Security disability benefits) is substantially greater than the risk of dying prematurely (Maleh, Baldwin, and Schultz 2014). The Social Security Administration considers an individual to be disabled if he or she is unable “to engage in substantial gainful activity” due to an injury or illness that is expected to result in death or to last one year or more, according to its 2015 Red Book (www.ssa.gov/redbook).
For a man born in 1993 and assumed to be alive at age 20 and never been disabled, the probability of dying before normal retirement age (age 67 for this cohort) is 8.5 percent, while the probability of becoming disabled before normal retirement age, or NRA, is 27.5 percent. As shown in Figure 1, the chances are similar but slightly smaller for women; the risk of dying before NRA is 4.4 percent, while the probability of becoming disabled before NRA is 26.4 percent (Maleh et al. 2014).
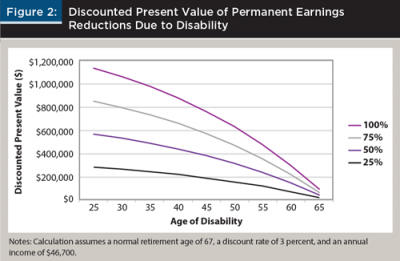
Disability can be a financially catastrophic event for households. According to the 2013 Survey of Consumer Finances, the median income for U.S. households was $46,700 (Bricker et al. 2014). Assuming a 3 percent discount rate and 45-year work life expectancy, Figure 2 shows that the cost of a total earnings loss due to disability at age 22 has a discounted present value of $1.1 million. Even a 50 percent reduction in earnings due to disability at age 22 has a discounted present value of nearly $573,000. Although the present value of lost earnings decreases as age of disability increases, an individual experiencing disability at age 55 would still lose nearly $240,000 of earnings. Financial strain is compounded when earnings losses result from disability because households typically face increased medical costs in addition to the reduced earnings. Despite the serious nature of losses resulting from disability, evidence suggests that consumers may not be accurately assessing the risk involved.
A robust literature (for a review, see Kahneman 2011) indicates that humans tend to inaccurately estimate event likelihoods, leading to concerns that U.S. households are underinsuring the disability risk. In their analysis of the 2007 Survey of Consumer Finances, Scott and Finke (2013) found that only 42 percent of household heads had private disability insurance (DI) coverage. An important question for financial planners to ask is: if the majority of U.S. households do not have DI, how are they managing this risk exposure?
Disability risk exposures can be managed by retaining the risk (i.e., self-insuring through precautionary saving), transferring the risk (i.e., buying insurance), and, to some extent, reducing the risk. Retaining the risk through self-insurance may seem like a reasonable strategy to manage the risk of becoming disabled; however, research has shown that this is typically not realistic. Chandra and Samwick (2008) analyzed 24 years of data from the U.S. Census Bureau’s Current Population Survey and estimated that no more than 20 percent of mean assets accumulated before retirement are attributable to disability risk. Given the large financial impact of becoming disabled, they argued that self-insuring through precautionary saving is not an effective strategy for managing the disability risk for most households.
Aside from DI, there are two other ways to use insurance to transfer at least part of the disability risk exposure: (1) Social Security Disability Insurance (SSDI); and (2) workers’ compensation. Although SSDI provides public disability insurance to covered workers, the coverage is widely believed to offer inadequate protection against the risk of disability for most households for several reasons. One of the most critical aspects of any disability insurance is how the insurer defines disability. According to the Social Security Administration’s 2015 Red Book, for individuals over age 18, SSDI defines disability as:
“[not being able] to engage in any substantial gainful activity (SGA) because of a medically determinable physical or mental impairment(s) that is expected to result in death, or that has lasted or is expected to last for a continuous period of at least 12 months.”
The last strategy for managing the disability loss exposure is to reduce the risk. To date, little research exists regarding the best practices for reducing the risk of disability. Therefore, the discussion section of this paper offers suggestions on ways to reduce the risk of disability and directions for future research to more fully explore this issue.The Social Security Administration defines SGA as any job in which a worker can make a minimum of $1,130 a month in 2016 for non-blind individuals. This definition is the most restrictive definition of disability because it does not consider pre-disability training and occupation. For example, if a medical doctor becomes unable to perform his or her regular duties, but can take a (significant) pay cut and perform some other SGA, the doctor does not qualify for SSDI. Furthermore, while the Social Security Administration received about 2.8 million applications for SSDI in 2012, excluding pending applications, only 31.4 percent of applications were awarded benefits (Social Security Administration 2013). Finally, although workers’ compensation does provide disability protection for job-related injuries and illnesses, 2013 stats from the Council for Disability Awareness (DisabilityCanHappen.org) show that only 5 percent of disabling injuries and illnesses occur on the job. This means that 95 percent of disabilities would not be covered by workers’ compensation.
Purpose
As the previous review of risk management strategies illustrates, DI is an important consideration for many households. Hanna and Lindamood (2010) showed that there can be significant monetary value in financial advice to consumers when the advice helps households reduce risk exposures.
Although many financial planning textbooks point out that consumers often overlook the risk of disability despite the magnitude of the losses associated with it (for example, see Insurance Planning and Risk Management published in 2015 by Keir Educational Resources), few resources clearly describe U.S. households’ loss exposures due to disability. Consequently, this study sought to evaluate which households are most at risk for financial losses due to disability by exploring the experience of disability and DI coverage among U.S. households. In this study, households most at risk were defined as being most likely to experience disability but least likely to have disability insurance.1 This information can be used by financial planners to help assess the likelihood of disability for clients and provide better advice for U.S. households.
Methodology
Data. The Survey of Consumer Finances (SCF), regarded as one of the richest datasets of U.S. household financial information, is a nationally representative dataset sponsored by the Federal Reserve Board that is administered every three years. This study used the 2013 SCF and explored household experience of disability and DI ownership (i.e., disability insurance other than Social Security). The full sample of the 2013 SCF (N = 6,015) was used to analyze experience of disability, but the analysis of DI ownership was restricted to working households (N = 4,596), because unemployed households do not have an insurable risk.2 A working household is defined as a household in which the respondent or spouse, if applicable, works at least part-time.
Dependent variables. The two primary variables of interest for this study were: (1) occurrence of disability; and (2) DI ownership. Occurrence of disability among households was nuanced in the SCF. The survey allowed respondents to give multiple answers to describe their current job status, with disability as one of the available descriptors (in the public version of the SCF, “disability” included individuals who were on temporary sick leave or maternity leave).
In this study, a single household was considered disabled if the respondent indicated disability in any response.3 For couple households, the household was considered disabled if either partner reported disability in any response. DI ownership was represented by a binary variable that distinguished households who reported having DI (coded 1) from households who reported not having any DI (coded 0). For couple households, the household was considered to have DI if at least one partner reported having DI.
Analysis
This study employed two techniques to investigate the research question. A basic descriptive analysis, including a logistic regression of disability on basic household characteristics, was used to profile which households were at greatest risk of becoming disabled. A logistic regression model based on Scott and Finke’s (2013) analysis of the 2007 SCF was also used to analyze which households were most likely to have DI. A key difference between this study and the Scott and Finke study is that the current analysis measured variables at the household level for couple households rather than measuring only the household head’s characteristics.4
For example, rather than measuring the head’s age for couple households, both partner’s ages were averaged together. How to treat couple households is an important consideration in the SCF as some variables measure only the respondent’s characteristics, which may or may not be the same person as the head (Lindamood, Hanna, and Bi 2007). Because of the implicate structure of the SCF, the logistic regressions used the repeated-imputation inference (RII) technique to adjust the standard errors (Montalto and Sung 1996).
Results
The descriptive analysis in Table 1 compares basic characteristics of all households, working households, and disabled households. Table 1 shows that disability tended to be concentrated among households with lower education; about 53 percent of disabled households had a high school diploma or less. Black households were also overrepresented among disabled households. Although black households make up approximately 15 percent of the U.S. population, they accounted for nearly 22 percent of all disabled households.
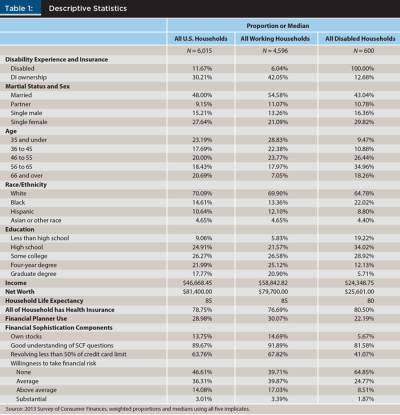
Disabled households were also much worse off financially. The median annual income for working households was about $58,800, while the median annual income for disabled households was about $24,300. The median net worth for working households was about $79,700 compared to only $25,600 for disabled households.
There were also large differences in willingness to take financial risks between the three groups. Nearly 65 percent of disabled households were not willing to take any financial risk, compared to about 47 percent for all households and about 40 percent for working households. This may suggest that this question about willingness to take risk captures ability to take financial risk, rather than measuring the underlying risk tolerance.
As shown in Table 2, the occurrence of disability was slightly lower among couple households compared to single households, and only about 2 percent of couple households experienced both partners becoming disabled.
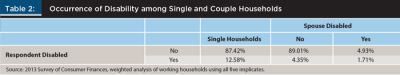
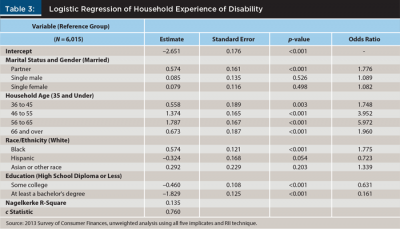
Table 3 presents the results of the logistic regression of disability on basic household characteristics. Education seems to be the most important predictor of household disability. The odds of becoming disabled for households with a bachelor’s degree or more were about 84 percent lower than households with a high school diploma or less. Even after controlling for other factors, black households were significantly more likely to report disability compared to white households. The risk of becoming disabled also increased with age, with households between 46 and 65 being much more likely to report disability than households under age 35.
The results of the logistic regression of DI ownership, presented in Table 4, indicate that households that were unmarried, over age 65, expecting to live longer, and self-employed were significantly less likely to own DI. Compared to households aged 35 and younger, households between ages 36 and 65 are more likely to own DI. Additionally, education, income, net worth, earlier expected retirement ages, and financial sophistication5 were all positively associated with DI ownership. Company characteristics were important predictors of DI ownership. Working for larger companies, companies that offered retirement plans, and having health insurance were all associated with increased odds of owning DI.
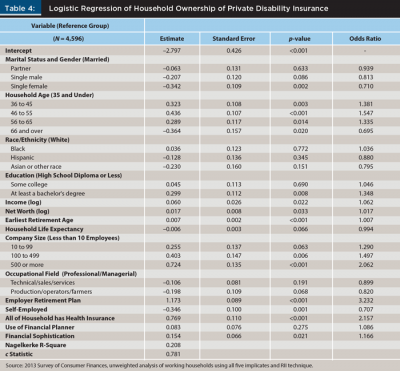
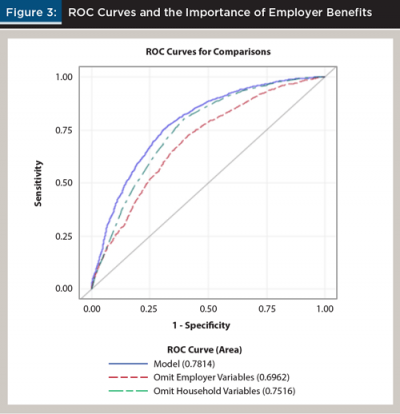
Figure 3 presents the Receiver Operating Characteristic (ROC) curves for three logistic regressions of DI ownership. ROC curves are a useful way to illustrate the explanatory power of the model—the larger the area under the curve, the better the predictive power of the model. The full model had the best explanatory power at 0.78 (the blue line). The employer variables (i.e., company size, occupation, retirement plan, self-employment, and health insurance coverage) and the household variables were then alternately omitted from the full model. When the household variables were omitted, the explanatory power of the model decreased slightly to 0.75 (the green line); and when the employer variables were omitted, the explanatory power fell to 0.70 (the red line). This indicates that the employer characteristics were relatively more important in determining DI coverage. In other words, whether or not the employer offered a group disability policy may be a key determining factor in whether or not the household owned DI.
Discussion
Households with less education had much higher odds of reporting disability and much lower odds of having DI. Because households with less education typically have lower asset levels (Bricker et al. 2014), typical financial planning fee models, such as fees on AUM, may serve as a barrier to seeking help.
Another important result from this study is that access to an employer-provided group disability policy may be the most important determinant of whether a household has DI. Financial planners should pay special attention to self-employed individuals and small-business employees, as they are less likely to have group policies. Many professional organizations and associations have access to group disability policies that may be worth exploring for self-employed individuals. Furthermore, working with business owners on the benefits of offering group disability policies to employees may be one way that financial planners can improve household DI ownership.
Interestingly, the effect of using a financial planner was not statistically significant, meaning that households who reported using a financial planner were no more or less likely to own DI than households who did not use a financial planner. This result differed from the results reported by Scott and Finke (2013) in which financial planner use was positively and significantly associated with the likelihood of DI ownership.6 One possible explanation is that the substantial economic and legislative changes since 2007 (e.g., Great Recession, Affordable Care Act) have impacted the DI decision and availability of employer benefits. Due to data limitations, such as financial planner use measurement and the cross-sectional nature of the SCF, the current methodology cannot rule out the possibility that the effect of using a financial planner is confounded by unobservable predictors of DI ownership. Future research may explore ways to sort these issues out.
Risk Reduction Strategies
Several strategies can and should be applied to help reduce the risk of disability loss exposures, both in terms of reducing the likelihood of experiencing a disabling injury or illness and of reducing the negative financial impact in the event of disability. Strategies for reducing the likelihood of disability include improving healthy behaviors, such as following a good diet, getting plenty of sleep and exercise, managing stress, etc.
Financial planners can play an important role in this area by starting the conversation about lifestyle decisions that may help reduce the occurrence of disability. The Council for Disability Awareness is an excellent resource; its website, DisabilityCan
Happen.org, has a section on ways to embrace a healthy lifestyle and provides other sources for more information. For disability at older ages, the 2008 book Health at Older Ages: The Causes and Consequences of Declining Disability among the Elderly by David Cutler and David Wise (published by University of Chicago Press) provides a helpful resource to which planners who work with a large number of elderly clients should refer. Financial planners should consider ways to include these recommendations and resources as a part of comprehensive plans.
Although physical health may currently be a topic of conversation in some client meetings, financial planners also need to become familiar with ways to discuss mental health with clients. There is a growing sentiment of the need to decrease the social stigma associated with mental illnesses and for improving mental health awareness in the U.S. (see Corrigan, Druss, and Perlick 2014, and Szabo 2014). Financial planners have an important role to play in this area by creating space for discussions about mental health and by providing referrals to mental health professionals when needed. Mental Health America (nmha.org) is another helpful resource for financial planners.
Lastly, the long-term negative impact of earnings losses due to disability may be mitigated by increasing a client’s stock of human capital, and specifically, general skills that are easily transferrable to other professions. Having a diverse human capital portfolio may help reduce the long-term financial impact of disability in the event that a client is unable to perform important functions of his or her pre-disability occupation. Investigating the best application of these strategies would be fruitful avenues for future research.
Conclusion
This study provided an investigation of disability loss exposures among U.S. households and identified several groups in the population that may be especially vulnerable to becoming disabled without having DI coverage, including households who are self-employed or lack access to a group policy through their employer and households who have a high school education or less. Although data limitations and possible endogeneity of financial planner use suggest caution in the interpretation of the multivariate results, this study found no evidence that financial planners significantly impact the likelihood of DI ownership. This may indicate that financial planners overlook the risk of disability.
The results suggest important differences in the risk exposures and the decision-making process between single and couple households; however, more detailed investigation is necessary. Examining historical trends in DI coverage would also be a productive line of research that may offer more insight into how individuals and employers adjust their behavior during economic downturns.
Endnotes
- There are other ways to define “most at risk,” such as the greatest financial losses from disability or the longest duration of disability. Data limitations prevent these analyses, but future research should explore other ways to define “most at risk.”
- Results were robust to restricting the SCF sample to households that had imputed data for the disability insurance ownership variable and are available from the author upon request.
- An alternative measure might only consider a household disabled if the respondent (spouse) reported disability as the first response. Under this more restrictive definition, about 100 fewer households, or 2 percent of the sample, would be considered disabled. The multivariate results were not affected in any material way by using this alternative measure.
- The DI logit in the current study also omitted Scott and Finke’s self-insure indicator variable, because this variable was computed as a function of assets, income, age, and retirement age—all of which were already included explicitly or implicitly (in the case of assets via net worth) in the model as covariates.
- Financial sophistication can be interpreted as a proxy for financial literacy (Huston, Finke, and Smith 2012). The measure in the current study is Huston et al.’s factor consisting of stock ownership, amount of revolving credit, understanding SCF survey questions well, and willingness to take risk.
- In this study’s preliminary analysis of the previous waves of the SCF, there was a positive and significant effect of using a financial planner in other survey years.
References
Bricker, Jesse, Lisa J. Dettling, Alice Henriques, Joanne W. Hsu, Kevin B. Moore, John Sabelhaus, Jeffrey Thompson, and Richard A. Windle. 2014. “Changes in U.S. Family Finances from 2010 to 2013: Evidence from the Survey of Consumer Finances.” Federal Reserve Bulletin 100 (4):1–41.
Chandra, Amitabh, and Andrew A. Samwick. 2008. “Disability Risk and the Value of Disability Insurance.” In Health at Older Ages: The Causes and Consequences of Declining Disability among the Elderly, edited by David M. Cutler and David A. Wise. Chicago, IL: University of Chicago Press.
Corrigan, Patrick W., Benjamin G. Druss, and Deborah A. Perlick. 2014. “The Impact of Mental Illness Stigma on Seeking and Participating in Mental Health Care.” Psychological Science in the Public Interest 15 (2): 37–70.
Hanna, Sherman D., and Suzanne Lindamood. 2010. “Quantifying the Economic Benefits of Personal Financial Planning.” Financial Services Review 19 (2): 111–132.
Huston, Sandra J., Michael S. Finke, and Hyrum Smith. 2012. “A Financial Sophistication Proxy for the Survey of Consumer Finances.” Applied Economics Letters 19 (13): 1275–1278.
Kahneman, Daniel. 2011. Thinking, Fast and Slow. New York, NY: Farrar, Straus and Giroux.
Lindamood, Suzanne, Sherman D. Hanna, and Lan Bi. 2007. “Using the Survey of Consumer Finances: Some Methodological Considerations and Issues.” The Journal of Consumer Affairs 41 (2): 195–222.
Maleh, Johanna, Robert Baldwin, and Jason Schultz. 2014. “A Death and Disability Life Table for Insured Workers Born in 1993.” Social Security Administration, Office of the Chief Actuary, Actuarial Note Number 2013.6.
Montalto, Catherine P., and Jaimie Sung. 1996. “Multiple Imputation in the 1992 Survey of Consumer Finances.” Journal of Financial Counseling and Planning 7: 133–146.
Scott, Janine K., and Michael S. Finke. 2013. “The Demand for Disability Insurance.” Financial Services Review 22 (1): 1–12.
Social Security Administration. 2013. “Annual Statistical Report on the Social Security Disability Insurance Program.” Washington, D.C.: Office of Retirement and Disability Policy, and Office of Research, Evaluation, and Statistics.
Szabo, Liz. 2014. “Cost of Not Caring: Stigma Set in Stone.” USA Today. www.USAToday.com/story/news/nation/2014/06/25/stigma-of-mental-illness/9875351/.
Citation
Heckman, Stuart J. 2016. “Financial Catastrophes Due to Disability: Which Households Are Most at Risk?” Journal of Financial Planning 29 (5): 44–51.