Journal of Financial Planning; May 2014
Ask the majority of financial advisers what is the most valuable ally for new investors seeking to maximize growth, and the power of compounding would be it. In fact, the story goes that Albert Einstein labeled compounding as the most powerful force in the universe. This may only be a story as no one has documented any such statement by Einstein. Still, there is no denying the power to grow money through compounding. Unlike so many other uncertain aspects of our financial lives, compound growth, once put to work, can become a mathematical certainty. Money invested then re-invested over time will grow and grow at exponential rates.
Unfortunately, after starting an investment plan at work or on their own, many new investors divert additional savings away from investing into other cash flow needs. Young investors may often rationalize beginning the bulk of their investing later in life when cash flow demands are perceived to be less. In the meantime, they often use excess cash flows to purchase upgraded cars, elaborate vacations, home goods, or other non-appreciating assets. Some new investors may continue to invest part of their cash flow but spend the earnings rather than reinvest. By limiting or stopping altogether their investing activities, new investors will lose out on the positive wealth-building effect that comes from compounding.
This article attempts to explain why many beginning investors seemingly walk away from adopting a compounding style of investing and therefore lose a valuable opportunity to grow their money.
The fact is that compounding of wealth over time follows a very specific mathematical curvature. The shape of this curve provides insight as to why new and specifically young investors often give up on diligently reinvesting and ultimately lose out on compounding’s effects. Investment advisers and financial planners can play an important role in educating clients on these effects, with the goal of keeping client investment plans on track.
A Closer Look at the Curve
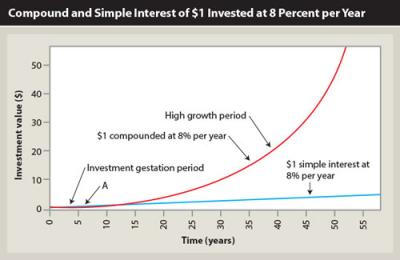
In reviewing the mathematical expression that creates the compound growth curve, one can divide the curve into two distinct segments based on the curve’s slope. The graph on page 16 shows the compound growth curve of a single $1 investment earning a constant rate of 8 percent for both annual compounded and simple interest.
The first segment of the compounding growth curve begins from the time of initial investment up to point A on the graph, and lasts approximately six and a half years. The second segment of the compounding growth curve includes the rest of the curve to the right of point A.
The dividing point between the two segments is somewhat arbitrary but does mark a reasonable dividing line based on the slope (shape) of the curve. This dividing point will vary in time depending on the investment rate assumed. Lower investment rates produce a longer first segment, while higher rates a shorter first segment. Assuming a reasonable range of achievable investment rates, this dividing point may occur within four to eight years after the initial investment.
Investing During the Gestation Period
One can think of this first segment (up to point A) as the investment gestation period, wherein the curve has a minimal amount of slope. The investment gestation period is a time when compounding returns provide limited growth potential. However, it is also the period when periodically adding new money to investments, such as through automatic payroll deposits, provides the greatest growth potential for investors.
By adding to our original investment the same amount each year, the investment growth curve forms a slope of 1. This represents a superior growth rate, compared to the investment gestation period growth rate, which has a much lower slope curvature and therefore growth.
Turning our attention to the second, high-growth segment of the compounding growth curve in the graph, we can see the curve’s slope is much greater than 1, and therefore the rate of growth far exceeds the growth achieved by making equal periodic additions.
New investors need to recognize that this first segment of the compound curve will yield minimal growth through compounding and not get discouraged. During the first four to eight years of investing, beginning investors commonly see little of the growth potential they may expect. Unfortunately we live in an era where immediate gratification is often prized to the exclusion of much greater long-term rewards.
Compound growth and how it works is a matter of mathematics; it is not an immediate miracle solution to make one rich. Many investors might try to take a shortcut by thinking they can avoid this first segment of the curve and hold off on seriously investing until real compounding growth happens in later years. This type of thinking is flawed, because the high-growth segment cannot happen unless one invests through the gestation period of the curve.
Investing During Both Segments of the Compound Growth Curve
Understanding both segments of the compounding curve can help new investors stay grounded in the reality that compounding is indeed their greatest ally. However, one must be patient and allow the mathematics of the compounding curve to work.
Investment advisers and financial planners can assist clients by educating them on these effects. Having a better understanding of how compounding works will hopefully help clients stay diligent to an investment program that ultimately maximizes their investment growth—namely, maximizing their contributions to their investment fund early during the gestation period and staying the course through the high-growth segment by compounding their investments through reinvested earnings.
Jeff C. Parsons, CFP®, is an adjunct faculty member of the finance department at California State University, Fullerton, providing instruction in the areas of personal finance, real estate, and corporate finance.