Journal of Financial Planning: May 2013
Executive Summary
- Treasury Inflation Protected Securities (TIPS) are popular investment vehicles for investors concerned with maintaining positive real returns during periods of inflation. However, the popular idea that TIPS guarantee a given real rate of return is not true. Of course, during periods of inflation, TIPS returns greatly exceed those of standard, non-inflation adjusted, Treasury bonds. Nonetheless, as inflation increases, the real realized yield of TIPS declines. At low to moderate levels of inflation, the failure to maintain the promised real return is negligible. However, with relatively high inflation and especially with hyperinflation, TIPS real realized yields fall dramatically and can even become negative.
- The explanation is that the mechanics of adjusting for inflation for TIPS limit the exactness of the inflation adjustment. The adjustment to the TIPS principal reflects CPI values from about three months prior to the adjustment. Such adjustment lags are a fact of life for any inflation-adjusted contract, at least until someone develops the foresight to provide true ex ante inflation data. The adjustment lag mechanics for any inflation protected contract limit all such contracts to being only approximate inflation hedges.
- Financial planners should realize that TIPS are just one tool in the inflation toolbox. To comply with CFP Board Practice Standard 300-1, financial planners and clients should use mutually agreed upon economic assumptions. If a hedge against inflation is appropriate to the client’s objective, TIPS can be used. However, it is important that planners do not over-promise regarding TIPS performance. TIPS do not guarantee a specified real return, and clients should understand this limitation of TIPS.
Francis Laatsch, Ph.D., CFP®, CFA, is professor of finance at the University of Southern Mississippi. He is president of the Academy of Financial Services (AFS) and is the only person to have served twice as AFS president. He is a member of FPA of the Gulf States and the CFA Society of Mississippi.
Investors have been able to purchase inflation protected bonds issued by the U.S. Treasury since 1997. Over this period, U.S. inflation, as measured by year-over-year percentage changes in the all urban consumers price index (CPI-U), has ranged from −2.1 percent (July 2009) to 5.6 percent (July 2008). Using the 153 monthly observations between January 1997 and September 2009, year-over-year percentage changes in the CPI-U showed an arithmetic average of 2.5 percent, with the CPI-U index value rising from 159.100 to 215.969 over that same period. Thus, investor experience with Treasury Inflation Protected Securities (TIPS) exists in a framework of moderate inflation levels in the United States and, for a short period, mild deflation.
But how might TIPS react to hyperinflation? This paper demonstrates that because of the lagged adjustment mechanism in TIPS, the securities fail to maintain real purchasing power at high inflation levels. The paper establishes the theoretical real returns of TIPS as if inflation adjustments could be accomplished with zero lag and compares, via simulation, those values to the ones computed using the actual lagged adjustment seen in TIPS. The results of the simulations show the adjusted with a lag real returns fall below 90 percent of the theoretical instantaneous adjustment real returns when monthly inflation reaches approximately 2.04 percent (an annual rate of 24.48 percent ignoring compounding or 27.42 percent with monthly compounding). At hyperinflation levels, the real returns of TIPS fall below zero when monthly inflation reaches approximately 22 percent (annual rate of 264 percent ignoring compounding and 987 percent with monthly compounding).
Note that ordinary, non-inflation adjusted bonds perform much worse than TIPS during periods of high inflation. TIPS are, therefore, relatively speaking, a useful hedge against inflation. But what is not true is the often made statement that TIPS guarantee a real rate of return. See, for example, Williams (2012) where he describes TIPS as being able to “lock in” real returns. It is important that planners do not over promise regarding TIPS’ performance. TIPS do not guarantee a specified real return despite inflation and clients should understand this limitation.
Background and Literature Review
In January 1997, the U.S. Treasury, following the lead of several countries, issued its first tranche of inflation protected securities. These debt instruments, patterned after Canada’s Real Return Bonds (RRBs), are known as Treasury Inflation Protected Securities (TIPS). These securities offer investors protection against inflation in two ways. First, the principal amount that buyers initially invest in TIPS is adjusted quarterly, on a lagged basis, using the U.S. Consumer Price Index (CPI). At maturity, the buyers receive an accreted principal repayment that reflects the inflated value of their initial investment. Second, the semiannual coupons paid on TIPS also are adjusted for inflation by applying the note’s stated “real” coupon rate to the inflation adjusted principal amount as of the coupon date. (DePrince and Ford, 1998, p. 47).
After a relatively slow start, interest in U.S. issued TIPS has increased substantially over the past decades. On December 31, 2012, more than $849 billion of TIPS were held by the public, representing approximately 7.7 percent of marketable debt held by the public (U.S. Treasury, 2012).
TIPS also have proved popular as a subject of academic research. Recent published work can be found in Bardong and Lehnert (2008) who examined the efficiency of U.S. inflation indexed bonds, reporting that excess returns are available in the TIPS market. Brière and Signori (2009) provided evidence that inflation-linked bonds are more highly correlated to nominal bonds in recent years, as inflation expectations are low and the inflation-linked markets have matured. They reported that the optimal portfolio weight of inflation protected bonds is, therefore, much lower than in previous years.
The analyst community also has taken note of TIPS. Arnott (2003) portrayed TIPS as essentially government issued equities. The inflation protection of TIPS mimics the real yield provided by a well-diversified equity portfolio. In Arnott’s estimation, TIPS provide a useful measure of the “cost of capital” to the government. Roll (2004) studied how TIPS relate to equity investments. Roll shared Arnott’s opinion that TIPS have much in common with equities. He concluded that the addition of TIPS to a portfolio diversified between equities and nominal bonds will benefit the risk-return profile of the portfolio. An earlier paper by Rudolph-Shabinsky and Trainer (1999) also evaluated the use of TIPS in a portfolio setting in relation to conventional bonds.
Fleckenstein, Longstaff, and Lustig (2010) questioned the very existence of the TIPS market, as they demonstrated a persistent mispricing of TIPS relative to a replicating portfolio of ordinary Treasury bonds and inflation swaps. They labeled this the “TIPS-Treasury bond puzzle,” with the gist of the puzzle being that the U.S. Treasury could reduce the cost of financing the public debt by not issuing TIPS. Because of this mispricing, they also called into question the widely accepted use of TIPS prices to provide estimates of expected inflation.
TIPS have attracted the attention of financial planners as well. Carison, Haskins, and Hansen (2005) examined TIPS versus Series I bonds and reported that I bonds provide higher returns. The one exception is when the securities are held in a tax deferred retirement plan. Lingane (2008) reported that over the period of his study TIPS had outperformed conventional Treasury bonds, but, surprisingly, TIPS had higher volatility than conventional Treasury bonds. Taylor (2012) examined whether the announcement of the inflation adjustment for Series I bonds provides information to the TIPS market. His research did not support this hypothesis, as TIPS returns did not systematically change on the event of the announcement.
Recent working papers include Grischenko and Huang (2012) who used the TIPS market to gauge the inflation risk premium for the period 2000–2007. D’Amico, Kim, and Wei (2008) looked at TIPS prices to gain insight into inflation expectations. Specifically, they reported that as the TIPS market has grown, the liquidity premium previously demanded by TIPS investors has diminished and that TIPS breakeven inflation calculations provide a useful proxy for inflation expectations. Roush (2009) documented that the costs to the U.S. Treasury of issuing TIPS has declined as the market has matured. She concluded that future issuance of TIPS will save the Treasury substantial costs as investors appear willing to pay a premium to gain inflation protection. Gürkaynak, Sack, and Wright (2008) also discussed the liquidity premium incorporated into TIPS yields in the early years of issuance. This theme, that TIPS markets have performed better in the last few years, is supported also by Haubrich, Ritchken, and Pennachi (2009) in their theoretical paper devoted to developing a model of the term structures of both nominal and real interest rates.
Smith (2009) compared two types of inflation adjusted securities: “P-Linkers” and “C-Linkers.” P-Linkers periodically adjust the principal of the bond to reflect inflation, while C-Linkers adjust the coupon of the bond. Smith noted on page 3 of his paper that, “The ‘indexation lag,’ the time between measuring the price index and adjusting the cash flow on the bond, is an obvious problem that will be neglected [in his study].” The study of indexation lag is, of course, the focus of this paper. TIPS are P-Linkers, so this current paper will restrict its focus to principal adjustments. However, future research into the consequences of the response of C-Linker bonds to hyperinflation may prove rewarding.
Barnes et al. (2009) discussed the objectives of TIPS as: (1) hedging real interest rate risk, (2) hedging inflation risk, and (3) providing an indicator of the term structure of expected inflation. The focus of their paper was on potential improvements to the reference indexes used to proxy for inflation. They noted that, by construction, TIPS provide a certain pre-tax real return, and as repeated several times in their paper, that TIPS allow investors to “lock-in” a real rate of return with certainty.
However, as I make clear in the following sections, this is not exactly the case. And it is far from the case if hyperinflation occurs.
Description of the Simulations
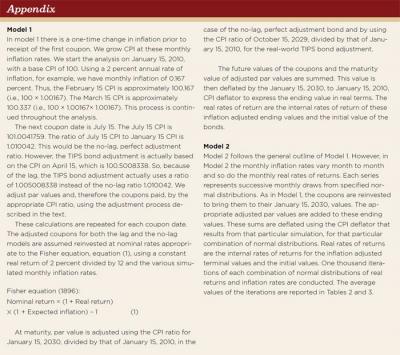
This research takes two approaches to simulating the impact of indexation lag on real returns of TIPS. Both approaches lead to essentially the same conclusions. In the first approach, I model a 20-year TIPS bond issued January 15, 2010, with coupons paid each subsequent July 15 and January 15 until the bond matures January 15, 2030. The coupon rate of the TIPS bond is 3 percent, which means that if the TIPS bond inflation adjustments maintain the purchasing power of the bond, the real, pre-tax return on the bond will be very close to this same 3 percent. Assuming that the TIPS bond is sold at par and that initial expected inflation is 2 percent, the yield-to-maturity of the TIPS bond at initial issue is approximately 5.005 percent. To provide contrast, I also simulate the returns on a standard Treasury bond issued January 15, 2010, maturing January 15, 2030, with a coupon of 5 percent, an assumed issue price of par, and a yield-to-maturity at initial issue of 5 percent.
To demonstrate the response of the two bonds to realized changes in inflation, I calculate the realized yield of holding each bond to maturity (horizon return) both on a real return basis and a nominal return basis. However, in this paper, I only report the real returns. Nominal results are available from the author upon request. To know the realized yield, the simulations must establish the rates at which the coupons are reinvested. I do so in two ways. In the first approach, I simulate realized inflation using a highly stylized and simple approach. I assume that inflation changes immediately after issue and does not change again until maturity. The second approach, using more complex adjustments, is described in a later part of this section of the paper.
At each coupon date, the simulations invest each coupon and the cumulative value of previously received coupons into six-month pure discount instruments. The model relies on the Fisher (1896) equation to estimate these six-month reinvestment rates as in:
Nominal return = (1 + Real return) X (1 + Expected inflation) – 1 (1)
The initial simple model assumes that the real returns implied by equation (1) are constant and that expected inflation is equal to the inflation value occurring just after initial issue as described above. This approach calculates the future values at the end of year 30 for these reinvested cash flows and adds the last period inflation-adjusted coupon and par value to the reinvested cash flows. I then deflate the future value by the ratio of the ending period CPI value divided by the base CPI. The internal rates of return that are implied by the initial investment values and the end period inflation-adjusted values provide the estimates of realized real returns. By construction, the real return on the “imaginary” zero adjustment lag bonds will be constant. One can then focus attention on the point of this article as any deviation from this “perfect adjustment” real return is, again by construction, solely resulting from the indexation lag of the TIPS adjustment process.
The second approach allows for variation in the reinvestment rates for any given iteration. This approach uses Monte Carlo simulations of inflation rates and, with separate random draws, Monte Carlo simulations of real rates of return. For each iteration, the simulations make monthly random draws from normally distributed populations with various means and standard deviations. For each iteration of the simulation, the six-month inflation history at each coupon date is constructed by compounding the monthly inflation draws. Similarly, the simulated six-month real return history at each coupon date is used to give an estimate of the monthly compounded real rate of return. Again assuming that the nominal reinvestment rates at each coupon date are as in the Fisher equation, with the most recent values of the real return and realized inflation substituting for next period’s expected real return and inflation, generates the reinvestment rates for the simulations.
Higher inflation is likely to increase the uncertainty of inflation and force an increase in the real return to compensate for this greater uncertainty. I thus model two levels of uncertainty of real returns. A low volatility of real returns environment supposes that the real returns are distributed N(0.03, 0.0001). I model the higher volatility environment by postulating that real returns are distributed as N(0.03, 0.10) and a further set of iterations are N(0.05, 0.10). As reported below, I model several levels of inflation but the standard deviation of inflation is kept steady at 10 percent.
Results of the Simulation
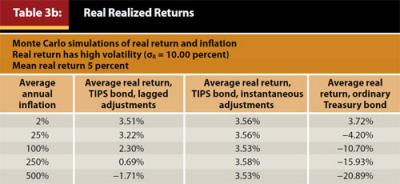
Table 1, Table 2, and Table 3 report the results of the simulation. Table 1 provides the real realized horizon returns for the one-time change simulation. As expected, at moderate to low inflation rates, TIPS return approximately the 3 percent real return consistent with the coupon of the TIPS bond. Also, at these relatively low levels of inflation, the difference between the real returns based on the actual structure of existing TIPS (column 2) and the real returns under our hypothetical instantaneous adjustment structure (column 3) are trivial. Note that the real returns for the hypothetical structure are 3.03 percent by construction. Also, as expected, ordinary Treasury bonds are dramatically affected by increased inflation, even at relatively low levels of inflation. This confirms the fact that TIPS are useful hedges, or at least partial hedges, against inflation.
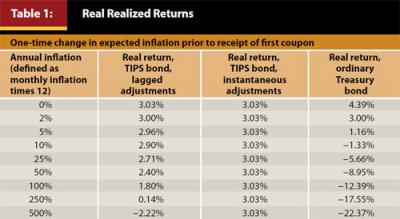
But TIPS do not provide a guaranteed real rate of return. At about 25 percent inflation, the real return on the lagged adjusted TIPS falls to only about 90 percent of the real return target of 3 percent. At higher inflation rates, such as 100 percent and above, the real returns of the lagged adjusted TIPS falls dramatically, becoming negative if monthly inflation reaches approximately 22 percent (annual rate of 264 percent ignoring compounding and 987 percent with compounding).
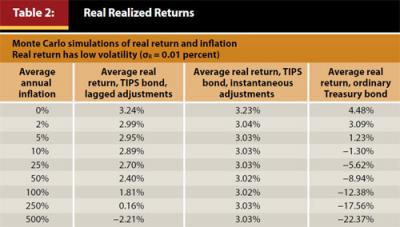
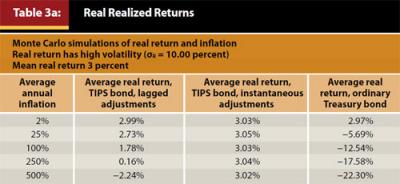
Table 2 and Table 3 report results based on the more complicated and realistic simulation, which incorporates Monte Carlo simulations of monthly real returns and monthly inflation. The pattern in each table is similar to Table 1, which supports the conclusion that the failure of the lagged adjusted TIPS to maintain a 3 percent real return results from the lagged nature of the adjustment process rather than the limitations of the simulations.
Table 2 is based on random draws of monthly real returns from an N(0.03, 0.0001) distribution, representing a low volatility environment for real returns. Inflation is simulated as monthly draws from N(µ, 0.10) distributions where µ reflects the average annual inflation rates in column 1. Again, in the absence of lags in the adjustment process, real returns maintain the promised 3 percent return level (column 3). However, as inflation increases, real returns for the lagged adjusted TIPS fall (column 2) and become negative at hyperinflation rates of approximately 22 percent per month (264 percent annually ignoring compounding).
Table 3, which consists of panels a and b, tells the same story. The draws representing real returns in panel a of Table 3 are from N(0.03, 0.10) distributions. Real returns are modeled as N(0.05, 0.10) distributions in the simulations reported in panel b of Table 3. For both panels, inflation is modeled as N(µ, 0.10). The higher returns reported in panel b are a function of using a mean of 5 percent real return in the simulations reported in panel b. More information regarding the mechanics of the simulations are provided in the appendix to this paper below.
How Can Financial Planners Use This Information?
The most important practical result of this study is to inform financial planners and other investment advisers that TIPS do not lock in a guaranteed real rate of return. Despite the fact that many have used such terms in describing TIPS, planners should refrain from doing so. Clients should understand the value of TIPS and also the limitations of investing in TIPS.
CFP Board Practice Standard 300-1 states, in part, that financial planners and clients should mutually agree on issues such as economic assumptions, including expectations of inflation (CFP Board 2002). If a hedge against inflation is appropriate to the client’s objective, TIPS can be used. However, it is important that planners do not over-promise regarding TIPS performance.
Fortunately, episodes of hyperinflation are rare. However, when inflationary events occur they are extremely damaging (Watkins 2012). Few economists are forecasting hyperinflation in the U.S. dollar in the near future. U.S. financial policy and monetary policy seem to be driven more by a fear of deflation than inflation (Coy 2012). However, financial planners should keep in mind that forecasting rare events in economics is, by the nature of a rare event, difficult. The spectacular growth in many of the monetary indicators (M1 and to a lesser degree M2, the monetary base, excess reserves, etc.) causes some to speculate that a fiat money collapse is approaching (Dowd, Hutchinson, and Kerr 2012).
U.S. inflation over the next several years is generally expected to be below 2.5 percent (Federal Reserve Bank of Philadelphia 2012). Should this expectation play out, TIPS will provide a real realized return close to the return promised at the time of purchase. However, the demand for TIPS in recent years has sent the prices of these bonds up so high that their yields, defined as the nominal yield of the bonds minus expected inflation, are negative.
Conclusions
Many investors believe that TIPS “lock in” a real return no matter future inflation rates. However, the simulations in this research make it clear that this is not the case. The indexation lag that is part of the structure of the inflation adjustment produces lower real returns when inflation reaches high levels. By construction in the simulation, the theoretical instantaneous adjustment associated with TIPS provides a real return of approximately 3.02 percent at all zero and positive inflation rates. However, lagged-adjustment TIPS show declining real returns. At 10 percent annual inflation, TIPS underperform the 3 percent real return target by about 10 (real) basis points. At 27 percent annual inflation, TIPS bonds return only about 90 percent of the 3 percent real return target.
While these inflation rates are high, they are not unknown in U.S. history.¹ The United States experienced higher than 10 percent annual inflation in the late 1970s and early 1980s (Federal Reserve Bank of St. Louis 2012). Inflation of 20 percent and 30 percent and higher also has occurred during periods of intense stress in U.S. history. For example, by the end of the U.S. Civil War, Confederate currency was essentially worthless, having endured annual inflation rates of in excess of 5,000 percent (Ransom 2010; see also Watkins 2012 and Inflationdata.com 2012). The inflation rate for federal currency also was high. During the period 1861 to 1865, prices in terms of U.S. dollars essentially doubled (Ransom 2010). U.S. inflation exceeded 17 percent in both 1917 and 1918 and was about 14 percent in 1947 (Inflationdata.com, 2012).
Again, I emphasize that the important point to take away from this work is to note that TIPS, using lagged adjustments to inflation, show real returns that fall below the 3 percent coupon rate. A real rate of return equal to the coupon of a TIPS bond is not locked in. Indeed, at hyperinflation levels, the real return of TIPS can become negative. These findings are functions of the lag in adjusting the principal of TIPS for inflation. However, it is also obvious from the results that TIPS outperform ordinary Treasury bonds in periods of inflation. The ordinary Treasury bond in the simulations exhibits negative real returns when annual inflation approaches 10 percent (about 0.8 percent per month), a far more likely outcome than inflation of 22 percent per month.
Endnote
- For planners or clients who have an interest in periods of hyperinflation, Thayer Watkins of San Jose State University maintains www.sjsu.edu/faculty/watkins/hyper.htm, which covers, among other topics, episodes of hyperinflation. As Watkins shows, episodes of hyperinflation are rare, but almost every hyperinflation episode ends badly.
References
Arnott, Robert D. 2003. “The Mystery of TIPS.” Financial Analysts Journal 59 (5): 4–7.
Bardong, Florian, and Thorsten Lehnert. 2008. “TIPS and Inflation Expectations.” Applied Economics Letters 15 (7): 513–517.
Barnes, Michelle, et al. 2009. “A TIPS Scorecard: Are TIPS Accomplishing What They Were Supposed to Accomplish? Can They Be Improved?” Boston University School of Management Research Paper No. 2009-10. http://ssrn.com/abstract=1467196.
Brière, Marie, and Ombretta Signori. 2009. “Do Inflation-Linked Bonds Still Diversify?” European Financial Management 15 (2): 279–297.
Carison, Steven J., James P. Haskins, and Kenneth A. Hansen. 2005. “Yield and Cash Value Differences among TIPS, Series I Bonds, and T Bonds in Taxable and Tax-Deferred Plans.” Journal of Financial Service Professionals 59 (5): 50–58.
CFP Board. “CFP Board’s Standards of Professional Conduct, Practice Standards.” www.cfp.net/for-cfp-professionals/professional-standards-enforcement/standards-of-professional-conduct.
Coy, Peter. 2012. “Five Charts That Show Deflation Is a Growing Threat.” Bloomberg Business Week (June 5). www.businessweek.com/articles/2012-06-05/five-charts-that-show-deflation-is-a-growing-threat.
D’Amico, Stefania, Don H. Kim, and Min Wei. 2008. “Tips from TIPS: The Informational Content of Treasury Inflation-Protected Security Prices.” BIS Working Paper No. 248. http://ssrn.com/abstract=1120329.
DePrince, Albert E. Jr., and William F. Ford. 1998. “The U. S. Treasury’s Inflation-Protected Securities (TIPS): Market Reactions and Policy Effects.” Business Economics 33 (1): 47–53.
Dowd, Kevin, Martin Hutchinson, and Gordon Kerr. 2012. “The Coming Fiat Money Cataclysm and the Case for Gold.” The Cato Journal 32 (2): 363–388.
Federal Reserve Bank of Philadelphia. 2012. “Fourth Quarter 2012 Survey of Professional Forecasters.” www.phil.frb.org.
Federal Reserve Bank of St. Louis. 2012. Economic Data. http://research.stlouisfed.org.
Fisher, Irving. 1896. “Appreciation and Interest.” Publication of the American Economics Association 11 (4).
Fleckenstein, Matthias, Francis A. Longstaff, and Hanno Lustig. 2010. “Why Does the Treasury Issue TIPS? The TIPS-Treasury Bond Puzzle.” The National Bureau of Economic Research No. 16358 working paper.
Grischenko, Olesya V., and Jing-Zhi Huang. 2012. “Inflation Risk Premium: Evidence from the TIPS Market.” http://ssrn.com/abstract=1108401.
Gürkaynak, Refet S., Brian P. Sack, and Jonathan H. Wright. 2008. “The TIPS Yield Curve and Inflation Compensation.” Federal Reserve Board. www.federalreserve.gov/pubs/feds/2008/200805/200805pap.pdf.
Haubrich, Joseph G., Peter H. Ritchken, and George Pennachi. 2009. “Estimating Real and Nominal Term Structures Using Treasury Yields, Inflation, Inflation Forecasts, and Inflation Swap Rates.” http://ssrn.com/abstract=1361219.
Inflationdata.com. 2012. http://inflationdata.com/Inflation/Inflation_Rate/HistoricalInflation.aspx.
Lingane, Peter James. 2008. “Benefits and Management of Inflation-Protected Treasury Bonds.” Journal of Financial Planning 21 (9): 60–68.
Ransom, Roger L. 2010. “The Economics of the Civil War.” Economic History Association. http://eh.net/encyclopedia/article/ransom.civil.war.us.
Roll, Richard. 2004. “Empirical TIPS.” Financial Analysts Journal 60 (1): 31–53.
Roush, Jennifer E. 2009. “The ‘Growing Pains’ of TIPS Issuance.” FEDS working paper No. 2008-08. http://ssrn.com/abstract=1327109.
Rudolph-Shabinsky, Ivan, and Francis H. Trainer Jr. 1999. “Assigning a Duration to Inflation-Protected Bonds.” Financial Analysts Journal 55 (5): 53–59.
Smith, Donald J. 2009. “Alternative Designs for Inflation-Indexed Bonds: P-Linkers vs. C-Linkers.” Boston University School of Management research paper No. 2009-15. http://ssrn.com/abstract=1364404.
Taylor, Don A. 2012. “Series I Savings Bonds Announcement Effects on Treasury Inflation-Protected Securities.” Journal of Financial Service Professionals (July): 67-72.
U.S. Treasury. 2012. “Monthly Statement of the Public Debt of the United States.” (December). www.treasurydirect.gov/govt/reports/pd/mspd/2012/opds122012.pdf.
Watkins, Thayer. 2012. www.applet-magic.com/watkins.htm.
Williams, Rob. 2012. “TIPS for Inflation Protection Today.” Schwab Center for Financial Research.
Citation
Laatsch, Francis. 2013. “Inflation, Hyperinflation, Adjustment Lags: Why TIPS Don’t Guarantee Real Rates of Return.” Journal of Financial Planning 26 (5): 54–59.
