Journal of Financial Planning: May 2013
Executive Summary
- The focus of this research is on enhancing the returns of socially responsible investment (SRI) portfolios by constructing minimum variance small-basket portfolios.
- Results suggest that individual investors and professional financial planners, on behalf of their clients, can realize enhanced performance relative to SRI funds that contain a large number of stocks by constructing minimum variance portfolios that generally contain fewer than 10 stocks.
- Over the 10-year period from 2002 through 2011, which is a function of the availability of SRI fund return data, the average annual excess returns for the minimum variance small-basket portfolios range from 2.59 percent to 6.99 percent relative to the larger SRI funds from which the small-basket funds are constructed.
- Measures of total risk and downside risk further support the enhanced performance of the minimum variance small-basket portfolio strategy.
- Perhaps most importantly, the minimum variance small-basket strategy described in this paper can be implemented easily by individual investors or by professional financial planners on behalf of their clients.
Glen A. Larsen Jr., D.B.A., CFA, CIPM, is a professor of finance at the Indiana University Kelley School of Business. He is a graduate of Indiana University, Purdue University, and the Missouri University of Science and Technology. He has published more than 45 articles in peer-reviewed journals. His primary interests are in the areas of investment performance, asset allocation, and portfolio management.
The supply of and the demand for socially responsible investment (SRI) portfolios is expanding. At the end of 2011, the Social Investment Forum reported that more than $3 trillion worth of assets in the United States were under management utilizing some form of SRI screening. Further, SRI professionally managed assets have increased by more than 34 percent over the past six years, while the broader pool of professionally managed assets has grown by only 3 percent over the same period.
Potential assets may be screened for inclusion (positive screens) in an SRI portfolio based on criteria such as environmental responsibility, quality of employee relations, or record on product safety. Assets may also screen for exclusion (negative screens) based on a company’s involvement in promoting, for example, alcohol, tobacco, gambling, or involvement in the defense industry. Extensive SRI screening is often beyond the ability of most individual investors who are constrained by data, ability, and time. As such, many individual investors, and some financial planners, take a passive approach to SRI by purchasing SRI funds, comprising a large number of individual stocks that have been screened for particular SRI attributes, rather than actively building their own SRI portfolios.
The passive approach is consistent with the efficient market hypothesis, which is the notion that stock prices already reflect all available information. Active portfolio management, on the other hand, is the attempt to improve investment performance either by identifying mispriced securities or by changing the assets and/or asset weights in a portfolio over time. The argument for active management is that markets are not perfectly efficient. The sheer size of the investment analysis industry implies only near-efficiency in the financial markets and that profit opportunities may exist for astute investors. If active management is a viable portfolio strategy, it may be possible for SRI portfolios constructed from a few well-chosen stocks (small-basket portfolios) to show a consistent pattern of improved performance relative to larger, more diversified SRI portfolios of similar stocks.
Many individual investors and active portfolio managers often construct portfolios using a limited number (small basket) of stocks. An example of a successful small-basket approach to portfolio construction is described by Williams (2012) in his Barron’s article, “A Small Basket of Big Stocks.” J. Dowe Bynum, a co-portfolio manager of the Birmingham, Alabama-based Cook and Bynum Fund (ticker: COBYX), and his partner Richard Cook, often hold fewer than 10 stocks at any given time and are willing to stake 20 percent or more of the portfolio on a single stock. The Williams article stated that, “During the past three years, the fund has generated a 15.7 percent annualized return, which beats the average blended large-cap fund tracked by Morningstar by almost 5 percentage points.”
Another professional viewpoint that supports the small-basket concept in terms of a small number of stocks driving fund performance was provided by Conway (2012) in another Barron’s article, “Keeping It Simple.” Matthew Reiner of Wela Strategies was quoted in the article as saying that in analyzing a fund for investment he wants to see the top 10 or 15 holdings (in any fund) and how many of those holdings compose the top 50 percent of the fund. Reiner stated, “You have to look at composition first—everything else is what I call contamination. It (analyzing a fund) comes down to composition and contamination … you need to figure out if you want to hold the top holdings because the other 200 to 500 positions are nothing more than 1-percenters that contaminate the returns of the big drivers.”
According to traditional financial theory, the small-basket approach conflicts with the argument that the loss of diversification from constructing a portfolio from a small number of stocks is unlikely to be offset by an increase in return-to-risk performance relative to a well-diversified portfolio constructed from a large number of stocks. While it is true in the context of modern portfolio theory (MPT) that limiting the pool of available investments cannot result in an ex post (based on realized returns) efficient frontier that provides a lower risk-to-return ratio than the market portfolio, actual investment portfolios are formed on an ex ante basis and the true market portfolio is not observable.
Financial theory also indicates that higher risk requires higher expected returns. If a small-basket portfolio generates a higher return it could be because of a higher level of overall portfolio risk. The historical performance of different asset classes over the long term is indeed consistent with the theory that greater risk is associated with greater returns. However, it appears that this principle does not always extend to individual equities. Many academic studies, which are cited in the next section, indicate that portfolios composed purely of low-volatility stocks tend to outperform portfolios of high-volatility stocks over the long term. This phenomenon is usually interpreted to imply that low-volatility stocks have higher returns, on average. Because this conflicts with traditional financial theory, it is usually referred to as the “low-volatility anomaly.”
Just as investor interest in SRI is growing, investor interest in low-volatility-type equity strategies is increasing. Billions of dollars have flowed into low-volatility equity portfolios over the past few years. For instance, Banner, Papathanakos, and Whitman (2012) report that by 2011 pension funds and other institutions had invested almost $10 billion in low-volatility U.S. equity strategies, up from virtually nothing in 2005. The same research shows that the story has been similar outside the United States, with more than $6 billion invested in low-volatility equity strategies in Europe alone (Banner et al. 2012). Index providers such as MSCI, Russell Investments, and S&P offer low-volatility indexes. On the retail side, a new exchange-traded fund in the United States for 2011 was a low-volatility strategy designed to replicate the S&P 500 Low Volatility Index.
The focus of this research is on showing how returns of SRI portfolios can be enhanced by incorporating the low-volatility anomaly and the small-basket approach to portfolio construction. The primary contribution of this research is that low-volatility small-basket SRI portfolios are found to demonstrate enhanced performance relative to well-diversified SRI funds from which the small-basket portfolio stocks are selected. Perhaps most importantly, the active management low-volatility small-basket approach that is described can be easily implemented by individual investors or by professional financial advisers for their clients.
Literature Review
Even though investor interest in SRI strategies is growing rapidly, previous research studies have reported conflicting results on the performance of SRI funds compared to more traditional equity funds. Camejo (2002) and Harrington (1992), who are proponents of SRI, believe it is possible for investors to “do well” while “doing good.” Hamilton, Jo, and Statman (1993), found that the returns to socially responsible mutual funds are extremely similar to conventional mutual fund returns. The authors concluded that the market does not seem to price social responsibility characteristics, suggesting that while doing good may not allow an investor to do well relative to the benchmark, it doesn’t cost anything either.
Guerard (1997a; 1997b) suggested that it might be possible for socially responsible investing to produce higher risk-adjusted portfolio returns relative to using all available stocks in the equity universe, because both the SRI stocks and ordinary stocks must be selected on an ex ante basis. Guerard (1997b) concluded that there was no significant cost (no significant return difference) from social screening.
Some studies have focused on the performance of the Domini Social Index (Corson and Van Dyck, 1992; Shefrin and Statman, 2000). In general, these studies have found returns comparable to the S&P 500 Index. Similarly, Plantinga, Scholtens, and Brunia (2002) analyzed the Dow Jones European and Americas Sustainable Growth Indexes and found no significant differences in their mean returns relative to the all-inclusive Dow Jones Europe and Americas Indexes.
Opponents, however, argue that the pursuit of a social agenda in the capital market may require a financial sacrifice. Rudd (1981) argued that the loss of diversification introduced by social screens increases a screened portfolio’s covariation in returns unrelated to the market. Aupperle, Carroll, and Hatfield (1985) suggested that at the firm level, complying with social criteria increases operating costs that can put a firm at a disadvantage relative to non-complying rivals. Kurtz and DiBartolomeo (1996) found that at the portfolio level, not only are SRIs selecting firms that likely have higher operating costs, but they also limit their pool of available investments.
More recently, Chang and Witte (2010) provided results that support the underperformance of SRI funds relative to conventional mutual funds. They concluded that while SRIs have had a relative advantage in terms of lower expense ratios, lower annual turnover rates, and lower risk, SRIs also have exhibited lower returns and inferior reward-to-risk performance. Costa, Jakob, and Niblock (2011) suggested that SRI mutual fund managers may not be selecting the correct benchmark indexes for their funds. The results from their study indicated that SRI mutual fund managers often choose benchmark indexes that may not be a true reflection of the risk characteristics associated with the funds’ investment activities, thus misstating the funds’ risk-adjusted performance.
Previous research studies on the low-volatility anomaly provide support for including low-volatility portfolios in strategic asset allocation. Fernholz and Shay (1982) suggested a portfolio-based explanation for the low-volatility anomaly, which provides a reason for its long-term persistence. Their key observation was that compounding has a significant impact on long-term returns. When multiple stocks are combined in a long-only portfolio, the diversification effect reduces volatility and causes the portfolio to have a higher compound growth rate than the weighted average compound growth rate of the stocks in that portfolio. The difference in returns is usually small for concentrated, infrequently traded portfolios. For regularly rebalanced portfolios, however, this difference can be significant because low-volatility portfolios exhibit less downside risk than high-volatility portfolios.
Clarke, de Silva, and Thorley (2006) illustrated the practical value of large-scale numerical optimizations using return-based covariance matrix estimation methodologies, providing a new perspective on the factor characteristics of low-volatility portfolios. Going back to 1968, they found that the long-only minimum variance portfolio has about three-fourths the realized risk of the capitalization-weighted market portfolio, with higher average returns. Blitz and Vliet (2007) presented additional empirical evidence that stocks with low volatility earn high risk-adjusted returns. They reported the annual alpha spread of global low versus high volatility decile portfolios amounted to 12 percent over the 1986–2006 period. Banner, Papathanakos, and Whitman (2012) further found that defying the laws of traditional finance theory, low-volatility portfolios outperform their more volatile peers.
Data and Methodology
Much of the previous SRI research shows that SRI strategies may neither help nor hurt large, publicly traded SRI fund performance. Given the growing investor interest in SRI, a simple and transparent method for actively managing small-basket SRI portfolios that offers the potential for enhanced SRI performance might be of interest to the SRI investment community. Based on investor interest, professional observation, and consistent with previous research, this paper investigates the potential for enhancing the returns of SRI portfolios by constructing low-volatility small-basket portfolios of SRI stocks.
The low-volatility equity products offered today generally fall into one of two categories: portfolios composed of low-volatility stocks and equity portfolios with low volatility. Portfolios of the first type are usually constructed by selecting the least volatile stocks from an eligible universe, then combining them in some manner. The S&P 500 Low Volatility Index is an example of a benchmark that tracks the hypothetical value of a portfolio of this type.
The second category includes minimum variance portfolios. These are constructed by a mean variance optimization (MVO) methodology that seeks to lower or minimize the overall portfolio variance. MSCI’s Minimum Volatility Indexes are an example of the MVO methodology, which addresses portfolio risk in a more effective manner than simply constructing portfolios of low-volatility stocks because lowering portfolio risk is specifically targeted.
In this research, long-only, minimum variance small-basket portfolios (LOMVSBP) were constructed of SRI stocks using MVO methodology by drawing stocks from three large SRI funds: (1) the well-diversified TIAA-CREF Social Choice Fund (TSICX), (2) the well-diversified Domini Social Equity Fund (DSEFX), and (3) the less well-diversified Hartford Health Care Sector Fund (HIAHX).¹ The potential for the strategy to enhance performance relative to the larger publicly traded fund from which the small-basket portfolios are constructed was then investigated.
In presenting the results, and to mitigate the SRI benchmark error findings of Costa, Jakob, and Niblock (2011), the larger publicly traded fund was considered to be a valid benchmark for the minimum variance small-basket strategy. The larger publicly traded fund was assumed to be a proper benchmark for each strategy portfolio because it satisfies the requirements for a valid benchmark, as stated in the CFA Institute Certificate in Investment Performance Measurement (CIPM) program of study. These requirements stipulate that the benchmark be unambiguous, investable, measurable, appropriate, reflective of current investment opinion, specified in advance, and owned.2
The pool of stocks used in constructing the small-basket SRI portfolios was the list of primary holdings in the larger SRI fund, as shown in the individual fund’s schedule of investments. The minimum variance small-basket strategy that was used in this research, while not prohibiting individual stock analysis, does not require the individual investor or financial planner to make a qualitative judgment as to the health or future profitability for a specific company. By using the primary stocks held in a larger SRI fund, the small-basket portfolios are effectively composed of those stocks that a professional fund manager already has deemed both qualitatively and quantitatively appropriate for investment as a primary holding in the larger fund.
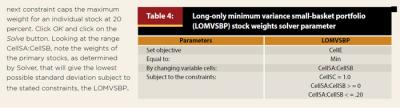
The University of Chicago Center for Research in Security Prices (CRSP) monthly return data, over the period 1995 through 2011, were used to evaluate the minimum variance small-basket strategy. These monthly returns were then used to calculate the compounded annual rate of return for each of the primary stocks (those stocks with the highest percentage holdings in the TSICX, DSEFX, and HIAHX funds). At the beginning of each year from 2002 to 2011, MVO was employed over the previous seven years of the compounded annual historical return data to solve for the set of stock weights that was used to construct the small-basket portfolio for the next one-year holding period. MVO determined the security weights in the small basket of stocks based on the historical returns and covariances of the primary set of stocks in a fund while limiting the weight in any one single stock to 20 percent of the portfolio.
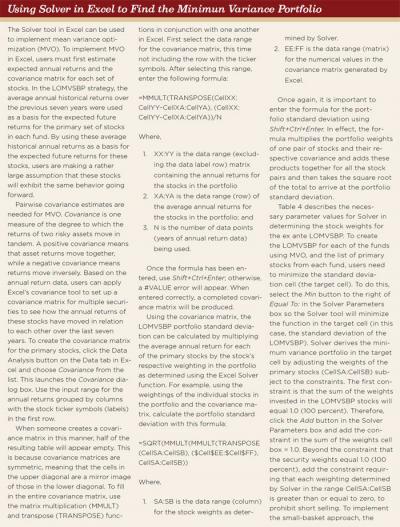
The Solver tool in Excel was used to implement MVO.³ To implement MVO in Excel, expected annual returns and the covariance matrix for each set of stocks must first be estimated. In the minimum variance small-basket strategy, the average annual historical returns over the previous seven years were used as a basis for the expected future returns for primary set of stocks in each fund. By using these average historical annual returns as a basis for the expected future returns for these stocks, a rather large assumption was made that these stocks will exhibit the same behavior going forward.
This process was continued to find the ex ante weights for the strategy portfolios from 2002 through 2011. For example, the ex ante portfolio for 2002 was constructed based on the stock weights from the ex post efficient portfolio derived using the historical return, standard deviation, and correlation data from 1995–2001. The ex ante portfolio for 2003 was constructed based on ex post efficient portfolio derived using the data from 1996–2002, and so forth. No short sales were allowed in the minimum variance small-basket strategy. Hence, the strategy can be described more correctly as a long-only minimum variance small-basket portfolio (LOMVSBP) strategy. Because the ex ante portfolios limit the weight on any single stock to 20 percent of the portfolio, the ex ante LOMVSBP generally contained only five to 10 stocks. As such, the LOMVSBP did not depend on owning a large number of stocks as in the exchange-listed TSICX, DSEFX, and HIAHX SRI funds.
It was not the intent of this research to test hundreds of possible weight constraints, as those weights constraints may not always be optimal. That is, the weight constraints presented in this research may not generate the maximum out-of-sample portfolio returns. The intent of this research was to test the potential for the LOMVSBP strategy to enhance performance relative to passive investment in SRI funds that hold a large number of securities.
Results
The first SRI large fund outperformance test using the LOMVSBP strategy was based on the TISCX fund. Table 1 shows that the strategy portfolio drawn from the TISCX fund (LOMVSBP-T) had a higher average annual return over the test period and a lower standard deviation of annual returns than the larger TISCX fund and the S&P 500 Index. Furthermore, the results were based on an annual rebalance holding fewer than 10 stocks, which, in practice, involves very little work for an individual investor. The average annual returns for the LOMVSBP-T, S&P 500, and TISCX fund were 11.40 percent, 2.99 percent, and 4.41 percent, respectively. Even after allowing 50 basis points per year in transaction costs, the LOMVSBP-T average annual returns were 6.99 percent per year greater than the large DSEFX SRI index fund. The standard deviation of the annual returns for the LOMVSBP-T, S&P 500, and TIXCX fund were 18.29 percent, 19.07 percent, and 19.86 percent, respectively.
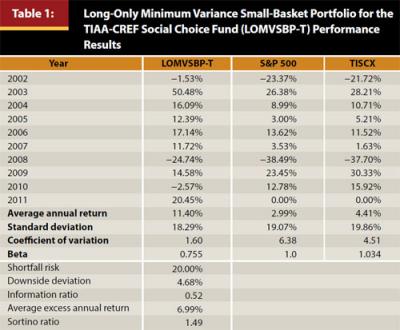
Rather than show risk-return measures, such as the Treynor or Sharpe measures, which are subject to capital market assumptions, coefficient of variation is shown, which is the standard deviation divided by the average annual return for each of the portfolios. The coefficient of variation (CV) for the LOMVSBP-T, S&P 500, and TISCX fund was 1.60, 6.38, and 4.51, respectively. The CV for the LOMVSBP-T was far lower than for either the TISCX fund or S&P 500 Index. In short, the LOMVSBP-T was a much more efficient portfolio over the 2002 through 2011 period in that it required far less standard deviation risk per unit of average annual return than either the larger TISCX fund or the S&P 500 Index.
While the standard deviation of returns is an acceptable measure of risk as long as investors equate the variability in returns around the mean return with risk, this may not be how many investors conceptualize the risk of investing given the tremendous downside risk that has presented itself in the markets over the last decade. Based on Fernholz and Shay (1982), the LOMVSBP strategy, in principle, should be characterized by lower downside risk.
Downside risk measures focus on the returns that fall below a certain value. These measures address the criticisms of standard deviation in that (1) the reference point below what investors consider a return to be risky is set according to the investment strategy of the fund rather than by using the mean return and (2) only return deviations below this target return are weighted in the measurement of risk. Downside risk statistics are based on the concept of partial, or semideviation. Semideviation is the standard deviation of the returns that fall below the mean return.
Target returns can replace the mean return in the calculation of semideviation. Examples of target return are zero (the return required to maintain principal), the risk-free return, a projected or expected rate of return the return used to forecast portfolio values to meet investment goals, the return of a valid benchmark, or the return earned by competing portfolio managers. If the reference point is changed from the historical mean to a target return, the percentage of returns falling below the target value can be measured.
This shortfall risk is the percentage of periodic returns that fall below the target return. That is, shortfall risk is the number of returns that fall below the target return over the period divided by the total number of returns and reported as a percentage. Shortfall risk represents the relative frequency of a fund earning a return below the specified target rate of return.
Downside deviation, like semideviation from the mean, eliminates from the calculation of risk the returns that contribute to positive volatility. To calculate downside deviation, identify the fund returns less than the target and take the difference of these returns to the target. Then square the differences, add the squared differences, and divided by the total number of returns. This gives the downside variance, or below-target semivariance. Taking the square root of the downside variance yields the downside deviation, which is measured in return units.
When risk is defined relative to a target return, it is appropriate to use the downside risk measures in the denominator of the reward to risk ratio. The Sortino ratio uses downside risk as a denominator and the target return as the hurdle rate in the numerator. The Sortino ratio was calculated by taking the annual average difference of the fund and the target returns and dividing by the annualized downside deviation of the fund. This measure is associated with Frank Sortino, Ph.D., of the Pension Research Institute. In this study, the return of the larger SRI fund was the target return and the return of the LOMVSBP was the actively managed fund return. The larger the Sortino ratio the greater is the annual average difference of the fund and the target returns per unit of downside risk.
An additional measure of relative performance is the information ratio. This ratio is a measure of the benchmark relative return gained for taking on benchmark relative risk. The measure of differential return over the benchmark that was used in the information ratio was the average annual value added, which is the average annual differential return between the LOMVSBP and the benchmark fund. The information ratio was calculated by estimating the value added and dividing it by the difference in the standard deviations of the LOMVSBP and the benchmark portfolios.
Table 1 lists the shortfall risk, downside deviation, information ratio, average excess return, and the Sortino ratio for the LOMVSBP-T. These values are 20.00 percent, 4.68 percent, 0.52, 6.99 percent, and 1.49, respectively. All of these downside risk measures support the enhanced performance of the LOMVSB-T relative to the larger TISCX fund.
Table 1 also presents the beta of each fund relative to the S&P 500. Empirical beta is a measure of the volatility, or systematic risk, of a security or a portfolio, in comparison to a specific market index. In this study, beta is presented as the tendency of a portfolio’s returns to respond to swings in the S&P 500 Index. A beta of 1.0 indicates that the security’s price will move with the S&P 500. A beta of less than 1.0 means that the security will be less volatile than the S&P 500. A beta of greater than 1.0 indicates that the security’s price will be more volatile than the S&P 500. For example, if a stock’s beta is 1.2, it’s theoretically 20 percent more volatile than the market. The fact that the beta for the LOMVSBP-T strategy of .755 is less than 1.0 is another way to show that the LOMVSBP-T’s annual returns were less risky in a systematic sense than the S&P 500’s annual returns. Note that the beta for the larger TISCX fund of 1.034 is greater than 1.0, which indicates that the TISCX returns were more risky in a systematic sense than the S&P 500’s annual returns.
Table 2 shows that the strategy portfolio drawn from the DSEFX fund (LOMVSBP-D) had a higher average annual return and lower annual standard deviation than the DSEFX fund and the S&P 500 Index over the test period. The average annual return for the LOMVSBP-D, S&P 500, and DSEFX fund was 7.01 percent, 2.99 percent, and 4.42 percent, respectively. Even after allowing 50 basis points per year in transaction costs, the LOMVSBP-D average annual returns were 2.59 percent per year greater than the large DSEFX fund.
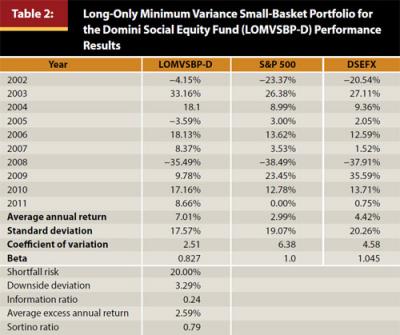
The average annual standard deviation for the LOMVSBP-D, S&P 500, and DSEFX fund was 17.57 percent, 19.07 percent, and 20.26 percent, respectively. The CV for the LOMVSBP-D, S&P 500, and DSEFX fund was 2.51, 6.38, and 4.58, respectively. The CV for the LOMVSBP-D was far lower than for either the DSEFX fund or S&P 500 Index. In short, the LOMVSBP-D was a much more efficient portfolio over the 2002 through 2011 period in that it required far less standard deviation risk per unit of average annual return than either the larger DSEFX fund or the S&P 500 Index.
Table 2 shows the shortfall risk, downside deviation, information ratio, average excess return, and the Sortino ratio for the LOMVSBP-D. These values are 20.00 percent, 3.29 percent, 0.24, 2.59 percent, and 0.79, respectively. All of these downside risk measures support the enhanced performance of the LOMVSB-D relative to the larger DSEFX fund.
Table 2 also presents the beta of each fund relative to the S&P 500. The beta for the LOMVSBP-D strategy (0.827) indicates that the LOMVSBP-D’s annual returns were less risky in a systematic sense than the S&P 500’s annual returns, whereas the beta for the large DSEFX fund (1.045) indicates that the DSEFX returns were more risky in a systematic sense than the S&P 500’s annual returns.
To investigate the LOMVSBP strategy on a less well-diversified fund, the LOMVSBP strategy was applied to a SRI sector fund, the HIAHX fund. Results are equally impressive. As with the previous two funds, MVO was used to find the ex ante HIAHX LOMVSBP (LOMVSBP-H) for 2002 based on 1995–2001 returns, standard deviations, and correlations. The same methodology was used for each year 2002–2011.
Table 3 shows that the returns generated by holding the stocks in the LOMVSBP-H strategy were significantly higher than the HIAHX fund’s return. The average annual return for the LOMVSBP-H, S&P 500, and HIAHX fund were 8.40 percent, 2.99 percent, and 2.42 percent, respectively. Even after allowing 50 basis points per year in transaction costs, the LOMVSBP-H average annual returns were 5.98 percent per year greater than the large DSEFX SRI index fund.
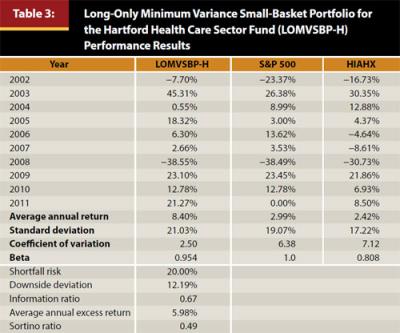
The average annual standard deviation for the LOMVSBP-H, S&P 500, and HIAHX fund were 21.03 percent, 19.07 percent, and 17.22 percent, respectively. While the standard deviation risk for the LOMVSBP-H was higher than both the S&P 500 and the HIAHX fund, the CV for the LOMVSBP-H, S&P 500, and HIAHX fund were 2.50, 6.38, and 7.12, respectively. As in the case of the LOMVSBP-T and LOMVSB-D, the CV for the LOMVSBP-H was far lower than for either the HIAHX fund or S&P 500 Index. The LOMVSBP-H had far less standard deviation risk per unit of return than either the larger actively managed HIAHX fund or the S&P 500 Index. Perhaps most importantly, the LOMVSBP-H average annual return and CV results are consistent with the low-volatility anomaly, as the weights for the LOMVSBP-H were determined on an ex ante basis using the long-only minimum variance optimization methodology.
Table 3 further shows the shortfall risk, downside deviation, information ratio, average excess return, and the Sortino ratio for the LOMVSBP-H. These value are 20.00 percent, 12.19 percent, 0.67, 5.98 percent, and 0.49, respectively. All of these downside risk measures support the enhanced performance of the LOMVSB-H relative to the larger HIAHX fund.
Conclusions
This research used mean variance optimization (MVO) to construct long-only minimum variance small-basket SRI portfolios (LOMVSBP) by drawing stocks from three large SRI funds: (1) the well-diversified TIAA-CREF Social Choice Fund (TSICX), (2) the well-diversified Domini Social Equity Fund (DSEFX), and (3) the less well-diversified Hartford Health Care Sector Fund (HIAHX). The potential for the LOMVSBP strategy to enhance performance relative to the larger publicly traded fund from which the LOMVSBP was constructed was investigated.
At the beginning of each year from 2002 to 2011, MVO was employed over the previous seven years of the compounded annual historical return data to solve for the LOMVSBP set of stock weights that would be used to construct the portfolio for the next one-year holding period. MVO was used to determine the security weights in the small basket of stocks based on the historical returns and covariances of the primary set of stocks in a fund while limiting the weight in any one single stock to 20 percent of the portfolio. The average annual excess returns for the long-only minimum variance small-basket portfolios ranged from 2.59 percent to 6.99 percent relative to the larger SRI funds from which the small-basket funds were constructed. Measures of total risk and downside risk further supported the enhanced performance of the minimum variance small-basket portfolio strategy.
While the results of these calculations were shown to enhance portfolio performance in the period analyzed, it is important to realize that results rest on the assumption that historical relationships between individual assets and asset classes will hold in the future. The period used for collecting investment returns will affect the results of similar analyses conducted in the future.
Knowing the limitations of this kind of portfolio analysis is just as important as what it might tell you. One suggestion might be for an individual investor or professional financial planner to use the LOMVSBP strategy for a portion of their investment holdings or to construct several MVP small-basket SRI portfolios from several larger SRI funds. Such a process would allow investors to build a more diversified total portfolio based on underlying fundamentals of modern portfolio theory.
It is important to recognize another potential limitation associated with this study. This research study focused on only three funds. The technique of building LOMVSBPs from a subset of stocks in other SRI funds may or may not produce enhanced returns relative to the base fund. It is possible that the LOMVSBP strategy presented in this paper may have performance enhancing capabilities if applied to many types of portfolios and not just those that focus on SRI assets. This is an area for further research.
Endnotes
- All of the stocks in the Hartford Health Care Sector Fund are approved by the General Board of Pension and Health Benefits of The United Methodist Church for socially responsible investment. See: www.gbophb.org/sri_funds/screening.asp.
- The CFA Institute CIPM curriculum defines a valid benchmark as having the following properties: Unambiguous—the identities and weights of securities constituting the benchmark are clearly defined; Investable—it is possible to forgo active management and simply hold the benchmark; Measurable—the benchmark’s return is readily calculable on a reasonably frequent basis; Appropriate—the benchmark is consistent with the manager’s investment style or area of expertise; Reflective of current investment opinions—the manager has current investment knowledge (be it positive, negative, or neutral) of the securities or factor exposures within the benchmark; Specified in advance—the benchmark is specified prior to the start of an evaluation period and known to all interested parties; Owned—the investment manager should be aware of and accept accountability for the constituents and performance of the benchmark. It is encouraged that the benchmark be embedded in and integral to the investment process and procedures of the investment manager.
- The Solver tool in Excel is used to implement mean variance optimization (MVO). Specific instructions on how to solve for the ex ante long-only minimum variance small-basket portfolio security weights are provided in the appendix below.
References
Ang, Andrew, Robert J. Hodrick, Yuhang Xing, and Xiaoyan Zhang. 2006. “The Cross-Section of Volatility and Expected Return.” Journal of Finance 61 (1): 259–299.
Aupperle, Kenneth E., Archie B. Carroll, and John D. Hatfield. 1985. “An Empirical Examination of the Relationship between Corporate Social Responsibility and Profitability.” Academy of Management Journal 28 (2): 446–463.
Banner, Adrian, Vassilios Papathanakos, and Phillip Whitman. 2012. “Enjoying the Benefits of the Low-Volatility Anomaly.” Institutional Investor (October): 55–65.
Blitz, David and Pim Van Vliet. 2007 “The Volatility Effect: Lower Risk without Lower Return.” Journal of Portfolio Management (April): 102–113.
Camejo, Peter, ed. 2002. The SRI Advantage: Why Socially Responsible Investing Has Outperformed Financially. Canada: New Society Publishers.
Chang, C. E., and H. D. Witte. 2010. “Performance Evaluation of U.S. Socially Responsible Mutual Funds: Revisiting Doing Good and Doing Well.” American Journal of Business 25 (1): 9–24.
Clarke, Roger G., Harindra de Silva, and Steven Thorley. 2006 .“Minimum-Variance Portfolios in the U.S. Equity Market.” Journal of Portfolio Management 33 (1): 10–24.
Conway, Brendan. 2012. “Keeping It Simple,” Barron’s, (November 17).
Corson, Benjamin C., and Thomas Van Dyck. 1992. “Socially Responsible Investing and Financial Return: Albatross or Scapegoat?” Journal of Investing 1 (2): 23–28.
Costa, Bruce A., and Keith Jakob 2011. “Are Mutual Fund Managers Selecting the Right Benchmark Index?,” Financial Services Review 20 (2): 129.
Costa, Bruce A., Keith Jakob, and Scott J. Niblock. 2011. “Risk-Adjusted Returns of Socially Responsible Mutual Funds: How Do They Stack Up?” The Journal of Index Investing 2 (3): 94–107.
Fernholz, Robert, and Brian Shay. 1982. “Stochastic Portfolio Theory and Stock Market Equilibrium.” Journal of Finance 37 (2): 615–624.
Guerard, John B. Jr. 1997a. “Is There a Cost to Being Socially Responsible in Investing?” Journal of Investing 6 (2): 11–18.
Guerard, John B. Jr. 1997b. “Additional Evidence on the Cost of Being Socially Responsible in Investing.” Journal of Investing 6 (4): 31–36.
Hamilton, Sally, Hoje Jo, and Meir Statman. 1993. “Doing Well while Doing Good? The Investment Performance of Socially Responsible Mutual Funds.” Financial Analysts Journal 49 (6): 62–66.
Harrington, John C. 1992. Investing with Your Conscience: How to Achieve High Returns Using Socially Responsible Investing. New York: John Wiley.
Jobson, J. D., and Bob M. Korkie. 1981. “Performance Hypothesis Testing with the Sharpe and Treynor Measures.” Journal of Finance 36 (4): 889–908.
Kurtz, Lloyd, and Dan DiBartolomeo. 1996. “Socially Screened Portfolios: An Attribution Analysis of Relative Performance.” Journal of Investing 5 (3): 35–41.
Plantinga, Auke, Bert Scholtens, and Nanne Brunia. 2002. “Exposure to Socially Responsible Investing of Mutual Funds in the Euronext Stock Markets.” Journal of Performance Measurement 6 (3): 40–50.
Rudd, Andrew. 1981. “Social Responsibility and Portfolio Performance.” California Management Review 23 (4): 55–61.
Shefrin, Hersh, and Meir Statman. 2000. “Behavioral Portfolio Theory.” The Journal of Financial and Quantitative Analysis 35 (2): 127–151.
Williams, Grace L. 2012. “A Small Basket of Big Stocks.” Barron’s (September 25).
Citation
Larsen Jr. Glen A. 2013. “Enhancing the Returns of SRI Portfolios Using a Minimum Variance Small-Basket Strategy.” Journal of Financial Planning 26 (5): 46–53.
Appendix