Journal of Financial Planning: March 2015
Srinivas Nippani, Ph.D., is a professor of finance with the Department of Economics and Finance, College of Business at Texas A&M University–Commerce. He has published more than 40 papers in leading academic journals, and his work is cited in several textbooks, newspapers, and by policy-making bodies.
Kenneth M. Washer, DBA, CFP®, CFA, is a professor of finance at Creighton University. He has published more than 30 papers in various journals.
Robert R. Johnson, Ph.D., CFA, CAIA, is president and CEO of The American College of Financial Services. He has published several books and more than 70 articles in academic and practitioner journals.
Executive Summary
- This paper examines the “Santa Claus rally,” which has been discussed in several popular press articles but not rigorously tested. The rally duration is commonly defined as the last five trading days in December and the first two trading days in January, although this study defines the rally by excluding days in January.
- Using difference in means tests, this study finds the holiday period has significantly higher average daily returns in the U.S. stock market and in many other prominent stock markets throughout the world.
- Generally, higher returns come with higher risks. However, results indicate that not only is the standard deviation of returns lower during the holiday season, but skewness is often less severe and kurtosis diminishes.
- A $10,000 investment during an average rally period would net an investor about $100 (1 percent return) over a normal seven-day period. Clients who plan to sell stocks near the end of the year would be wise to wait until after the Santa Claus rally. Discretionary buying should occur just before Christmas.
Since it was first documented that stock market returns may be a function of the day of the week (Cross 1973), many other studies have examined calendar anomalies such as the January effect, day-of-the-week effect, and the holiday effect. This paper extends these analyses by examining an anomaly that is often featured in the popular press, but one that has not been rigorously tested. The financial press often refers to the “Santa Claus rally,” which has commonly been defined as the last five trading days in December and the first two trading days in January (Mui 2013; Shell 2013; Yousuf 2013). Journalists have noted that returns for this time period are higher on average than equivalent periods at other times of the year. However, actual documentation of this anomaly has been cursory at best.
It is important to understand the January effect, as the Stock Trader’s Almanac’s definition of the Santa Claus rally includes the first two trading days in January. Rozeff and Kinney (1976) found that average monthly returns in January were about 3 percentage points higher than average returns for the other months using an equally weighted U.S. index. More recent studies by Yakob, Beal, and Delpachitra (2005) and Liu and Li (2011) report mixed results for the January effect.
Keim (1983) found that much of the excess returns in January are concentrated in the first five trading days. It seems very possible that the Santa Claus rally, as defined by the Stock Trader’s Almanac, may be picking up a partial January effect. In order to factor out the potential January effect, this study uses a definition of the Santa Claus rally that excludes days in January.
Lakonishok and Smidt (1988) did not observe a January effect among large firms, which suggests that the Santa Claus rally might be greater for small firms relative to large ones. In the current study, both large and small capitalization U.S. indexes were used to test whether this rally is isolated to either large or small firms.
Darrat, Li, Liu, and Su (2011) looked at monthly seasonality in 34 global equity markets spanning 1988 through 2010. They found no pervasive January effect, but did find that December and April significantly outperform other months. The last two weeks of December are superior to the first two weeks in 11 of the 34 countries examined, but surprisingly not in the U.S. equity market. They attributed the December effect to an increase in Christmas shopping.
Studies on the broader “holiday effect” tend to focus on the final trading day preceding major holidays. Holiday cheer is hypothesized to drive markets higher on these days. However, a study by Bouges, Jain, and Puri (2009) found that the average daily return for the trading day before eight major U.S. holidays was not significantly different from other trading days.
The primary motivation for analyzing the Santa Claus rally anomaly is that despite financial and popular press attention, little published academic work has been conducted on the topic. The 2014 Stock Trader’s Almanac (p. 114) describes the rally as follows: “Santa Claus tends to come to Wall Street nearly every year, bringing a short, sweet, respectable rally within the last five days of the year and the first two in January. This has been good for an average 1.6 percent gain since 1969 (1.5 percent since 1950).”
The Almanac published daily returns on the S&P 500 for the seven-day Santa Claus rally period from 1969 through 2013. The Almanac did not test for significance nor provide any information about risk. It also failed to assess markets in other countries, which would add robustness to the results. One was also left to wonder whether the rally extends to small capitalization firms. This study examines stock returns for the U.S. and other countries. Results suggest that returns are statistically higher as compared with the average return for the rest of the year. It appears that even in countries where Christmas is not the leading holiday (Japan, Singapore, India, Indonesia, and Taiwan), the rally persists. The rally is endemic to both small and large U.S. firms.
Indexes and Data
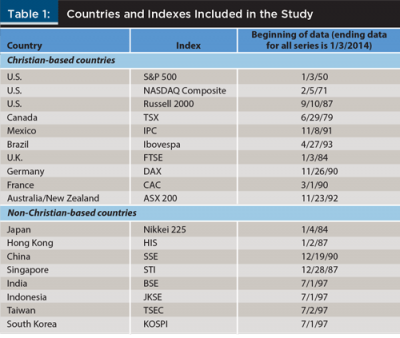
Data for this study were comprised of 18 indexes representing 16 countries. The study includes three U.S. indices: the S&P 500, the Nasdaq Composite, and the Russell 2000. Table 1 lists these indexes, as well as the other countries, indexes, and data time spans used in the study. Christian-based countries and non-Christian-based countries are shown separately. Christian-based countries are those where the majority of residents identify with a Christian religion. All data end on January 3, 2014.
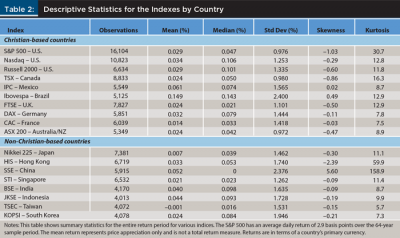
Daily closing prices were used to calculate the continuously compounded return when calculating the returns for the indexes. This was simply the difference in the natural logs of the closing prices. Table 2 shows the descriptive statistics for each index, broken into Christian-based and non-Christian-based countries. The means, medians, and standard deviations represent percentages. The S&P 500 has an average daily return of 2.9 basis points over the 64-year sample period. The mean return represents price appreciation only and is not a total return measure. Returns are also in terms of a country’s primary currency.
Results
As shown in Table 2, all indexes showed a positive mean daily return with the exception of Taiwan, which is slightly negative at 0.1 basis points. Most return series show negative skewness, but this only appears extreme in a few cases (Hong Kong, China, and to a lesser extent, the S&P 500). Skewness generally impacts the mean more than the median, and in the case of the S&P 500, the median value is greater than the mean (4.7 basis points verses 2.9).
Kurtosis indicates a distribution peak and how fat the tails are relative to the normal distribution. A normal distribution has a kurtosis measurement of three. In all cases, none of the indexes appear to be normally distributed. Because of the high kurtosis, extreme gains and losses are more likely than a normal, bell-shaped curve would suggest. Investors generally prefer higher skewness and lower kurtosis.
The Stock Trader’s Almanac suggests that the Santa Claus rally is the period of the last five trading days in December and the first two trading days in January. This definition has several potential problems. One is that a few of the foreign indices trade less frequently than the U.S. markets. The last five trading days of December can pick up as much as one-third of the month. For example, the Tokyo Stock Exchange was closed for four consecutive days at the end of 2013 and the beginning of 2014 for New Year’s Eve, New Year’s Day, and two bank holidays. But over that same period, the New York Stock Exchange was only closed for one day, New Year’s Day.
Another concern is that the rally may be influenced by the well-documented January effect, if the first two days of January tend to be abnormally positive, as suggested by Keim (1983). In fact, the Stock Trader’s Almanac shows that the first two trading days in January have the highest and third highest average daily returns for the seven-day period. This seven-day period is called the “long” period in this study.
Because of these issues, an alternative definition of the Santa Claus rally was used in this study; namely, the trading days between Christmas and New Year’s Day. This is typically four (if Christmas falls on a weekday) or five (if Christmas falls on a weekend) trading days each year for the U.S. market. This four-day period is called the “short” period in this study. In many Asian countries this period is often three days and sometimes just two days. The non-holiday season returns are the other trading days during the year.
The main research question tested here is whether the returns during the Christmas to New Year’s holiday season are significantly different from returns during the rest of the year. If markets are efficient, there should be no statistical difference in average daily returns during these periods. However, if markets are less than efficient, one may rightly ask, “Why are returns higher during the Christmas/New Year’s period?” One possible explanation is that it is akin to flipping heads five times in a row. One may not predict this occurrence, but it could happen. One also probably would not bet on the pattern happening with any regularity. If one does not believe the Santa Claus rally is a fluke, then the assumption of market efficiency comes into question. In this case, the most likely explanations are ebullient investor sentiment and/or a shifting of the January effect.
Return differences might be driven by investor sentiment. Investors may be more optimistic during the Christmas holiday season, and their optimism might cause them to be bullish on stocks. This positivity may also be powered by firms and governments being less likely to announce bad news around Christmas and New Year’s. Return differences might also be driven by a slippage of the January effect into late December. January effect investors may rationally want to get a jump on others by making stock purchases in late December instead of early January. This may drive stock prices up during late December.
An examination the S&P 500 Index finds that the mean return during the holiday period is about 20 basis points, versus the mean return for the non-holiday trading days of only about 3 basis points. These returns are reported on a pre-tax basis. The holiday period also exhibits much less risk as evidenced by a lower standard deviation, a positive skewness, and a lower kurtosis in relation to the other trading days. As these data suggest, holiday returns have been superior in regard to a higher mean, lower risk, more extreme returns that are “good,” and fewer extreme returns in general.
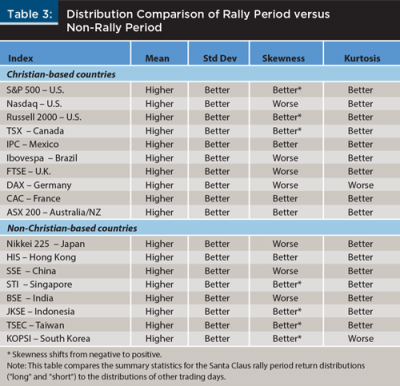
This casual comparison of holiday and non-holiday returns seems to fit the hypothesis that the holiday season is generally a good time to be invested in the stock market. Table 3 shows the results for all indexes in the study. In all cases, the mean return is higher and the standard deviation is lower during the holiday season. Skewness is less negative (better) in 11 of 18 cases, and it turns positive in six cases. In 16 of 18 cases, kurtosis is lower and thus preferred by investors. The definition of the holiday period does not significantly change the results shown in Table 3.
Is the Rally for Real?
A difference between two population means t-test, assuming unknown and unequal variances, was used to test whether the average daily returns between the holiday and non-holiday period were statistically different. Equation 1 shows the t-statistic calculation for the differences in means test.
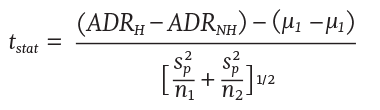
In the equation, ADRH and ADRNH are the average daily returns for the holiday period and the non-holiday period respectively; μ1 and μ2 are the population means of the holiday and non-holiday return periods. The null hypothesis is that the difference in population means is zero. Sp is the pooled estimator of the common variance, and n1 and n2 represent the two sample sizes.
The calculated t-statistic is compared to a critical Z value to determine if the difference in the two means is significant. When applying t-tests to non-normal data, the risk of making an error increases. The potential for error is reduced when the control data set is sufficiently large, which is the case with all the indexes examined.
Table 4 displays the results of the difference in means tests. In all cases, the average daily return during the holiday period (ADRlong and ADRshort) exceeded the average daily return for the non-holiday period (ADRNH).
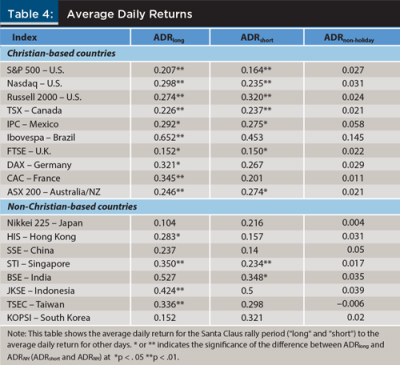
The S&P 500 had an ADRlong of 20.7 basis points during the rally period. This translates to an annualized return of about 50 percent. Comparing this large-cap index to that of small-caps (Nasdaq and Russell 2000), the ADRlong was 9 percentage points higher for the Nasdaq, and 7 percentage points higher for the Russell 2000. These results indicate that both large- and small-cap stocks experience significant rallies.
ADRlong (ADRshort) was significantly greater than the ADRNH at the 5 percent level in 14 (9) out of 18 cases. If a 10 percent level of significance is used, all Christian- and non-Christian-based countries showed a significant rally under the seven-day period. This was not the case with the short period. At the 10 percent level, only three of eight non-Christian-based countries had a statistically significant rally.
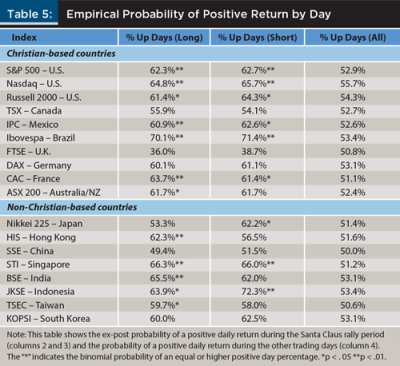
To further examine holiday returns, the percentage of positive returns during the holiday period was computed and compared to the percentage of positive returns for the overall period. Table 5 shows that 62.7 percent (165 positive return days out of 263 total “rally” days) of daily returns during the holiday period were positive for the S&P 500 under the “short” definition (slightly higher under the “long” definition). This is higher than the overall 52.9 percentage.
Equation 2 was used to assess the significance of this difference. It is used to calculate the proportion of the binomial distribution that is to the left of 62.7 percent:

In equation 2, x is the number of up days (successes), n is the total number of holiday returns, and p is the overall probability of an up day (success).
Thus, for the S&P 500, the likelihood of obtaining 165 or more positive return days out of 263 total days was calculated assuming a true probability of a positive return day was 52.9 percent. The likelihood was less than 0.001. That is, the probability of a positive return during the holiday season was significantly greater than 52.9 percent.
A good analogy is a basketball player who shoots 52.9 percent from the free throw line in games (non-holiday period) and 62.7 percent in practice (holiday period). The statistical test employed calculates the probability that a 52.9 percent free throw shooter would sink 62.7 percent in practice. Because this shooter has taken a lot of shots, the probability is less than 0.001. One would conclude that this player is a significantly better free throw shooter in practice. Similarly, one can conclude that the market is more likely to show a gain during the holiday period than during the rest of the year.
At the 5 percent significance level, seven of 10 Christian-based countries had a greater probability of a positive return day during the “long” rally period. This compares to five of eight non-Christian-based countries having a higher probability of a positive trading day. If the rally period is more narrowly defined, the rally is less prevalent. It should be noted that this is a non-parametric test and thus does not rely on the assumption of a normal distribution.
Conclusions and Implications
Statistical evidence from this study supports the existence of the so-called Santa Claus rally. Daily returns during the holiday period showed both a higher mean and more desirable risk metrics than returns for the rest of the year. These findings are significant using both parametric and non-parametric tests. The results were more robust for the “long” holiday period versus the “short” holiday period. The longer period includes two January trading days and thus may benefit from the well-documented January effect. The short period eliminated these January trading days and shows a significant rally still persists in many developed countries.
There are several implications for financial planners and investors. For the S&P 500, the return advantage of the holiday period over the non-holiday period is about 18 basis points per day. If one were to buy into a normal Santa Claus rally and sell at the end of the seven-day period, the gross profit would be about 126 basis points (seven days times 18 basis points). The bid/ask spread on the S&P 500 ETF is one penny, so the only significant expense would be brokerage commissions, which are less than $10 at many custodians and discount brokers. A $10,000 investment would generate, on average, about a $100 profit advantage over the non-holiday period.
A roughly 1 percent return earned over a seven-day period will not create riches, however one could leverage an investment in the U.S. stock market to magnify this return. An E-mini S&P 500 futures contract has a $4,600 margin requirement and a settlement price of $50 times the S&P 500 Index. So, if the index went from 1500 to 1519 (a 1.26 percent increase) over the seven-day Santa Claus rally period, the contract would move up by about $950 (19 point increase times $50). This translates to a 20.6 percent return on the $4,600 margin investment.
Leverage is a double-edged sword; it magnifies gains, but it also intensifies losses. So, if one implemented the E-mini futures strategy, and the S&P were to fall by 2 percent, the investor/speculator would lose almost 33 percent of his or her investment. The disappearance or reversal of the Santa Claus rally would not be too surprising. Studies have documented reversals of the January effect and the day-of-the-week effect.
In practice, few planners would encourage their clients to dive into stocks or an E-mini futures contract at the beginning of the rally and then exit at the end of the rally. The average daily return on the market has been positive for both holiday and non-holiday periods, so one could rightly question why any long-term investor would ever be “out” of the market. However, planners could take advantage of this research with limited discretionary trading that occurs during the end of the year. It seems more prudent to purchase stocks prior to Christmas rather than waiting until early January. If possible, selling should be delayed as long as possible (either the last trading day of December for moves like IRA distributions or after January 3 for portfolio rebalancing). At a minimum, financial planners should be aware of the empirical evidence regarding the Santa Claus rally, as near the end of the year clients will likely read many financial press articles regarding the phenomenon.
References
Bouges, Janie, Ravi Jain, and Yash Puri. 2009. “American Depository Receipts and Calendar Anomalies.” Applied Financial Economics 19 (1): 17–25.
Cross, Frank. 1973. “The Behavior of Stock Prices on Fridays and Mondays.” Financial Analysts Journal 29 (6): 67–69.
Darrat, Ali, Bin Li, Benjamin Liu, and Jen Je Su. 2011. “A Fresh Look at Seasonal Anomalies: An International Perspective.” International Journal of Business and Economics 10 (2): 93–116.
Hirsh, Jeffrey A. 2015. Stock Trader’s Alamanc. John Wiley & Sons. Hoboken, NJ.
Keim, Donald B. 1983. “Size Related Anomalies and Stock Return Seasonality.” Journal of Financial Economics 12 (1): 13–22.
Lakonishok, Josef, and Seymour Smidt. 1988. “Are Seasonal Anomalies Real? A 90-Year Perspective.” The Review of Financial Studies 1 (4) 103–425.
Liu, Benjamin, and Bin Li. 2011. “Monthly Seasonality in the Top 50 Australian Stocks.” Journal of Modern Accounting and Auditing 7 (4): 380–390.
Mui, Ylan Q. 2013 (December 26). “‘Santa Claus rally’ extends after Christmas.” Washington Post.
Rozeff, Michael, and W. Kinney Jr. 1976. “Capital Market Seasonality: The Case of Stock Returns.” Journal of Financial Economics 3 (4): 379–402.
Shell, Adam. 2013 (December 23). “Is ‘Santa Claus’ rally in cards for Wall Street?” USA Today.
Yakob, Noor, Diana Beal, and Sarath Delpachitra. 2005. “Seasonality in the Asia Pacific Stock Markets.” Journal of Asset Management 6: 298–318.
Yousuf, Hibah. 2013 (December 23). “Santa Claus rally fuels new records for stocks.” CNN Money.
Citation
Srinivas Nippani, Kenneth Washer, and Robert Johnson. 2015. “Yes Virginia, There Is a Santa Claus Rally: Statistical Evidence Supports Higher Returns Globally.” Journal of Financial Planning 28 (3): 55–60.