Journal of Financial Planning: March 2015
Robert Dubil, Ph.D., is an associate professor and lecturer of finance at the University of Utah. He is the author of Financial Engineering and Arbitrage in the Financial Markets, published in 2011. He has written articles on the use of callable bonds, ETFs, and protective collars in personal investing.
Executive Summary
- “Smart beta” funds make up about 20 percent of the U.S. ETP market. Promoters of this relatively new way of indexing claim significant outperformance over traditional cap-weighted indexing.
- This study shows that equal weighting, pure style, and accounting-based weighting has beaten the S&P 500 over a variety of horizons, with excess return ranges from 0.32 to 0.99 percent per month over the last five years. The excess return on the largest equal-weighted fund (RSP) and the largest mid-cap equal weighted fund (EWRM) can be explained by the positive market and size tilt of these funds.
- A key takeaway of this research is that investors can identify the funds’ risk factor loadings and replicate the exposure with stocks or other ETFs.
- Popular dividend yield and dividend growth strategies offer the lowest excess returns but the highest reward-to-risk Sharpe ratios. These approaches trade off the safety of lower market risk, larger size, and higher value tilt for unexplained alpha.
Since 2003, when the first equal weighted exchange-traded fund (ETF)—the Guggenheim S&P 500 Equal Weight Fund (RSP)—was introduced, “smart beta” funds have grown to $402 billion in assets under management or about 20 percent of the U.S. exchange-traded product market at the end of 2014, according to Mornginstar data reported by Benjamin (2015).
Smart beta funds, also known as fundamental index funds, are promoted based on extensive asset pricing research that shows these strategies beat cap-weighted index portfolios, such as the S&P 500, over many historical periods. Fundamental based portfolio building schemes involve weighting by dividend yields, dividend growth, sales and asset growth, size and value, and growth dimensions. The largest fundamental ETF, with $6.5 billion under management, is Guggenheim’s RSP, which is an equal weighted portfolio of the 500 largest U.S. stocks. Next in size is PowerShares FTSE RAFI US 1000 fund (PRF), which weights according to a proprietary methodology developed by Research Affiliates. The approach is based on a combination of book value, cash flow, sales, and dividends.
Other large funds include the “pure-style” Guggenheim S&P 500 Pure Growth (RPG) and Guggenheim S&P 500 Pure Value (RPV) funds, which exclude from the S&P 500 Index those companies that are categorized as blend and value, or blend and growth, respectively. Prior research has suggested two main sources of smart beta outperformance: higher risk (volatility and beta, small size, and value tilt); and periodic, but infrequent, rebalancing that takes advantage of mean reversion.
The Fama-French (1993) three-factor model introduced two additional systematic risk factors—size and book/market value—beyond the standard market factor. The introduction of the new factors stirred a theoretical debate that contributed to the proliferation of size-based (mid-cap, small) and P/E or book value-based funds (value, growth). Berk (1995, 1997) proposed that not seeing size as a priced risk factor should be considered strange, not the other way around. Berk also argued that cross-sectional size measures can be used to test for the misspecification of the capital asset pricing model, or CAPM. By the time the Guggenheim Equal Weight RSP was introduced in 2003, it was well known that equal weighting of the S&P 500 skews standard cap-weighted portfolios toward smaller size firms and increases overall beta.
Arnott, Kalesnik, and Tindall (2013) showed that unless one deliberately price skews, a cap-weighted portfolio will naturally exhibit a size and value tilt. They also noted that low/falling prices result not only in size tilt, as shown by Berk (1997), but also in book-to-market tilt. Arnott and Hsu (2008) proposed a model of an economy with mean reverting asset returns where CAPM cap-weighting is rejected as a market portfolio and non-cap-weighted schemes show significant alphas.
In one analysis, Hsu, Kalesnik, and Li (2012) attributed outperformance to fundamental investing tendencies. Resulting relative outperformance has generated significant commentary. For example, Luxenberg (2013), Mishra (2013), Ortiz (2013), and Vardy (2013) each commented on different aspects of the performance attribution, whereas Xydias (2014) reported the record inflows of funds into smart beta strategies.
This body of literature shows that non-homogenous risk preferences combined with certain return characteristics can lead to several equivalent risk factor decompositions of returns. This paper takes the widely accepted Fama-French (1993) plus the Carhart (1997) four-factor decomposition as its analytical starting point in order to keep the interpretation of the performance attribution clear. However, it is important to note that any rotation of these four factors can also be viewed as canonical.
In this study, after summarizing the fundamental index ETF’s performance relative to the market benchmarks, the analysis starts with the decomposition of returns into the common four systematic factors: (1) market; (2) “size” (small minus big); (3) “value” (high minus low book-to-market); and (4) momentum. This allows risks taken to be characterized by a fundamental index ETF by the factor loadings (“traditional betas”). This approach also helps identify performance attribution by multiplying the pre-computed betas by the realized returns of the factors, with the remainder being the unexplained alpha. This allows the source of a fund’s outperformance to be identified, and the contribution of each fund’s special approach to be quantified.
As shown below, the majority of reported outperformance is easily explained by market, size, book-to-market, and momentum tilts, with only pure style funds having some, and dividend funds having a large “special” component. This finding calls into question the suggestions of prior research that rebalancing frequency plays a major role in the outperformance of equal weighted funds.
Data, Methodology, and Performance Statistics
Price data on fundamental index ETFs domiciled in the U.S. with assets under management (AUM) of more than $100 million as of February 28, 2014 were collected. Table 1 shows the ETFs grouped by their fundamental style. The top panel contains traditional cap-weighted benchmarks.

The two oldest fundamental index funds, dating back to 2003, are the Guggenheim S&P 500 Equal Weight fund (RSP) and the iShares Select Dividend fund (DVY), which invests in U.S. equities with the highest dividend yields. The largest is the Vanguard Dividend Appreciation Index fund (VIG) with $22.67 billion in assets.
For the analysis, the continuously compounded monthly total returns (inclusive of dividend reinvestment) were computed. All prices are net of management fees, so the computed returns are achievable by any investor. None of the ETFs have multiple share classes.
Monthly risk-free rates and factor realizations for the three-factor Fama-French (1993) model plus Carhart’s (1997) momentum factor, were collected. Carhart’s four factors are: (1) MKT, S&P 500 minus the risk-free rate; (2) SMB, a long-short portfolio long the 1/3 smallest and short the 1/3 biggest companies by market cap; (3) HML, a long-short portfolio long the one-half high and short the one-half low book-to-market ratio companies; and (4) MOM, a sorted long-short cross-sectional momentum.
The means, standard deviations, and Sharpe ratios for three-, five-, seven-, and 10-year periods using monthly data were then computed. The results were annualized. The continuous monthly means were multiplied by 12, whereas the standard deviations and the Sharpe ratios were multiplied by √12. The statistics are shown in Table 2.
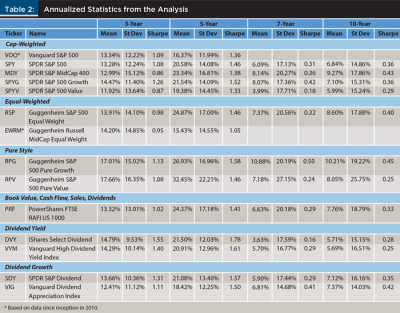
The Guggenheim Equal Weight RSP and the Guggenheim Pure Growth RPG funds outperformed the cap-weighted SPY in every sub-period, but at the cost of a higher standard deviation. The remainder of the funds had a mixed record. Dividend yield strategies generally had lower standard deviations, except in the seven- and 10-year sub-periods, which include negative return years. This shows up in their high reward-to-risk statistics, measured by the Sharpe ratios (excess return over the risk-free rate per unit of standard deviation). According to CAPM, the tangent market portfolio should have the highest Sharpe ratio achievable.
Risk Characteristics of Fundamental Index ETFs
In order to compute the “traditional betas” (also called “risk factor loadings” in a multivariate context), univariate regressions with intercept of excess ETF returns on the excess market (S&P 500) return, and multivariate regressions with intercept of excess ETF returns on the four systematic factors were estimated. Both regressions used monthly data over a seven-year period (shorter for the newer Vanguard S&P 500 and the Guggenheim Russell MidCap Equal Weight funds).
Non-annualized returns are shown in Table 3. Note that the role of the intercept in the regressions is ambiguous. In the univariate CAPM regressions, the intercept should be zero, which can be interpreted as alpha. In the multivariate Fama-French (plus Carhart) regressions, the intercept can be part of the statistical model, or it can be interpreted as alpha. For the purposes of this study, the standard view that both models are statistical factor models was adopted; therefore, the intercept is part of alpha.
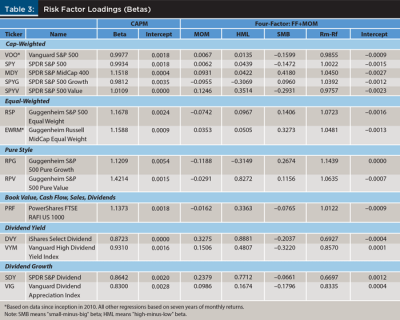
Several things stand out in Table 3. In univariate (CAPM) regressions, all the fundamental ETFs have market betas greater than one, except for those with a dividend strategy. Further, all have small but positive intercepts. High betas (high systematic risk) have been often identified as a reason for the long-term outperformance of these funds. The finding is also consistent with the early tests of the CAPM where high beta stocks exhibited positive intercepts.
The four-factor regressions provide a way to zero in on the risks taken by these ETFs. Although the mapping is not perfect, a positive small-minus-big (SMB) beta (loading) is interpreted as a small size tilt, whereas a positive high-minus-low (HML) beta (loading) is interpreted as a value tilt (a high book-to-market ratio is highly correlated with a low P/E ratio). A positive momentum beta means the stock is a cyclical leader, not laggard. The market factor interpretation is the same as in the CAPM approach except in the multivariate regression setting.
The results show the equal weighted and pure style strategies exhibit market betas above 1.0 and significant SMB loadings. That is, both pure growth and pure value companies (and those in the equal weight RSP) tend to be smaller and cyclical. Cash flow and revenue RAFI indexing takes advantage of the value bias through high loadings on HML. The dividend strategies are different in that they have less market risk, negative small size bias, and significant value and momentum loadings. The component tickers of these funds tend to be large value companies that do well in trending markets.
Performance Attribution of Fundamental Index ETFs
Tests were not limit to descriptions of risks. An additional step was taken by using the factor loadings to quantify the total monthly outperformance into two parts: (1) traditional betas, attributable to market, size and value; and (2) momentum factors and alpha attributable to management skill or superior indexing research. Results are shown in Table 4.
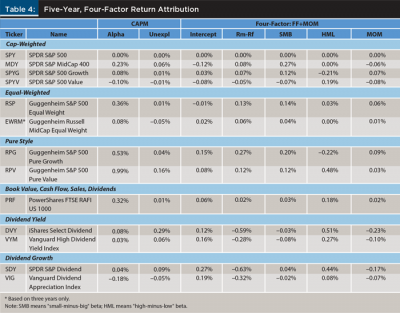
In Table 4, the SPDR S&P 500 ETF (SPY) was the benchmark. Differences in the factor loadings (factor betas) for each fund, relative to the factor loading of the benchmark (i.e., the tilts), were used. These were multiplied by the average monthly factor returns over a given period. This approach quantifies the contribution of each tilt to the total excess return. The difference between the total realized return and the sum of the risk-attributed returns was labeled “alpha.” It is important to note that statistically, “alpha” here includes the truly unexplained part of the excess return and the intercept, which itself cannot be attributed to the risk factors. The results in Table 4 are not annualized.
The factors explain 100 percent of the excess performance of the Guggenheim S&P 500 Equal Weight (RSP). Equal weighting outperforms, but mainly because of higher market risk (0.13 percent) and small size bias (0.14 percent). More than half of (cash flow, revenue) RAFI-indexed PRF’s outperformance, or 0.18 percent of 0.32 percent, is explained by the HML (value) tilt, 0.07 percent by the other factors; leaving only 0.07 percent left unexplained.
More than half of pure style strategy funds’ excess performance is explained by traditional beta. Both growth and value flavors (RPG and RPV) have excess market risk, small size bias, and negative momentum loading. This suggests that when dividing the S&P 500 into growth, value, and blend, the excluded blend stocks are larger countercyclical companies left out of the pure style funds. Of pure growth’s 0.53 percent, and pure value’s 0.99 percent excess returns, 0.47 percent and 0.24 percent, respectively, are explained by market and size factors. An additional 0.48 percent is explained by pure value’s HML (value) bias. A fairly significant 0.19 percent and 0.25 percent of the two ETFs’ excess returns are unexplained.
Dividend indexing does not appear to fall neatly into traditional beta buckets. Dividend indexed ETFs do not offer significant outperformance despite their proponents’ claims and the funds’ recent popularity. However, these ETFs exhibit large positive alpha components that offset underperformance due to an underweighting in market risk. The overwhelming portion of the funds’ positive returns comes from the HML (value) tilt and the unexplained alpha. The alpha cannot be replicated with the use of cap-weighted funds. Therefore, their main appeal is not the touted superior performance, but rather low risk and high reward-to-risk Sharpe ratios.
Conclusion
Cap-weighted index funds have been the bedrock of passive investing for the last half-century. These funds require very little rebalancing and mimic the changing macro economy over time. Fundamental index funds rebalance much more frequently based on research into accounting and market measures that drive companies’ performance. The claim that “smart beta” funds are theoretically optimal, and therefore superior to cap-weighted funds, is not supported by theory. It is the result of statistical experiments.
The results from this study suggest that (1) equal weighting’s outperformance can be completely explained; and (2) cash flow and revenue RAFI-weightings’ outperformance can be largely explained by over-weighting in systematic factor risks.
Pure style strategies rely predominantly on traditional market, small size, and growth/value tilts, with some element of automated active management. The most hyped strategies—those based on dividend yield and dividend growth—seem to offer a way of constructing countercyclical value tilted portfolios with attractive Sharpe ratios, but these approaches do not offer long-term excess performance.
References
Arnott, Robert, and Jason Hsu. 2008. “Noise, CAPM, and the Size and Value Effects.” Journal of Investment Management 6 (1): 1–11.
Arnott, Hsu, Vitali Kalesnik, and Phil Tindall. 2013. “The Surprising ‘Alpha’ from Malkiel’s Monkey and Upside-Down Strategies.” The Journal of Portfolio Management 39 (4): 91–105.
Benjamin, Jeff. 2015. “Smart Beta Booming Despite a Name Everyone Hates.” InvestmentNews.com (posted February 1).
Berk, Jonathan. 1995. “A Critique of Size-Related Anomalies.” Review of Financial Studies 8 (2): 275–286.
Berk, Jonathan. 1997. “Does Size Really Matter?” Financial Analysts Journal 52 (5): 12–18.
Carhart, M. M. 1997. “On Persistence in Mutual Fund Performance.” The Journal of Finance 52: 57–82.
Fama, Eugene, and Kenneth French. 1993. “Common Risk Factors in the Returns on Stocks and Bonds.” Journal of Financial Economics 33: 3–56.
Hsu, Jason, Vitali Kalesnik, and Feifei Li. 2012. “An Investor’s Guide to Smart Beta Strategies.” AAII Journal, December.
Luxenberg, Stan. 2013. “Is Smart Beta a Smart Idea?” WealthManagement.com (posted October 7).
Mishra, Neena. 2013. “Beat the Market with Smart Beta ETFs.” Retrieved from www.zacks.com/stock/news/111694/beat-the-market-with-smart-beta-etfs.
Ortiz, Peter. 2013. “Investors Starved for Yield Turn to Smart Beta.” Financial Times, ft.com (posted June 21).
Vardy, Nicholas. 2013. “Is ‘Smart Beta’ Investing’s Free Lunch?” MarketWatch.com (posted October 21).
Xydias, Alexis. 2014. “Smart Beta ETFs Beating S&P 500 Index Capture Record Cash.” Bloomberg.com (posted March 5).
Citation
Dubil, Robert. 2015. “How Dumb Is Smart Beta? Analyzing the Growth of Fundamental Indexing.” Journal of Financial Planning 28 (3): 49–54.