Journal of Financial Planning: March 2014
Joseph M. Goebel, Ph.D., is an assistant professor in the department of finance and insurance at the Miller College of Business at Ball State University in Muncie, Indiana. Email Joseph Goebel.
Terry L. Zivney, Ph.D., the Maxon Distinguished Professor Emeritus of Finance and Insurance at Ball State University in Muncie, Indiana, received his Ph.D. from Georgia State University. His interests include all aspects of managerial finance and investments. Email Terry Zivney.
Executive Summary
- The purpose of this study is to determine the prudent savings rate necessary to maintain real working-year expenditure levels through 30 years of retirement.
- Results indicate that retirement plans that require a minimum savings rate necessary to accumulate 12.5 times a client’s final real annual income, and the maximum sustainable withdrawal rate necessary to live off this amount through retirement, are associated with greater unnecessary sacrifice during working and retirement years.
- An alternative built on the lifecycle-based minimum savings rate necessary to maintain real income or real expenditure levels through retirement appears to provide a better solution.
- Savings plans designed to maintain real income levels during retirement increase real living expenditure levels over those experienced during working years because part of the working income was invested, not consumed.
- Clients should be able to maintain real working-year expenditure levels through 30 years of retirement with a savings rate of roughly 14 percent.
Key Terms:
MSWR – maximum sustainable withdrawal rate (Bengen 1994)
SAFEMAX – overall minimum MSWR (worst historical case) (Bengen 2006)
MSR12.5 – minimum savings rate necessary to accumulate 12.5 times annual income, which is the traditional retirement planning approach (Pfau 2011)
LMSR – lifecycle-based minimum savings rate to maintain income (Pfau 2011)
SAFEMIN – highest overall LMSR (worst historical case) (Pfau 2011)
LMSRE – lifecycle-based minimum savings rate to maintain expenditures
PRUMIN – highest LMSRE (worst historical case)
Retirement planning necessarily considers the impact of lifestyle preferences upon capital preservation through retirement and beyond. Generally speaking, frugality increases the probability of successfully preserving capital, while immoderation decreases this probability.
For a given combination of investment asset allocation and retirement longevity, pioneering studies on retirement planning have used an overlapping period methodology to initially identify the maximum sustainable withdrawal rates (MSWRs) associated with each of the successively overlapping retirement intervals that would enable funds to last through retirement. From among these MSWRs, the minimum MSWR, referred to as “SAFEMAX” in Bengen (2006), is often recommended as the ideal rate for retirees.
Although SAFEMAX enables retirees to make more informed decisions regarding retirement, these decisions are made more complicated by further studies revealing additional factors that have an impact upon the ideal withdrawal rate reflecting levels, performance, or preferences related to the economy (Bengen 1994; Cooley, Hubbard, and Walz 1998); portfolio size (Bengen 1997); diversification (Cooley, Hubbard, and Walz 2003b; Guyton 2004; Ho, Milevsky, and Robinson 1999); taxes (Bengen 1996); phase-down/phase-out activity (Bengen 1996, 2001; Cooley, Hubbard, and Walz 1999; Guyton 2004; Kitces 2008); inflation (Bengen 1994, 1996, 2001; Cooley et al. 1998, 1999; Guyton 2004; Kitces 2008); price-to-earnings (Kitces 2008); and methodology/distributions (Athavale and Goebel 2011; Milevsky, Ho, and Robinson 1997; Pye 1999, 2000). Depending on the factors and approach emphasized, the recommended annual sustainable withdrawal rate generally falls in a range of 2 to 6 percent.
SAFEMAX Limitations
Recommendations focused on withdrawal rates obtained through an overlapping period methodology suffer in three important ways. First, since MSWRs are uniquely determined by the particular overlapping retirement periods of focus, SAFEMAX, as a recommendation, presumes that any future pattern of portfolio returns will not differ dramatically from those experienced in the past. With future return patterns differing from those of the past, a withdrawal rate lower than SAFEMAX might be necessary.
Second, for retirees with portfolio return patterns that resemble ex-post return patterns other than the worst-case one leading to SAFEMAX, withdrawals and therefore the standard of living will be lower than necessary during retirement.
Third, as Cooley, Hubbard, and Walz (2003a) noted, MSWRs under overlapping period methodology are biased because they do not equally reflect the impact of economic conditions associated with all years of any sample analyzed.1
Finally, the focus on sustainable withdrawal rates assumes one has accumulated adequate savings to fund retirement. In other words, SAFEMAX is only half the story, and for planning purposes, it may be the less important half of the story.
Review of Lifecycle-Based Savings Rates
Although these concerns are not the primary focus of Pfau’s (2011) application of the overlapping period methodology, he raised another concern in arguing that the emphasis of prior studies on withdrawal rate recommendations are misplaced because the accumulation period is inappropriately ignored or treated in isolation from the retirement period. The assumption of independence between accumulation and retirement phases is inappropriate if market performance before retirement has an impact upon MSWRs through retirement.
For example, Pfau noted that in a mean reverting world with bull (bear) markets before retirement, MSWRs tend to be lower (higher) through retirement. If the economic conditions during the accumulation phase affect retirement withdrawal rates, then retirees are better served by focusing on the “safe savings rate” necessary to provide funds beyond Social Security and other sources of income that will sustain a preferred lifestyle through retirement. This approach allows retirement withdrawals to be defined in terms of replacing accumulation phase income, rather than as a fraction of decumulation phase balances.
The primary contribution of Pfau (2011) is that he tied the 30-year working and retirement intervals together in identifying the savings rates necessary to allow retirees to successfully maintain accumulation phase income levels through retirement; namely, 50 percent from retirement savings and the remainder from Social Security and other sources of income, such as a pension. He defined the pattern of savings rates associated with successive 60-year overlapping intervals for any combination of portfolio allocation and anticipated longevity as the lifecycle-based minimum savings rates (LMSR) curve. From the LMSR curve, the highest rate (SAFEMIN) is identified and recommended to retirees.
By integrating working and retirement intervals, intermediate wealth accumulation goals and subsequent withdrawal rates can be ignored. Consequently, retirees are less likely to (1) stop saving or delay retirement in response to lower than desired wealth accumulations, and (2) lower savings or retire early in response to higher than desired wealth accumulations during the working years.
Pfau (2011) suggested that the primary benefit of using the LMSR curve rather than the MSWR curve is reduced sacrifice. He supported this by pointing out that the range of MSWRs as a percentage of pre-retirement portfolio value are between 4 percent and 10 percent, assuming a 30-year retirement period beginning each year between 1871 and 1980. Thus, using the worst-case 4 percent for the MSWR during a period when withdrawal rates of 10 percent could have been allowed reflects an unnecessary sacrifice of roughly 60 percent in spending power for some retirees.
In contrast, minimum and maximum LMSRs as a percentage of pre-retirement salary over the same timeframe are 9.34 percent and 16.62 percent, respectively, reflecting a decline in spending power during the working years of only 7.28 percent. Pfau showed that with SAFEMIN of 16.62 percent, withdrawal rates required to achieve retirement spending goals are less than actual MSWRs despite dramatic variation in wealth accumulation at retirement.
Although application of SAFEMIN generally leads to less sacrifice during retirement than application of SAFEMAX, we do not believe that SAFEMIN serves as the most prudent recommendation to retirees, because it overstates the level of savings necessary to maintain pre-retirement lifestyles during retirement. That is, SAFEMIN ultimately reflects an increase in spending power during retirement years over that which was experienced during working years; it seeks to maintain income rather than expenditure levels. If retirees are content to maintain working lifestyles through retirement, then SAFEMIN results in an unnecessary sacrifice during working years as well as excessive portfolio balances through and at the end of retirement.
Purpose
The purpose of this study is to determine the prudent savings rate over 30 working years that will be sufficient to maintain real working year expenditure levels (rather than income levels) through 30 years of retirement. Similar to Pfau’s (2011) approach, we link pre-retirement savings rates to post-retirement distribution strategies. Similar to LMSR and SAFEMIN as described by Pfau (2011), we refer to the pattern of lifecycle-based minimum savings rates necessary to maintain a retiree’s living expenditures through retirement as LMSRE and the highest rate of LMSRE as PRUMIN.
The performances of SAFEMIN and PRUMIN are assessed relative to the assumptions of retirees simultaneously seeking to: (1) minimize savings to maximize spending power during the accumulation phase; (2) maintain at least their accumulation phase real level of living expenditures throughout all of retirement; and (3) minimize the amount left to heirs after retirement in tax disadvantaged retirement accounts.
Unlike Pfau, we assess how robust SAFEMIN and PRUMIN are in meeting these goals under differing portfolio return environments using both overlapping period and simulation methodologies. Simulation methodologies, with the assumption of independence in returns over time and across asset classes, is used to more comprehensively examine the robustness in SAFEMIN and PRUMIN while avoiding biases associated with an overlapping period methodology.
Under an overlapping period methodology, we show that retirement plans built on LMSR and LMSRE require lower savings levels and less unnecessary sacrifice during working and retirement years than plans built on combinations of the minimum savings rates necessary to accumulate 12.5 times the final real annual income and MSWR linked by a common retirement goal. When comparing Pfau’s (2011) SAFEMIN of 18.58 percent with our PRUMIN of 13.54 percent, PRUMIN is associated with (1) less savings during working years; (2) lower portfolio balances at the end of one’s working and retirement years; (3) less unnecessary sacrifice; and (4) greater protection against sustained portfolio nominal return levels below 6 percent.
Using simulation methodology under typical (worst-case) economic environments and the assumption of independence in portfolio returns over time, we show that SAFEMIN and PRUMIN are both successful in maintaining funds through retirement with roughly the same degree of confidence (76 percent and 69 percent, respectively). However, to achieve 95 percent confidence in maintaining funds through typical (worst-case) economic environments during retirement, PRUMIN needs to increase to 19 percent (21.5 percent) and SAFEMIN needs to increase to 30.5 percent (36.5 percent). Thus, increased assurance of funds through retirement can be realized with a much smaller increase in PRUMIN than with SAFEMIN.
Methodology and Assumptions
It was assumed that a person earns constant real income of $50,000 per year for 30 years. At the end of each year, a constant percentage of this real income is saved until retirement. Upon retirement, a constant real dollar amount is withdrawn from the retirement portfolio at the beginning of each year over an assumed 30-year retirement period. Although the percentages saved or withdrawn are constant in any one person’s lifetime, they may vary in different strategies. Over the 60 years of work and retirement, the amounts in the retirement portfolio generally earn a varying rate that depends upon the particular history and methodology used.
The overlapping period methodology makes use of online data provided by Robert Shiller (www.econ.yale.edu/~shiller/data.htm). The analysis covers the 1871–2012 timeframe.2 Following Pfau (2011), savings in the portfolio were split with 60 percent invested in large-capitalization stocks (S&P Composite Stock Price Index) and 40 percent in short-term fixed-income securities, with the annual yield from six-month commercial paper or certificate of deposit assets. Through both the 30-year accumulation and 30-year retirement phases, this 60/40 allocation ratio remained constant as the investment portfolio was annually rebalanced.3
Pfau (2011) assumed that retirees seek to replace 50 percent of the final accumulation phase salary from their retirement portfolio with the remaining 50 percent coming from Social Security and other income sources. Using his assumptions, we focused on withdrawals from the portfolio accounting for 50 percent of the final working-year salary using SAFEMIN, as well as the portion of the final working-year living expenditures not accounted for by Social Security and other income sources using PRUMIN. The first withdrawal was assumed to be made immediately after the last contribution at the end of the 30th year.4 Future withdrawals were adjusted during the retirement years to reflect inflation. Finally, portfolio management fees and taxes were ignored and success was declared for a savings rate when it provided for all 30 years of real-value withdrawals.
Results
Pfau (2011) reported: (1) the minimum savings rates necessary to accumulate 12.5 times the final real annual income (MSR12.5); (2) maximum sustainable withdrawal rates that are successful through retirement (MSWR); and (3) lifecycle-based minimum savings rates necessary to successfully replace 50 percent of final real working-year annual income through retirement (LMSR). We also derived these, as well as the lifecycle-based minimum savings rate necessary to successfully replace real working-year expenditure levels unaccounted for by Social Security and other income sources (LMSRE). These MSR12.5, MSWR, LMSR, and LMSRE curves (see Figure 1) were estimated from retirement years, working years, and the combination of working and retirement years, respectively.
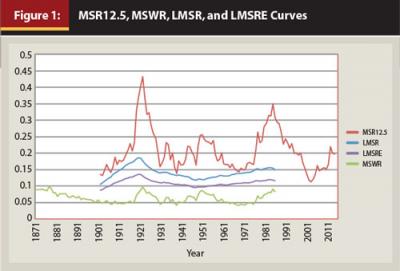
Overlapping Period Methodology: MSR12.5
As shown in Figure 1, the MSR12.5 curve reflects savings rates associated with successively overlapping 30-year pre-retirement intervals. These rates are required during working years to accumulate $625,000 at retirement. This curve reveals the unnecessary lifestyle expenditure reductions associated with MSR12.5 as a basis for determining the amount of savings necessary through working years.
When applying the global maximum (worst-case) MSR12.5 of 43.19 percent to someone retiring after 1999, which had an MSR12.5 of 11.21 percent, real living expenditures are unnecessarily reduced during the working years by 36 percent.5 Application of this global maximum MSR12.5 across all 30-year working intervals ending between 1900 and 2012 leads to an average ending accumulation phase real portfolio balance of $1,408,032, with a high of $2,407,786 after 1999, and a low of $625,000 after 1920.
Overlapping Period Methodology: MSWR
In Figure 1, the MSWR curve reflects withdrawal rates associated with successively overlapping 30-year post-retirement intervals. This curve highlights the unnecessary lifestyle expenditure reductions associated with MSWR as a basis for determining the amount of withdrawals necessary through retirement. For example, if it assumed that $625,000 is available in the retirement portfolio at the beginning of any 30-year retirement period, applying SAFEMAX of 4.13 percent to someone retiring in 1877, which would have supported an MSWR of 9.92 percent, unnecessarily reduces retirement nominal living expenditures coming solely from the portfolio by more than 58 percent. Application of the SAFEMAX withdrawal rate across all 30-year retirement intervals ending between 1900 and 2012 leads to an average end of retirement portfolio balance of $1,925,722, with a high of $5,747,231 after 2004, and a low of $0 after 1995.
Overlapping Period Methodology: SAFEMIN
In computing LMSR, Social Security and other sources of income were assumed to equal 50 percent of real income of the last working year. Therefore, withdrawal amounts based on LMSR need to provide the remaining 50 percent ($25,000). Savings rates from the LMSR curve in Figure 1 reflect the midpoints of successively overlapping 60-year intervals. Thus, each midpoint represents the end of 30 years of work and the beginning of 30 years of retirement.
This curve indicates that if a retiree beginning retirement in 1901, which required an LMSR of 10.53 percent, instead used the SAFEMIN of 18.58 percent, the retiree would have experienced an unnecessary reduction in real spending during working years of 8.05 percent. When SAFEMIN is applied across all possible 60-year working and retirement intervals, the average portfolio balance at the end of the 30-year working phase is $588,412, reflecting a high of $879,750 at the end of 1901, and a low of $268,799 at the end of 1920. The average portfolio balance at the end of the 30-year retirement phase is $1,776,841, reflecting a high of $4,347,598 at the end of 1998, and a low of $7 at the end of 1948.
Overlapping Period Methodology: PRUMIN
In computing LMSRE, it was assumed that Social Security and other sources of income equal 50 percent of real income of the last working year. Consequently, withdrawal amounts based on LMSRE need to provide less than 50 percent of living expenditures, because the first retirement withdrawal amount reflects the difference between living expenditures of the last working year and what is provided by Social Security and other income sources.
For example, a savings rate of 10 percent would result in real savings of $5,000 on real income of $50,000 per year. At retirement, a retiree would then live on yearly real income of $45,000, reflecting $20,000 from the portfolio and $25,000 from Social Security and other income sources.6 With even higher savings rates, correspondingly less is taken from the portfolio as Social Security and other income sources provide for relatively more of the living expenditures. The more one saves, the less one needs to depend on savings to maintain expenditures.
As illustrated in Figure 1, savings rates from the LMSRE curve reflect the midpoints of successively overlapping 60-year intervals in a manner similar to that for the LMSR curve. This curve shows that if a retiree beginning retirement in 1901 with LMSRE of 8.70 percent used PRUMIN of 13.54 percent, an unnecessary reduction in real spending during working years of 4.85 percent would result. Applying PRUMIN across all 60-year intervals leaves an average portfolio balance at the end of the 30-year working phase of $429,021, reflecting a high of $641,441 at the end of 1901, and a low of $195,986 at the end of 1920. The average portfolio balance at the end of the 30-year retirement phase is $1,295,537, reflecting a high of $3,169,940 at the end of 1998, and a low of $10 at the end of 1948.
And the Winner Is?
Retirement plans that are dependent on the combination of MSR12.5 to provide a designated amount at retirement and MSWR to provide funds based on this amount through retirement are associated with greater unnecessary sacrifice during working and retirement years, as well as excessive post-retirement portfolio value when compared to retirement plans based on LMSR and LMSRE.
LMSR and LMSRE are superior to a combination of MSR12.5 and MSWR because, in reflecting portfolio performance over 30 years before and after retirement, LMSR and LMSRE both account for the high positive correlation between MSR12.5 and MSWR first reported by Pfau (2011). Saving and withdrawal recommendations based on MSR12.5 and MSWR are sub-optimal because they do not reflect this correlation.
In a direct comparison of Pfau’s (2011) LMSR with the LMSRE, savings intended to replace working-year expenditure levels rather than income levels is preferable for a variety of reasons. First, PRUMIN requires less saving during working years than SAFEMIN. Second, PRUMIN is associated with lower average portfolio balances at the end of accumulation and retirement phases than SAFEMIN.7 Third, savings required for retirement under the LMSRE curve are lower than those under the LMSR curve across all 83 60-year intervals between 1871 and 2012. The average difference in real savings amounts between these two curves across all intervals is $1,561, reflecting 3.12 percent of real income. This average reflects a maximum difference of $2,516 with the last working year ending in 1918, and a minimum difference of $915 with the last working year ending in 1900.
Overlapping Period Methodology: Sensitivity to Changes in Portfolio Returns
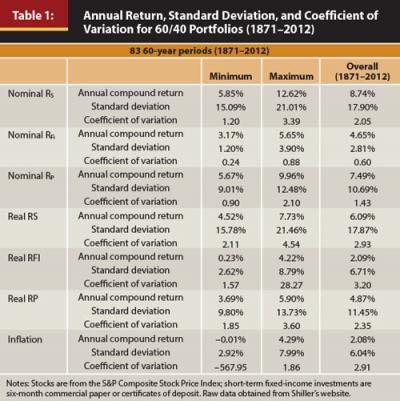
An investigation of the robustness of SAFEMIN and PRUMIN to changes in the overall level of portfolio returns was performed next. Table 1 reports the nominal annual compound returns on stocks (RS), short-term fixed-income investments (RFI), and the portfolio (RP) as .0874, .0465, and .0749, respectively. For any 60-year interval between 1871 and 2012, the minimum (maximum) nominal RS, RFI, and RP are .0585 (.1262), .0317 (.0565), and .0567 (.0996), respectively.8 Thus, the nominal RP across the 60-year intervals varies from the mean nominal RP obtained over the full 1871–2012 timeframe. The range between the highest and lowest RP 60-year intervals is .0430.
In Table 2, we focus on how sensitive savings and withdrawal rates are to changing portfolio return environments by computing MSWR, MSR12.5, SAFEMIN, and PRUMIN under various nominal RS, and RFI combinations, assuming an overall inflation rate of .0208 (from Table 1). For example, when both nominal RS and RFI are 0.15 for each year through the entire 1871–2012 interval analyzed, MSWR is 0.1156.9
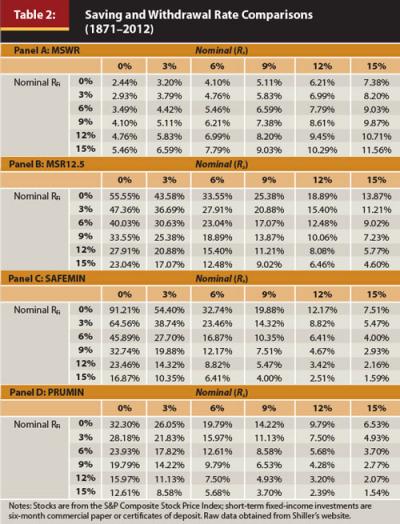
It is clear that as both nominal RS and RFI increase, the MSWR increases, while the three different savings rates (MSR12.5, SAFEMIN, and PRUMIN) all decline. This is as expected.
Further, SAFEMIN is more sensitive to low levels of returns than is PRUMIN. For example, when nominal RS and RFI are zero, SAFEMIN is 0.9121, and PRUMIN is 0.3230. At high levels of returns, however, there is not much difference between SAFEMIN and PRUMIN. For example, when nominal returns are constantly 0.15 for both asset classes, SAFEMIN and PRUMIN are 0.0159 and 0.0154, respectively. These results indicate that 0.1858 for SAFEMIN and 0.1354 for PRUMIN reported earlier are adequate in maintaining funds through 30 years of retirement as long as overall sustained levels of nominal RS and RFI are 0.06 or greater. If these levels are less than 0.06, both SAFEMIN and PRUMIN must increase. It is worth noting that PRUMIN requires much less sacrifice compared to SAFEMIN.
Simulation Results
The following discussion highlights how savings and corresponding withdrawal rates affect the likelihood of success for retirees making it through 30 years of retirement using a 10,000-iteration simulation methodology under typical and worst-case economic environments.
The typical economic environment is reflected by parameter estimates for RS, RFI, and inflation measured over the entire 1871–2012 period. The worst-case economic environment is reflected by parameter estimates for RS, RFI, and inflation measured over the 60-year interval associated with the highest coefficient-of-variation value in the 1882–1941 period. (Robustness is more stringently assessed through assuming independence among RS, RFI, and inflation level.
As before, real income was assumed to be $50,000 per year over 30 working years before the first withdrawal of 50 percent (reflecting the replacement of income in Table 3) or the complement to the savings rate (reflecting the replacement of expenditures in Table 4) is made. Over the retirement years, this initial withdrawal amount was allowed to adjust with inflation and assets earn nominal returns drawn from the distribution.10
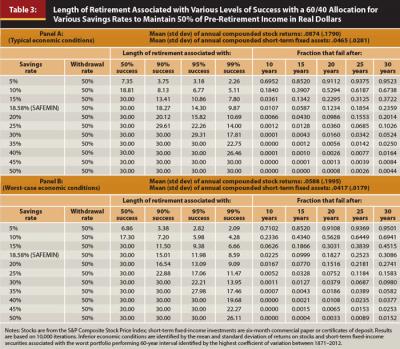
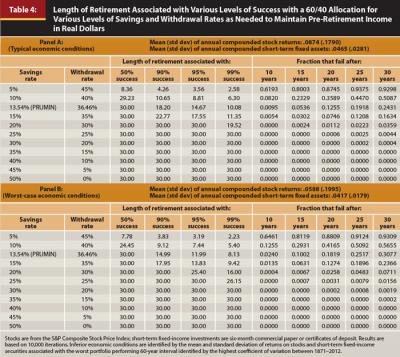
Table 3 presents the length of retirement associated with various levels of success and the probability of a portfolio unable to last 10, 15, 20, 25, and 30 years during retirement.
Withdrawal rate levels are always 50 percent of real pre-retirement income and are, thus, independent of savings rate levels, because Social Security and other income sources always provide an amount equal to the other 50 percent. Table 3 shows that under typical (worst-case) economic conditions with the optimal SAFEMIN savings rate of 18.58 percent, only 76.41 percent (69.14 percent) of retirees will be able to sustain real pre-retirement income levels through 30 years of retirement. In order for retirees to be confident that they have a 95 percent probability of maintaining real income levels through retirement under typical (worst-case) economic conditions, they will need to save approximately 30.5 percent (36.5 percent). Note the modest difference between these conditions, both here for SAFEMIN and in the subsequent findings for PRUMIN.
As illustrated in Table 4, savings and withdrawal rate levels are perfectly inversely correlated and sum to 50 percent because assuming Social Security and other income sources always provide $25,000 toward real living expenditures, every dollar increase (decrease) in real savings during working years is associated with a dollar decrease (increase) necessary to maintain real living expenditures during retirement. Consequently, increases (decreases) in portfolio return levels lead to corresponding decreases (increases) in savings rates and increases (decreases) in withdrawal rates.
Table 4 shows that with PRUMIN of 13.54 percent, only 75.69 percent (69.23 percent) of retirees will be able to sustain real pre-retirement expenditure levels through 30 years of retirement under typical (worst-case) economic conditions. Thus, both SAFEMIN and PRUMIN initially provide similar probabilities of maintaining funds through retirement. However, the increase in savings necessary to obtain a 95 percent probability of success in maintaining funds through retirement is much less for PRUMIN than it is for SAFEMIN. For example, under typical (worst-case) economic conditions, retirees will need to save approximately 19 percent (21.15 percent). These results again reveal how PRUMIN requires lower initial levels and smaller increases in these levels to ensure funds through retirement with great confidence.
Conclusions
This paper is premised on the assumption that individuals seek to maximize real living expenditure levels through saving at the lowest rate possible during working years and to maintain these levels through withdrawing at the highest rate possible during retirement years. Using an overlapping periods methodology for 83 60-year intervals, combining 30 years of work followed by 30 years of retirement between 1871 and 2012, it was determined that MSR12.5, LMSR, and LMSRE as savings rates are preferred to be low, while MSWR as a withdrawal rate is preferred to be high.
In this analysis, average, maximum (SAFEMIN), and minimum LMSRs are 14.08 percent, 18.58 percent, and 10.53 percent, respectively, whereas average, maximum (PRUMIN), and minimum LMSREs are 10.96 percent, 13.54 percent, and 8.7 percent, respectively.
It was shown that both LMSR and LMSRE are superior to retirement plans combining MSR12.5 and MSWR, because LMSR and LMSRE are associated with less sacrifice required during working and retirement years and, therefore, lower post-retirement portfolio value.
Further, these numbers reflect the preference of PRUMIN as a retirement plan over SAFEMIN in a number of ways. First, PRUMIN requires less saving during working years, which, in turn, leads to lower portfolio surpluses at the end of working and retirement years. Second, assuming that unnecessary sacrifice is reflected through the difference between maximum and minimum values for LMSR and LMSRE, PRUMIN (13.54 percent – 8.7 percent = 4.85 percent) requires less unnecessary sacrifice than SAFEMIN (18.58 percent – 10.53 percent = 8.05 percent). Third, while SAFEMIN of 18.58 percent and PRUMIN of 13.54 percent provide funds through retirement for sustained portfolio nominal return levels of 6 percent or more, PRUMIN is substantially better at protecting against levels below 6 percent. For example, with these levels equal to 0 percent, SAFEMIN (PRUMIN) must rise to 91.21 percent (32.30 percent) in order for funds to last through all of retirement.
Assuming independence in portfolio returns over time with a 10,000-iteration simulation methodology, under typical and worst-case economic environments, it was shown that with SAFEMIN of 18.58 percent, 76.41 percent (69.14 percent) of retirees will be able to maintain real pre-retirement income levels through 30 years of retirement under typical (worst-case) economic conditions.
To maintain income through all of retirement under typical (worst-case) economic environments with a 95 percent probability of success, retirees need to save approximately 30.5 percent (36.5 percent) during working years. On the other hand, with PRUMIN of 13.54 percent, 75.69 percent (69.23 percent) of retirees will be able to maintain real pre-retirement expenditure levels through 30 years of retirement under typical (worst-case) economic conditions. To maintain income through all of retirement under typical (worst-case) economic environments with a 95 percent probability of success, retirees need to save approximately 19 percent (21.15 percent) during working years. Thus, PRUMIN is superior to SAFEMIN, because PRUMIN requires less in savings and a much smaller increase in savings to ensure funds through retirement with a 95 percent chance of success.
The relative safety of PRUMIN over SAFEMIN takes on greater importance as retirees rely more heavily on their retirement portfolio to provide necessary funds through retirement.
An important question remains: What savings rate should be promoted that will best ensure funding through all of retirement at real pre-retirement expenditure levels? The answer to this question depends on the assumptions used. Assuming (1) future 60-year intervals reflective of combined 30-year working and retirement phases do not differ from those of the past, (2) Social Security and other income sources provide an equivalent to 50 percent of real working-year income levels during retirement, (3) savings are intended to replace working-year real expenditure levels rather than real income levels, and (4) sustained nominal portfolio returns do not fall below 6 percent, clients should be able to maintain real working-year expenditure levels through 30 years of retirement with a savings rate of roughly 14 percent.
Endnotes
- For example, Cooley et al. (2003a) showed over the 1946–2001 time frame that MSWRs under simulation are higher with increasing longevity and more highly weighted (50 percent or more) toward bond portfolios because the middle years (1970–1981) play an inappropriate role in driving and therefore biasing the results for rolling-periods methodology. That is, the middle years are in more rolling periods than years at the beginning and end.
- The analysis covered 142 years of data with a total of 83 60-year periods that reflect 30 years of work followed by 30 years of retirement. The parameter estimates later used in the simulation (using 10,000 iterations) were based on mean and standard deviation statistics obtained from Shiller’s data. Returns of stocks and bonds were assumed to follow lognormal distributions.
- Pfau (2011) also looked at 40/60 and 80/20 allocation portfolios.
- This indicates that the first savings payment made at the end of 1871 will earn real returns for the next 29 years before the first retirement withdrawal at the beginning of 1901 is made.
- An MSR12.5 of 43.19 percent means someone can consume (100 – 43.19) = 56.81 percent during working years. Similarly, an MSR12.5 of 11.21 percent implies someone could consume (100 – 11.21) -88.79 percent, which is a 36.01 percent reduction (88.79 – 56.81)/88.79) in potential consumption.
- A possible extension of this analysis might note that working life consumption is reduced by Social Security taxes, thus further reducing the amount of savings needed to maintain consumption during retirement.
- Note that both SAFEMIN and PRUMIN run the risk of exceeding the Obama administration’s proposed limits on 401(k) accounts.
- The maximum (minimum) annual compounded returns and standard deviations do not necessarily come from the same 60-year subinterval, whereas the maximum (minimum) coefficient of variation reflects the highest (lowest) measure of risk per unit of return for any one 60-year subinterval.
- With no change in returns through the years, all 30- and 60-year intervals between 1871 and 2012 have the same withdrawal and savings rate; thus, there is only one possible unique rate for any particular return combination.
- Over the 30-year accumulation phase, real returns are obtained from randomly generated nominal returns simultaneously subtracting randomly generated inflation.
References
Athavale, Manoj V., Joseph M. Goebel. 2011. “A Safer Safe Withdrawal Rate Using Various Return Distributions.” Journal of Financial Planning 24 (7): 36–43.
Bengen, William. 1994. “Determining Withdrawal Rates Using Historical Data.” Journal of Financial Planning 7 (4): 171–180.
Bengen, William. 1996. “Asset Allocation for a Lifetime.” Journal of Financial Planning 9 (8): 58–67.
Bengen, William. 1997. “Conserving Client Portfolios During Retirement, Part III.” Journal of Financial Planning 10 (12): 84–97.
Bengen, William. 2001. “Conserving Client Portfolios During Retirement, Part IV.” Journal of Financial Planning 14 (5): 110–119.
Bengen, William. 2006. Conserving Client Portfolios During Retirement. Denver, Colorado: FPA Press.
Cooley, Philip L., Carl M. Hubbard, and Daniel T. Walz. 1998. “Retirement Spending: Choosing a Sustainable Withdrawal Rate.” Journal of the American Association of Individual Investors 20 (2): 16–21.
Cooley, Philip L., Carl M. Hubbard, and Daniel T. Walz. 1999. “Sustainable Withdrawal Rates from Your Retirement Portfolio.” Financial Counseling and Planning 10 (1): 39–47.
Cooley, Philip L., Carl M. Hubbard, and Daniel T. Walz. 2003a. “A Comparative Analysis of Retirement Portfolio Success Rates: Simulation Versus Overlapping Periods.” Financial Services Review 12 (2): 115–128.
Cooley, Philip L., Carl M. Hubbard, and Daniel T. Walz. 2003b. “Does International Diversification Increase the Sustainable Withdrawal Rates from Retirement Portfolios?” Journal of Financial Planning 16 (1): 74–80.
Guyton, Jonathan T. 2004. “Decision Rules and Portfolio Management for Retirees: Is the ‘Safe’ Initial Withdrawal Rate Too Safe?” Journal of Financial Planning 17 (10): 54–62.
Ho, Kwok, Moshe A. Milevsky, and Chris Robinson. 1999. “International Equity Diversification and Shortfall Risk.” Financial Services Review 8 (1): 11–25.
Kitces, Michael E. 2008. “Resolving the Paradox: Is the Safe Withdrawal Rate Sometimes Too Safe?” The Kitces Report (May).
Milevsky, Moshe A., Kwok Ho, and Chris Robinson. 1997. “Asset Allocation via the Conditional First Exit Time or How to Avoid Outliving Your Money.” Review of Quantitative Finance and Accounting 9 (1): 53–70.
Pfau, Wade D., 2011. “Safe Savings Rate: A New Approach to Retirement Planning over the Life Cycle.” Journal of Financial Planning 24 (5): 42–50.
Pye, Gordon B. 1999. “Sustainable Real Spending from Pensions and Investments.” Journal of Financial Planning 12 (6): 80–91.
Pye, Gordon B. 2000. “Sustainable Investment Withdrawals.” Journal of Portfolio Management 26 (4): 73–83.
Citation
Goebel, Joseph M., and Terry L. Zivney. 2014. “Prudent Savings for Lifetime Consumption.” Journal of Financial Planning 27 (3): 42–51.