Journal of Financial Planning: June 2016
John B. Mitchell, DBA, is a professor of finance at Central Michigan University. His research interests are primarily in retirement planning and educational assessment.
Zachary S. Felton is a recent graduate of Central Michigan University who currently works in the mortgage industry outside of Phoenix, Arizona.
G. Thomas Mitchell is a retired life insurance actuary. He is a fellow of the Society of Actuaries and a member of the American Academy of Actuaries. He is the former president of Aurora Consulting Inc., an actuarial consulting firm based in St. Louis, Missouri.
Executive Summary
- This paper compares sustainable retirement withdrawal rates for same-sex versus heterosexual couples.
- Due to convergence of expected longevity for males and females at typical retirement ages, systematic differences between same-sex versus heterosexual couples are slight, ranging from 0.03 percent at age 50 to less than 0.4 percent at age 85.
- Same-sex couples can employ conventional withdrawal rate recommendations with, at most, slight modification.
- Members of same-sex couples, like most retirees, should adjust withdrawal rate expectations periodically to reflect individual conditions.
Legalization of same-sex marriage by the Unites States Supreme Court on June 26, 2015 made it easier for same-sex couples to jointly manage retirement assets. As a result, financial planners may have same-sex couples asking more questions like these: if women live five years longer than men, shouldn’t we be able to use a higher retirement withdrawal rate, because we are both male? Do we need to use a lower retirement withdrawal rate since we are both female? How do we make sense of the recommendations we see in the press and on websites when they are based on heterosexual couples?
Traditional research has focused on heterosexual couple retirement withdrawal rates. Same-sex couples naturally will ask if they can use the standard recommendations for retirement withdrawal rates, or if they need to adjust those rates to reflect the makeup of their family. This study explored systematic differences between heterosexual and same-sex couple withdrawal rates so that same-sex couples can adjust publicly available retirement withdrawal rate projections for their specific circumstances. Likewise, financial planners can use this analysis to help advise clients.
Early retirement withdrawal rate papers focused on fixed retirement periods and single lives. Pfau (2015) provided a thorough review of the withdrawal rate implications of several of these papers. Monte Carlo simulation of heterosexual couples first appeared in Blanchett and Blanchett (2008) and was discussed more recently by Pfau (2011). None of these papers dealt with the case of appropriate retirement withdrawal rates for same-sex couples. This paper extends earlier work by studying how retirement withdrawal rates for same-sex couples differ from those of heterosexual couples.
Understanding Differences in Life Expectancy
Conflicting evidence exists regarding differences in life expectancy based on sexual orientation and participation in same-sex unions. Cochran and Mays (2015) reported that all-cause mortality did not differ by sexual orientation among either women or men, although women in sexual relationships with women had higher suicide rates than other women. Meanwhile, evidence of greater homosexual male mortality due to HIV and due to suicide and murder, particularly in less-accepting communities, was found. However, the implications for retirement planning are unclear as heterosexuals in the same less-accepting communities also had somewhat, though more modestly, elevated mortality and the most affected causes of death among homosexuals, suicide and murder, tended to occur at pre-retirement ages (Hatzenbuehler et al. 2014).
Recent linking of the General Social Survey and the Centers for Disease Control (CDC) National Death Index data may lead to more extensive and generalizable studies of expected longevity by sexual orientation (Hatzenbuehler et al. 2014). There is, meanwhile, a need for better data, such as sexual orientation linked to death certificates (Skinner 2015).
The related question of the relative effects on longevity of same-sex versus heterosexual relationships also needs further study, although Ducharme and Kollar (2012) reported that their “investigation suggests that healthy marriage correlates with psychological, physical, and financial health benefits for lesbian couples as has been shown for heterosexuals” (page 589).
It may be logical to expect that increased mortality among homosexual males due to HIV would be reduced by the implied monogamy of a same-sex relationship and that the emotional support of same-sex spouses would likewise reduce suicide risk for both sexes. However, we are left with no coherent adjustment of CDC life tables for same-sex versus heterosexual couples. Due to the lack of clarity in public information on differences in expected lifespan by sexual orientation, this study employs non-race specific Centers for Disease Control 2010 United States Life Tables (National Vital Statistics Report, volume 63, number 7).
Expected returns used in this analysis were based on 1926 to 2014 historic returns for large-cap stocks and intermediate-term government bonds from the Ibbotson/Morningstar Stocks, Bonds, Bills, and Inflation (SBBI) 2015 Classic Yearbook. The focus was on relative rather than optimal withdrawal rates. Therefore, the study used a 60 percent large-cap stock and 40 percent intermediate-term government bond portfolio allocation to reflect typical recommendations. Using GoldSim software, 50,000 iteration Monte Carlo simulations were performed. Beginning-of-year withdrawals were continued at the full rate for the surviving spouse.
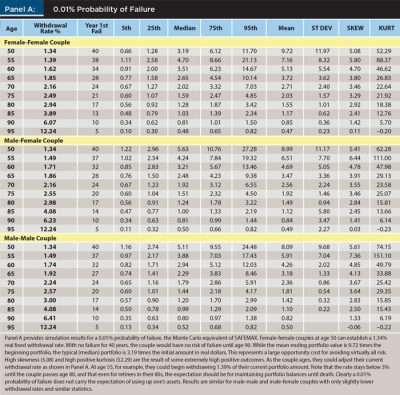
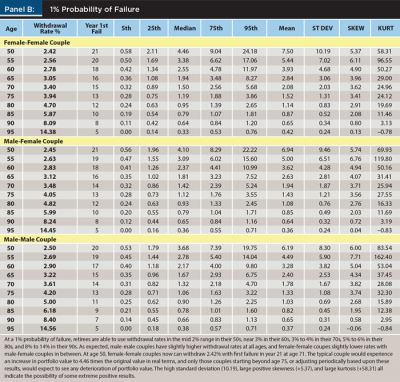
Results include suggested fixed real withdrawal rates for 0.01 percent, 1 percent, and 10 percent probability of failure for retirement ages 50 to 95. Because Monte Carlo simulations allow much greater than previously experienced variations in portfolio returns and longevity, 0.01 percent probability of failure (five out of 50,000) is adopted as a surrogate for Bengen’s maximum always safe withdrawal rate (Bengen 1994), or what he eventually called “SAFEMAX,” for those retirees desiring a virtually risk-free withdrawal rate.
Longevity Expectations for Heterosexual and Same-Sex Couples
Table 1 provides annual probability of death and joint-and-survivor expected longevity, hereinafter referred to as joint life expectancies1, for male-female couples, male-male couples, and female-female couples. Female probability of death is lower than male probability of death for all ages below 100 when the CDC United States Life Tables assume all remaining persons die.
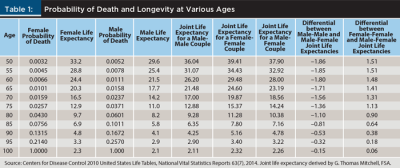
Female expected longevity is greater than male expected longevity for all ages. At birth, female life expectancy is 4.8 years greater than male life expectancy (not shown in Table 1). However, by age 50, the female-to-male differential falls to 3.6 years (33.2 – 29.6). At age 95, the differential has declined to 0.4 years (3.3 – 2.9).
Joint life expectancy for male-male couples is 1.86 years less than the joint life expectancy for male-female couples at age 50. The differential decreases to 0.32 years at age 95. Joint life expectancy for female-female couples is 1.51 years greater than that for male-female couples at age 50 and decreases to 0.18 years at age 95.
Withdrawal Rate Recommendations
Table 2 provides suggested fixed real (inflation-adjusted) withdrawal rates for 60 percent large-cap stocks and 40 percent intermediate-term government bond portfolios for heterosexual and same-sex couples at ages 50 through 95. The purpose of Table 2 is to establish relative withdrawal rates. Other studies and commercial sources are likely to find more efficient portfolios that generate higher withdrawal rates, however, sensitivity analysis at higher and lower equity allocations suggest stability of the withdrawal rate adjustments. Therefore, the results of this study provide an adjustment factor for same-sex couples to make commonly available recommendations relevant for their lives.
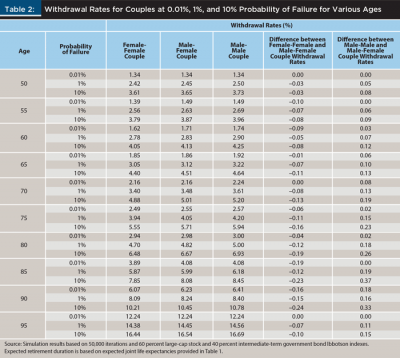
The withdrawal rates in Table 2 are the highest rates that produced the targeted probability of failure at the various ages. For example, at age 50 and 0.01 percent probability of failure for female-female couples, the simulation found five of 50,000 (0.01 percent) iterations in which a female-female couple experienced failure before the second member of the couple died when using a 1.34 percent real withdrawal rate. For each iteration, the simulation first checked whether either member of the couple was alive based on a random number generator and the probability of death for that year. If at least one person was alive, the simulation withdrew funds for the year and used a second random number to draw from the distributions of stock and bond returns and updated the portfolio. This process was repeated until age 100 if either member of the couple remained alive.
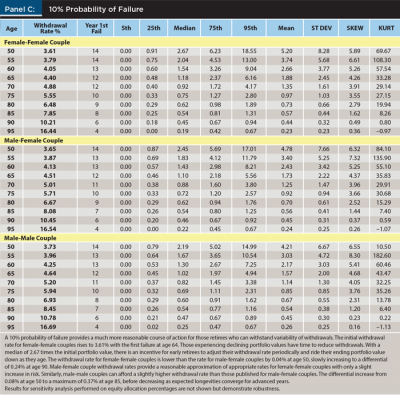
Heterosexual withdrawal rates ranged from 1.34 percent at age 50 to 12.24 percent at age 95. The male-male couple can withdraw only a slightly greater amount. At age 50, the increase in withdrawal rate was only 0.05 percent at a 1 percent probability of failure with the differential increasing for older retirees until it peaked at 0.19 percent at age 85. At 10 percent probability of failure, the differentials started at 0.08 percent and peaked at 0.37 percent at age 85.
For female-female couples, the greater joint life expectancy reduced recommended rates. Here, the differential started at –0.03 percent at age 50 and 1 percent probability of failure and peaked at –0.15 percent at age 90. At 10 percent probability of failure, the differentials began at –0.03 percent at age 50 and peaked at –0.24 percent at age 90.
The driving force in the differentials between heterosexual and same-sex couple retirement withdrawal rates is the relative change in expected remaining longevity. Male same-sex couples experienced their greatest percentage decrease in expected longevity at age 88. For same-sex female couples, the greatest percentage decrease in expected longevity was at age 91.
The rate of decrease in male same-sex couple expected longevity was greater than for female same-sex couples until age 86. These differences, along with time value, drive the slight changes in the withdrawal rate differentials. In general, the type of couple (male-male, male-female, or female-female) with the greater rate of decrease in expected longevity will tend to have more rapidly increasing withdrawal rates due to the greater rate of decrease in planning horizon.
Conclusions and Recommendations
Sustainable retirement withdrawal rates for same-sex couples vary in a systematic manner from withdrawal rates for heterosexual couples. However, because of life expectancy convergence at typical retirement ages, the differences are slight, and same-sex couples can reliably use withdrawal rates recommended for heterosexual couples with, at most, slight adjustments.
As expected, same-sex male couples, due to their lower joint life expectancy, have higher retirement withdrawal rates than heterosexual couples. The differential for same-sex male couples is as low as 0.05 percent at a 1 percent probability of failure at age 50, and as high as 0.19 percent at age 85. At a 10 percent probability of failure, the differential ranges from 0.08 percent at age 50 to a high of 0.37 percent at age 85. Similarly, retirement withdrawal rates for same-sex female couples are lower than those for heterosexual couples due to the longer life expectancy experienced by same-sex female couples. Same-sex female couples should reduce the retirement withdrawal rate recommendation for heterosexual couples by 0.03 percent at age 50 and by as much as 0.24 percent at age 90.
Retirees should periodically, preferably annually, adjust withdrawals based on current recommendations for their age, personal health, and remaining retirement assets. Of course, the recommended withdrawal rate is a maximum intended to help retirees spread the income over their remaining lifetime. Individual income timing preferences may suggest a different approach, and those retirees fortunate enough to not need all of their potential retirement income can reduce the likelihood of future portfolio failure by using a lower-than-recommended withdrawal rate. Retirees who choose to adjust annually can, if income variability is acceptable, employ the 10 percent probability of failure recommendations, because periodic adjustment provides protection against failure.
Additional results and analysis are provided in the Appendix.
Applications for Financial Planning Practitioners
Although same-sex couple retirement withdrawal rates differ systematically from rates for heterosexual couples, financial planners can assure their same-sex couple clients that due to mortality table convergence, those differences are modest.
Differences between same-sex and heterosexual couples at a SAFEMAX substitute of 0.01 percent are unreliable due to being in the tail of the distribution, but consistent in direction with higher probability of failure results. Because of the very low risk associated with SAFEMAX, same-sex couples probably can use heterosexual rates without adjustment. Additionally, personal health conditions and bequest concerns probably outweigh systematic differences for most couples.
Endnote
1. Joint life expectancy is the expected number of years (including fractions of years) that at least one member of a couple is alive. This is computed as follows:
a) From the life table described, for each participant, list the number living at each age from the starting age through age 100.
b) For each person, calculate at each age the probability of surviving from starting age (surviving lives divided by starting lives).
c) For each person, calculate at each age the probability of not surviving (1 minus the probability of surviving).
d) Calculate for each year the probability that both persons are dead (the product of probabilities of not surviving for each person).
e) Calculate for each year the probability that one or more person is alive (1 minus probability both are dead).
f) For each year in the future, calculate expected years of one or more living in that year (the average of beginning and ending probabilities).
g) Sum these up for starting age through age 99.
h) Add to this to account for survival beyond age 100 (approximated as the probability that one or more survives to age 100 multiplied by the life expectancy of one person at age 100).
All individual life expectancy and probability of living statistics were taken from CDC tables by sex, non-race specific (Centers for Disease Control 2010 Life Tables, National Vital Statistics Reports 63(7), 2014).
References
Bengen, William P. 1994. “Determining Withdrawal Rates Using Historical Data.” Journal of Financial Planning 7 (4): 171–180.
Blanchett, David M., and Brian C. Blanchett. 2008. “Joint Life Expectancy and the Retirement Distribution Period.” Journal of Financial Planning 21 (12): 54–60.
Cochran, Susan D., and Vickie M. Mays. 2015. “Mortality Risks Among Persons Reporting Same-Sex Sexual Partners: Evidence from the 2008 General Social Survey—National Death Index Data Set.” American Journal of Public Health 105 (2): 358–364.
Ducharme, Jamie K., and Marilou M. Kollar. 2012. “Does the ‘Marriage Benefit’ Extend to Same-Sex Union?: Evidence from a Sample of Married Lesbian Couples in Massachusetts.” Journal of Homosexuality 59 (4): 580–591.
Hatzenbuehler, Mark L., Anna Bellatore, Yeonjin Lee, Brian K. Finch, Peter Muennig, and Kevin Fiscella. 2014. “Structural Stigma and All-Cause Mortality in Sexual Minority Populations.” Social Science and Medicine 103: 33–41.
Pfau, Wade D. 2011. “Joint Life Expectancy and the Retirement Distribution Period.” www.Retirementresearcher.com, posted August 19, 2011.
Pfau, Wade D. 2015. “Making Sense Out of Variable Spending Strategies for Retirees.” Journal of Financial Planning 28 (10): 42–51.
Skinner, Daniel. 2015. “Critical Perspectives on LGBT Public Health.” Critical Public Health 25 (5): 509–512.
Citation
Mitchell, John B., Zachary S. Felton, and G. Thomas Mitchell. 2016. “Talking with Clients about Same-Sex Couple Retirement Withdrawal Rates.” Journal of Financial Planning 26 (6): 54–60.