Journal of Financial Planning: January 2014
John B. McDermott, Ph.D., is an associate professor of finance at Fairfield University’s Dolan School of Business. His research has been published in various journals including the Journal of Banking and Finance, Journal of Financial Markets, Journal of Business Finance and Accounting, and Journal of Futures Markets. He also is chief investment strategist at Symmetry Partners LLC. Send an email to John McDermott.
Dana D’Auria, CFA, is director of research at Symmetry Partners LLC. She also is a member of the firm’s investment committee. In addition to working on Symmetry’s white papers and research notes, she regularly delivers educational presentations to Symmetry’s adviser network. Send an email to Dana D'Auria.
Acknowledgments: Thanks to Marlena Lee, Savina Rizova, and two anonymous referees for their helpful comments. We also thank Gina Hawley for her able research assistance.
Executive Summary
- Since the seminal paper of Banz (1981) on the size effect, there has been considerable academic research and practitioner interest in investing in U.S. small capitalization stocks.
- This paper summarizes what the academic literature has to say about investing in U.S. small-cap stocks and also reviews the available index data on the issue of small- versus large-cap performance.
- Small-cap stocks have outperformed large-cap stocks on an absolute basis in the United States over the period 1926–2012. There is evidence that the absolute outperformance has been weaker in the period since 1981.
- Findings show that the size effect has been concentrated in the month of January and that small-cap stocks are riskier than large-cap stocks. There is economic logic to suggest the small-cap outperformance evidences a risk premium. Small value has outperformed small growth stocks on an absolute basis.
- This paper demonstrates that overweighting small-cap and small-cap value stocks can improve the risk-adjusted return of a portfolio.
A great amount of interest in small capitalization (small- cap) stock investing exists in the United States. The definition of small-cap is flexible. The Center for Research in Securities Prices (2012) (CRSP) defines small-cap as stocks below the median capitalization of the universe of NYSE stocks, while Russell (2013) defines small-cap as the first 2,000 stocks outside the largest 1,000 stocks in the United States. In general, small-caps are exclusive of mid- and large-caps. As of June 17, 2013, there were 1,865 open-end mutual funds and 64 ETFs defined as U.S. small-cap investment products with more than $478 billion in assets, according to data from Morningstar Direct.
Much of the interest in small-cap investing was arguably created by academic research. In 1981, Rolf Banz of the University of Chicago published an academic paper that evidenced a “size effect.” Specifically, he found that small-cap stocks had outperformed large-cap stocks in the United States over the period 1936–1975 on both an absolute and a risk-adjusted basis. Shortly thereafter, Reinganum (1981) published similar results. These papers created great interest in small-cap investing, as well as academic research into small-cap stocks. There were, however, detractors. Shumway and Warther (1999) attributed the small-cap effect to a delisting bias in the CRSP database, which is widely used to conduct financial research. Miller and MacKillop (2011) questioned the existence of the small-cap premium in the time period since the publication of Banz (1981), claiming that risk-adjustment based on the Sharpe ratio erases the small-cap premium post-Banz and even during the Banz period.
Advisers are forced to parse through the seemingly conflicting research to determine whether small-cap investing is a sensible approach. Several articles have been published in the last few years in the Journal of Financial Planning that address small-caps.
This paper attempts to summarize what is known about investing in small-cap stocks in the United States and provide some clarity with respect to small-cap stocks for advisers facing the asset allocation decision. The conclusion is that small-caps—particularly small value—have outperformed large-caps on an absolute basis and there is solid economic reasoning to support that this outperformance may represent a risk premium. Further, small-caps—particularly small value—over-weighted relative to their market weight, can offer an attractive contribution to a diversified portfolio.
Data and Measures
Have small-cap stocks outperformed large-cap stocks in the United States? To answer this question, we employ the used of various measures of small- and large-cap performance, as well as various timeframes. Because of the importance and prominence of Banz (1981), this paper refers to the period 1926–1975 as the “Banz period”1 and the period 1976 to the present as the “post-Banz period.”
To measure small stock performance in the United States over the period 1926–2012, we used the decile and quintile size portfolios published by the University of Chicago’s Center for Research in Security Prices (CRSP).2 Specifically, the CRSP10, CRSP9-10, and CRSP6-10 indexes capture the performance of stocks in the smallest decile, quintile, and half, respectively of U.S. stocks. The CRSP1, CRSP1-2, and CRSP1-5 indexes capture the performance of stocks in the largest decile, quintile, and half, respectively. The CRSP indices date to January 1926, and the data is reported through the end of 2012.
The well-known SmB (small minus big) factor also was employed, as well as the size and book-to-market research indexes published by Ken French on his data library website.3 These figures are commonly referred to as Fama/French data. Fama/French use the median NYSE market cap to demarcate between large and small stocks. The Fama/French measures date to July 1926. The well-known Russell 1000 (R1000) and Russell 2000 (R2000) indexes were used for post-January 1979 analyses and used to proxy large- and small-cap stocks, respectively.
Table 1 reports data for the small and large stock index risk and return over the 87-year period 1926–2012. The CRSP10 outperformed the CRSP1 index on average by 64 bps per month. On an annualized basis, the difference in returns was 391 bps (13.01 percent versus 9.10 percent). The results when comparing the CRSP9-10 to the CRSP1-2 were similar but muted. The average difference in monthly returns was 47 bps, and the difference in annualized return was 268 bps (12.02 percent vs. 9.34 percent). We also tested the significance of the difference in returns using a standard t test. The hypothesis that the small-cap and large-cap CRSP index returns are equal was rejected at the 95 percent confidence level.
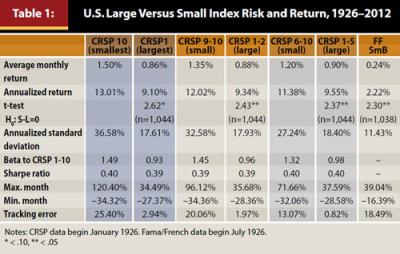
As another robustness check, the performance of the CRSP1-5 index was compared to the CRSP6-10 index and similar results were obtained. Small stocks, as measured by the CRSP6-10 index, outperformed large stocks, as measured by the CRSP1-5 index, by 30 bps per month (t = 2.37, p < .05) on average.
The final measure employed was the Fama/French SmB factor. The SmB factor is a measure of small stock performance relative to large stock performance, controlling for differences in book-to-market. The SmB factor has been shown to help explain the difference in stock returns along with the market and value factor in the Fama/French three factor model (1992, 1993). The annualized return of SmB from 1926–2012 was 2.22 percent; the monthly average return was statistically different from zero at the 5 percent level (t = 2.30). In sum, the empirical evidence from U.S. stock performance over the period 1926–2012 strongly supports the notion that small stocks have outperformed large stocks on an absolute basis.
Comparing Banz and Post-Banz Periods
The period of analysis in Banz (1981) ended in 1975. It makes sense then, to look at small-cap versus large-cap performance in the post-Banz period. The magnitude of the observed small-cap premium is smaller as compared to the period 1926–2012, but it is still positive. For example, the difference in average monthly returns between the CRSP10 and CRSP1 indices is 38 bps (355 bps on an annualized basis), and the difference is significant at the 10 percent level (t = 1.70). Similar results were obtained for the CRSP quintile and half returns, although the difference in returns of 31 bps per month for the half returns were significant at the 5 percent level (t = 2.05). Further, the SmB factor was positive (2.77 percent annualized) and significant at the 10 percent level (t = 1.88).
The results for the period 1976–2012 evidence a small-cap premium, although the evidence is not as strong as in the Banz period. As will be discussed later, in particular it is the poor performance of small-cap growth stocks that have obscured the premium that is available from investing in other small-cap, especially small-cap value stocks.
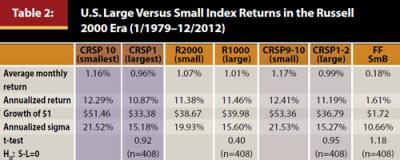
The well-known Russell 1000 and Russell 2000 indices date to January 1979. The Russell indices were used to examine the small-cap premium in the period 1979–2012. The results, while not strong, still support a small-cap premium. Table 2 reports the returns for the CRSP decile and quintile portfolios, the Russell indices, and SmB. Looking at Table 2, there is only weak evidence to support the size effect. It turns out that the years 1975–1983 were very good for small-caps. Omitting 1976–19784 from the sample period has a significant effect on the performance data. Although the average monthly returns for small-caps was greater than large-caps, the differences were not statistically different. The hypothesis that small-cap and large-cap returns are equal over the 33-year period 1979–2012 was not rejected.
Small-Cap Outperformance Is Not Assured
Consistent with previous findings, it is evident that although small-caps have outperformed on an absolute basis over the long term, it is important to note that they also frequently underperform large-caps.
Looking at SmB, small-caps out-performed large-caps about half the time when considering monthly returns (529 of 1,038 months). Further, there have been long consecutive periods of time when large-caps outperformed small-caps, as in the 12-month period between July 1972 and June 1973 when SmB was negative each month. Moreover, small-cap underperformance, as measured by drawdown, can be substantial, as in the 188-month period August 1983 through March 1999. Drawdown for this period was −81.72 percent for CPSP10 versus CRSP1, and −75.06 percent for CRSP9-10 versus CRSP1-2. This analysis shows that the small-cap premium, however measured, is far from a sure thing and is subject to significant risk. Thus, for an investor considering small-caps, a long time horizon is recommended to increase the likelihood of obtaining any small-cap premium.
The “Value Effect”
In addition to the “size effect,” substantial academic research (Basu 1983; Fama and French 1992, 1993, 1995, 1996, 1998) support a “value effect.” That is, value stocks have outperformed growth stocks on an absolute basis in the United States.
Value stocks are normally defined as those with a low market equity valuation relative to some accounting fundamental. Common value measures include high earnings to price, cash flow to price, book equity to market equity, and dividends to price. Therefore, a stock with a high P/E ratio (or low E/P ratio) would be a growth stock, and a low P/E stock would be a value stock.
It also is well known that the value effect is extremely strong in small-cap stocks. To examine the value effect within small-cap stocks, we examined the Fama/French 25 research portfolios sorted on size and book-to-market. The historical returns on the research portfolios also can be found on Ken French’s data website. We focused on the five portfolios in the smallest size quintile. The five small stock portfolios capture variation in book-to-market (BtM) among the smallest U.S. stocks.
Table 3 illustrates a strong value effect as stocks move from the lowest book-to-market (extreme growth) to the highest book-to-market quintile (extreme value). The difference in monthly returns between the extreme value and extreme growth portfolios was striking at 95 bps (1.67 percent as compared to 0.72 percent) on an annualized basis; the difference was almost 16 percent (16.38 percent as compared to 0.67 percent).5 Also, average monthly return and Sharpe ratio monotonically increased as small stocks moved from growth to value. Not surprisingly, the difference in returns between the extreme value and growth portfolios was statistically significant at the 1 percent level (t = 3.97).
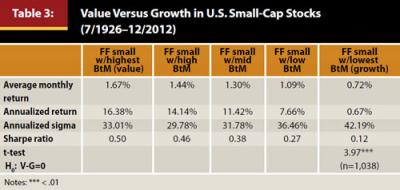
Clearly, all U.S. small stocks are not created equal. Small growth stocks have had relatively poor performance. Of the 25 Fama/French research portfolios that cover the U.S. market, the extreme small growth portfolio has the lowest monthly return (0.72 percent) and highest standard deviation (42.19 percent) over the entire July 1926 through December 2012 period; this also is true in the post-Banz (1976–2012) sub-period. The lack of a strong small-cap premium in the post-Banz period is driven by the poor performance of the extreme small growth firms.6 Recent research into profitability by Novy-Marx (2013) suggests that unprofitability may be the key to understanding why extreme small growth firms have performed so poorly.
Are Small-Cap Stocks Generally Riskier Than Large-Cap Stocks?
It is instructive to also look at the risk of small-cap and large-cap stocks. It is not sufficient to speak only to the differences in returns without considering risk. In fact, one of the more compelling arguments is the size effect results from a risk premium for the greater risk of investing in small-cap stocks. Risk can be measured in many different ways. A simple risk measure is the range of returns (maximum return less minimum return). Another is the standard deviation of returns. A third measure of risk is the market beta of stocks. The market beta can be estimated as the slope of a regression of the asset class on a market proxy. We use the CRSP 1-10 index as the market proxy. A market beta greater than one indicates greater risk as compared to the market.
Evidence from Table 1 shows that risk for small stocks is greater than for large stocks for all of the risk measures employed. The standard deviation of returns, market betas, and ranges of monthly returns all support small stocks being riskier than large stocks. Academic research has addressed the question of the economic reason for the greater risk of investing in small stocks. Vassalou and Xing (2004) found that small-cap stocks have greater distress risk. Liew and Vassalou (2000) also found that variations in Fama and French’s SmB factor (1992, 1993) can help predict macroeconomic business cycles. Amihud and Mendelson (1989) found that returns are higher for stocks that are less liquid (higher bid-ask spreads). They concluded that the additional return is compensation for liquidity risk.
The empirical evidence supports the hypothesis that observed higher returns for small-cap stocks are compensation for bearing greater systematic risk as compared to large-cap stocks. It is possible, however, that the small-cap premium is driven by behavioral considerations (Lakonishok, Schleifer, and Vishny 1994), such as investors having a preference for large stocks and bidding up their price and forcing down expected returns, or that stock returns can be explained by stock characteristics (Daniel and Titman 1997). Support that the size effect is compensation for systematic risk is also found in international markets (Bauman, Conover, and Miller 1998; Fama and French 1998; Rizova 2006).
Interestingly, the Sharpe ratios of all the indexes in Table 1 are about 0.40. This may contrast with results that have been reported elsewhere. The source of the differences may stem from the computation of the Sharpe ratio. The ratio was calculated in this paper by taking the average of the monthly differences in return between the asset in question and one-month T-bills as the proxy for the risk-free rate. That average excess return was then divided by its sample standard deviation over the entire time period. This gives the monthly Sharpe ratio, which was then multiplied by the square root of 12 to obtain the annualized Sharpe ratio. This is the manner of calculation prescribed by Sharpe (1994). Lo (2002) suggests this is appropriate in the absence of serial correlation in returns. However, common usage among practitioners is often to simply subtract the annualized T-bill rate from the annualized asset return and divide by annualized standard deviation.7 This method over-penalizes more volatile assets in a Sharpe ratio comparison, as the difference between the average and annualized return increases with volatility. Because the purpose here is to glean information on risk-adjusted returns of an asset class with higher standard deviation than the market, it is important that the analysis not inadvertently deduct for volatility twice and thus bias the results against small-caps.
The January Effect
A conclusion of Fama’s (1970) weak form of market efficiency is that there should not be patterns in stock returns. Notwithstanding theory, there are well-known seasonal patterns in stock returns, including what has become recognized as the “January effect.” Rozeff and Kinney (1976) found that an equally weighted portfolio of NYSE stocks earned 3.48 percent in January in the period 1904–1974, but only 0.42 percent in the remaining 11 months over the same period. The subsequent research of Roll (1983) and Reinganum (1983) into the January effect established the anomaly as a small-cap stock phenomenon. Since this early research, it has been well-established that stock returns have been greater in January than would be expected in an efficient market (Haug and Hirschey 2006; Haugen and Jorian 1996). The January effect remains an efficient market anomaly but also an important part of the small-cap effect. The average monthly returns for the CRSP10 and CRSP9-10 indexes in January are 9.79 percent and 7.60 percent, respectively, compared to only 0.98 percent for the CRSP1 index.
The returns for both large and small stocks are greater in January compared to the rest of the year, but the effect is significantly greater for small-cap stocks. The difference in January returns of 8.81 percent between the CRSP10 and CRSP1 is highly significant. For SmB, the average return for January is 2.28 percent. Further, January and February are the only months in which SmB is both positive and statistically different than zero. The primary reason explored in the literature for this finding is that January returns are driven by tax-loss selling in December followed by investors reentering the market after the turn of the year.
The Usefulness of Adding or Overweighting Small-Cap Stocks
Considered on a standalone basis, the additional risk of small-cap stocks mitigates some of their increased performance. The choice of risk measure will determine whether large-caps or small-caps outperform on a risk-adjusted basis in any given period. However, this is academic to most investors who are not contemplating an all or nothing small-cap versus large-cap portfolio. Rather, most investors seek to use small-caps in conjunction with large-caps. Should they? The answer is not obvious.
An MSCI working paper by Bender, Briand, Fachinotti, and Ramachandran (2012) noted that institutional investors actually underweight small-cap stocks globally despite the diversification benefits. The desirability of small-caps is not simply determined by comparing the risk-adjusted returns of small and large-caps because of the advantage associated with diversification. This benefit is due to the fact that the returns on small- and large-caps are not perfectly correlated. When one is down, the other may be up, or at least down less. To the extent that the movements in one asset class offset those in another, the overall portfolio can enjoy higher expected returns per unit of risk. Such is the power of diversification, that in some cases it can make perfect sense to add a highly volatile asset class with lower or even negative expected return, such as a futures-based VIX Index tracker, if the addition is sufficiently uncorrelated or negatively correlated with the existing portfolio.
As a first step, one can look at whether adding small-cap stocks will improve the mean-variance efficiency of a large-cap portfolio using a relatively simple equation. If the Sharpe ratio of the small-cap asset is greater than the Sharpe ratio of the large-cap portfolio multiplied by the correlation of the two, then it makes sense to consider a combination.8 Using the CRSP1-2 (large) and CRSP9-10 (small) indexes, the correlation in monthly returns going back to 1926 is 0.78. The Sharpe ratios are 0.394 for the large-cap index, and 0.389 for the small-cap index. Multiplying 0.394 times the correlation of 0.78 equals 0.307, which is less than the 0.389 of the small-cap figure on its own. This indicates that one can improve the portfolio’s overall Sharpe ratio by including small stocks, even though on its own, it has a lower Sharpe ratio.
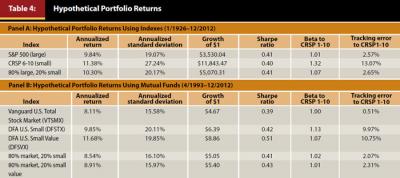
Panel A of Table 4 presents the findings for an easily constructed monthly rebalanced portfolio that combines a large-cap index (S&P 500) with a small-cap index (CRSP6-10), at a naïve 80/20 weighting.9 As was demonstrated earlier, small value stocks in particular outperform on an absolute basis. It is also worth looking at how adding only small value to a portfolio impacts risk-adjusted performance. The findings favor adding small-caps to a large-cap portfolio. The annualized returns of the blended 80/20 portfolio over the period 1926–2012 are greater than the S&P 500 (10.30 percent versus 9.84 percent), while the annualized standard deviation of the 80/20 is only marginally higher—the Sharpe ratios are equal at 0.41. The beta of the 80/20 portfolio increases to 1.07 from 1.01. Finally, the tracking error of the 80/20 portfolio relative to the market is only 2.65 percent, which is comparable to the S&P 500 at 2.57 percent. In sum, adding small-cap stocks to a large-cap portfolio increases return and risk without a reduction in the Sharpe ratio or a substantial increase in tracking error.
Because small-cap (particularly small-cap value stocks) have outperformed large-caps, it is natural to ask if it makes sense to overweight these securities relative to their market value weight. To answer the question, practical considerations such as higher costs—both in terms of management fees and trading expenses—for small-cap stocks should be taken into account. Thus, a relevant question is whether, after the higher costs and volatility associated with small-cap investing, does it still makes sense to hold or even overweight small-caps along with their relatively cheaply obtained large-cap counterparts?
Panel B of Table 4 considers a blended portfolio of the U.S. market and an overweight position in small-cap and small-cap value stocks. Vanguard’s Total Stock Market fund (VTSMX) was used as the investment vehicle for the market exposure, and Dimensional Fund Advisors Small-Cap (DFTSX) and Small-Cap Value (VTSVX) were used for the overweight positions.10 The longest available time period of mutual fund returns (April 1993 to December 2012) was used to generate Panel B. The reported returns are pre-tax, net of fund expenses, based on the assumption that the portfolio was rebalanced monthly. Panel B demonstrates that findings in favor of overweighting small-cap and small-cap value stocks relative to the market are not invalidated in a real-world environment that includes implicit and explicit trading costs and management fees.11
Consistent with the index findings in Panel A, the risks of the 80/20 small and small value portfolios are greater than the market as measured by beta, standard deviation, and tracking error. The Sharpe ratio of the 80/20 Vanguard/DFA portfolios, however, are greater than that of the Vanguard TSM fund. The increase is especially impressive for the Vanguard/DFA Small Value portfolio where the annualized return is 80 bps higher as the Sharpe ratio increases to 0.43 from 0.39.
Conclusions
Given the evidence on U.S. small-cap investing, how should an adviser act when allocating a client’s portfolio? Modern portfolio theory suggests starting with the market portfolio. That is to say, an investor should hold small-cap stocks at their market value weight as a part of a well-diversified equity portfolio.
The answer to the question as to whether a particular investor should overweight U.S. small-cap stocks is more nuanced. The long-term U.S. evidence suggests that the additional risk of holding small-cap stocks is compensated with additional expected return. This is the nature of systematic risk. There are investors willing to accept the risk associated with investing in small value stocks and they are compensated with additional expected return for bearing the risk. Conversely, there are some investors who do not wish to bear the risk and are satisfied with a lower expected return. In the end, the market portfolio is held by investors; therefore, if some investors overweight small value stocks, then there will be investors who underweight the same stocks. Clearly then, not all investors should or are even able to overweight small value stocks.
The evidence supporting the size effect is not as compelling in the period since 1975. There is, however, strong evidence supporting U.S. small-cap value stocks earning a significant premium. In addition to the empirical evidence, economic theory suggests there are reasons to expect that small-cap stocks, especially small-cap value stocks, are riskier and therefore investors should expect higher returns as compensation for the greater risk. If an investor is willing to accept the greater risk of small value stocks, overweighting may make sense.
An investor (or an adviser), however, should consider the nature of the risks that impact wealth (including human capital) that are outside the portfolio allocation decision. For example, for investors who have small-value stocks in their employee stock ownership plan (ESOP), or have equity-based compensation in a small-value firm, or are owners of small-value businesses, overweighting small value stocks in their portfolio may unacceptably concentrate risk. For investors able to take on additional small value risk, overweighting to a reasonable extent seems likely to increase expected return. If the small stock premium does not exist, overweighting small-cap stocks increases portfolio risk without an increase in expected return.
In closing, overweighting small value stocks in the United States represents an opportunity for some investors to increase their expected return and risk-return tradeoff with only a modest increase in standard deviation and tracking error. There are many excellent vehicles in both the ETF and open-end mutual fund space to achieve this exposure in a low-cost and tax-efficient manner.
Endnotes
- Banz (1981) actually analyzed the period 1936–1975. The analysis can now be extended back to 1926 to take advantage of the longer time period.
- Mutual fund returns are from Morningstar through Zephyr StyleADVISOR.
- See http://mba.tuck.dartmouth.edu/pages/faculty/ken.french/data_library.html.
- The small-cap premium as measured by SmB was 12.13 percent in 1976, 23.67 percent in 1977, and 15.35 percent in 1978.
- The 0.67 percent seems strikingly low. The annualized return of the highest growth small quintile is less than its monthly return due to the extreme volatility. The average return is reduced by approximately one half the variance, in this case, about 8 percent.
- In the post-Banz period (1976–2012), there is strong evidence of a small-cap premium in value stocks. Specifically, the FF Small Value portfolio outperformed the FF Large Value portfolio by 53 bps per month (1.64 percent versus 1.11 percent). The difference in average monthly return is significant at the 5 percent level (t = 2.47).
- Methodologies vary in industry. For example, in 2005 Morningstar adopted the Sharpe (1994) methodology while Zephyr StyleADVISOR still uses the annualized return methodology.
- See Appendix A in Elton, Gruber, and Rentzler (1987).
- According to Standard and Poor’s (us.spindices.com/indices/equity/sp-500), the S&P 500 represents about 80 percent of the market capitalization of the U.S. market.
- Dimensional Fund Advisors has a long history of live mutual fund returns that focus on U.S. small-cap and small-cap value asset classes.
- The approximate market value overweight is 3x for the small-cap and 5x for the small value 80/20 portfolios.
References
Amihud, Yakov, and Haim Mendelson. 1989. “The Effects of Beta, Bid-Ask Spread, Residual Risk, and Size on Stock Returns.” Journal of Finance 44 (2): 479–486.
Banz, Rolf. W. 1981. “The Relationship between Return and Market Value of Common Stocks.” Journal of Financial Economics 9 (1): 3–18.
Basu, Sanjoy. 1983. “The Relationship between Earnings Yield, Market Value, and Return for NYSE Common Stocks: Further Evidence.” Journal of Financial Economics 12 (1): 129–156.
Bauman, W. Scott, C. Mitchell Conover, and Robert E. Miller. 1998. “Growth Versus Value and Large-cap Versus Small-Cap Stocks in International Markets.” Financial Analysts Journal 54 (2): 75–89.
Bender, Jennifer, Remy Briand, Giacomo Fachinotti, and Sivananth Ramachandran. 2012. “Small Caps–No Small Oversight: Institutional Investors and Global Small-Cap Equities.” MSCI Research Insight. www.msci.com/resources/research_papers/small_caps_-_no_small_oversight.html.
Center for Research in Securities Prices. 2012. Data Descriptions Guide: CRSP US Stock and US Index Databases. University of Chicago. March 29.
Daniel, Kent, and Sheridan Titman. 1997. “Evidence on the Characteristics of Cross Sectional Variation in Stock Returns.” Journal of Finance 52 (1): 1–33.
Elton, Edwin J., Martin J. Gruber and Joel C. Rentzler. 1987. “Professionally Managed, Publicly Traded Commodity Funds.” The Journal of Business 60 (2): 175–199.
Fama, Eugene F. 1970. “Efficient Capital Markets; A Review of Theory and Empirical Work.” Journal of Finance 25 (2): 383-417.
Fama, Eugene F., and Kenneth R. French. 1992. “The Cross-Section of Expected Stock Returns.” Journal of Finance 47 (2): 427–465.
Fama, Eugene F., and Kenneth R. French. 1993. “Common Risk Factors in the Returns on Stocks and Bonds.” Journal of Financial Economics 33 (1): 3–56.
Fama, Eugene F., and Kenneth R. French. 1995. “Size and Book-to-Market Factors in Earnings and Returns.” Journal of Finance 50 (1): 131–155.
Fama, Eugene F., and Kenneth R. French. 1996. “Multifactor Explanations of Asset Pricing Anomalies.” Journal of Finance 51 (1): 55–84.
Fama, Eugene F., and Kenneth R. French. 1998. “Value Versus Growth: The International Evidence,” Journal of Finance 53(6): 1975–1999.
Haug, Mark, and Mark Hirschey. 2006. “The January Effect.” Financial Analysts Journal 62 (5): 78–88.
Haugen, Robert A., and Philippe Jorian. 1996. “The January Effect: Still There After All These Years.” Financial Analysts Journal 52 (1): 27–31.
Lakonishok, Josef, Andrei Schleifer, and Robert W. Vishny. 1994. “Contrarian Investment, Extrapolation, and Risk.” Journal of Finance 49 (5): 1541–1578.
Liew, Jimmy, and Maria Vassalou. 2000. “Can Book-to-Market, Size, and Momentum Be Risk Factors that Predict Economic Growth?” Journal of Financial Economics 57 (2): 221–245.
Lo, Andrew W. 2002. “The Statistics of Sharpe Ratios.” Financial Analysts Journal 58 (4): 36–52.
Miller, Gary A., and Scott A. MacKillop. 2011. “Rethinking Small Caps.” Financial Advisor. www.fa-mag.com/news/rethinking-small-caps-8117.html.
Novy-Marx, Robert. 2013. “The Other Side of Value: The Gross Profitability Premium.” Journal of Financial Economics 108 (1): 1–28.
Reinganum Marc R. 1981. “Abnormal Returns in Small Firm Portfolios.” Financial Analysts Journal 37 (2): 52–56.
Reinganum, Marc R. 1983. “The Anomalous Stock Market Behavior of Small Firms in January: Empirical Tests for Tax-Loss Selling Effects.” Journal of Financial Economics 12 (1): 89–104.
Rizova, Savina. 2006. “International Evidence on the Size Effect.” Dimensional Fund Advisors. www.tma-invest.com/files/investment_research/international_evidence_on_the_size_effect.pdf.
Roll, Richard. 1983. “Vas ist Das?” Journal of Portfolio Management 9 (2): 18–28.
Rozeff, Michael S., and William R. Kinney Jr. 1976. “Capital Market Seasonality: The Case of Stock Returns.” Journal of Financial Economics 3 (4): 379–402.
Russell Investments. 2013. “Russell U.S. Equity Indexes Construction and Methodology.”
June. www.russell.com/indexes/documents/methodology.pdf.
Sharpe, William F. 1994. “The Sharpe Ratio.” Journal of Portfolio Management 21 (1): 49–58.
Shumway, Tyler, and Vincent A. Warther. 1999. “The Delisting Bias in CRSP’s NASDAQ Data and Its Implications for the Size Effect.” Journal of Finance 54 (6): 2361–2379.
Vassalou, Maria, and Yuhang Xing. 2004. “Default Risk in Equity Returns.” Journal of Finance 59 (2): 831–868.
Citation
McDermott, John B., and Dana D’Auria. “What Do We (Really) Know About U.S. Small-Cap Investing?” Journal of Financial Planning 27 (1): 46–52.