Journal of Financial Planning: January 2011
Harold J. Schleef, Ph.D., is associate professor of economics at Lewis & Clark College where he teaches finance, statistics, and mathematical modeling. His education includes a B.S. from Valparaiso University, an M.S. from Oregon State University, and a Ph.D. from the University of Chicago.
Robert M. Eisinger, Ph.D., is the dean of the School of Liberal Arts at the Savannah College of Art and Design. He is a political scientist (B.A., Haverford College; M.A., Ph.D., University of Chicago) with scholarly interests in finance, public opinion, and American politics.
Executive Summary
- Life-cycle funds (LCFs) vary, both in the initial proportion of equity/ bond asset allocation and in the pattern of decline of equity investments over time.
- We attempt to answer the following questions: How do life-cycle funds perform relative to alternative asset allocation strategies? What impact, if any, does the inclusion of international equity investments have on the likelihood that one successfully reaches a predetermined retirement goal?
- Using Monte Carlo simulations, we analyze numerous hypothetical portfolios and conclude the following:
- Inclusion of foreign equities in the portfolio allocation improves the likelihood of reaching one’s retirement goal.
- Simple generic portfolios that maintain a fixed proportion of assets in equities throughout the entire planning period produce higher probabilities of reaching target values than LCFs.
- Comparing typical life-cycle fund glide paths (decreasing equity allocations over time) to corresponding reverse glide paths (increasing equity allocations over time) reveals that the reverse glide paths achieve a lesser probability of failure to reach a $1 million target. - Our research underscores the importance of recognizing and explaining the probabilistic nature of various investment strategies, especially those that allege decreasing equities over time as being advantageous in achieving investment goals. The asset allocation strategies of many LCFs may not provide the best portfolio risk protection when measured in terms of probability of reaching a specific portfolio target.
The recent turbulence of the domestic and international stock markets, most notably the significant decline in 2008 of major stock market indexes, has brought new interest to portfolio diversification and asset allocation strategies. Financial literacy has become more than a buzzword; it has become a credo for financial planners and journalists who seek to educate investors, especially after many investors experienced significant losses.
One understudied aspect of this financial education is the recent popularity of life-cycle, or target-date mutual funds, and the risks inherent in these funds. Although many funds include global equities, the effect of varying the level of global equities has received scant attention. In this paper, several hypothetical life-cycle funds (LCFs) are analyzed in terms of volatility risk and probability of failure to reach target values. The methodology of Monte Carlo simulation is applied by using historical rates of return data reported by Ibbotson & Associates for large-cap stocks, corporate bonds, and the MSCI-EAFE Index (international index).
Literature Review
The literature on retirement planning is extensive. A sampling of recent studies includes Israelsen and Walker (2006), Opdyke (2006), and Vora and McGinnis (2000). Interest and research related to life-cycle funds are relatively recent and include Dunleavey (2010), Kim (2010), Laise (2006), Mincer (2006), and Schleef and Eisinger (2007). While specific asset allocations for each life-cycle fund differ, all of the life-cycle allocation strategies advocate shifts away from equities in favor of bonds and cash as the investor approaches a retirement target date (see, for example, Israelsen and Walker 2006). Schooley and Worden (1999) report empirical evidence that investors’ risk preferences, expressed in a 1989 survey, are consistent with the glide paths of the typical LCF. The primary results of this paper assume a planning period of 30 years, although similar outcomes are obtained by assuming shorter planning periods such as 10 or 20 years. Shortfall risk of LCFs is studied by Lewis (2008), who concludes that increasing levels of equities in LCFs decreases long-term risk of shortfall. Several authors, such as Booth (2004) and Gunthorpe and Levy (1994), have studied the relationship between time horizon and asset allocation.
The notion of international diversification is a natural extension of the seminal work of Markowitz (1959). Expanding the set of possible assets from which an optimal portfolio is selected may decrease risk for any given rate of return. International diversification of portfolios has been the topic of several studies, including Bhargava, et al. (2004), Hanna, et al. (1999), and Solnik (1995). All of these studies examine international diversification in terms of the capital asset pricing model. Cooley, et al. (2003) uses Monte Carlo simulation to analyze sustainable withdrawal rates for portfolios that include international equities.
In this paper we use simulation and value at risk (VAR) methods to analyze portfolio risk. With the VAR method, probabilities are directly associated with achieving specific terminal values. These probabilities provide a more direct measure of risk in contrast to inferring uncertainty and risk from combinations of means and standard deviations. Lewis, Okunev, and White (2007) apply the VAR method to the problem of asset allocation. The VAR method is extended specifically to asset allocation in LCFs in Lewis and Okunev (2009), where it is claimed that VAR methods have the potential to deliver terminal wealth amounts that are greater than wealth amounts generated by the typical LCF glide path.
Methodology
Consider the following hypothetical individual. A 30-year-old woman who is building a retirement portfolio seeks a target value of $1 million (real dollars) in 30 years. Assume that she plans to invest $12,000 (real dollars) per year in this portfolio. The assumed annual contribution amount of $12,000 amortized over 30 years with a target amount of $1 million implies a real rate of return of 6.30 percent. A real rate of return of 6.30 percent corresponds to a nominal rate of 10 percent to 11 percent, given post World War II rates of inflation. $12,000 per year, or $1,000 per month, is a realistic amount to a wide range of investors. Although some studies consider monthly contributions, for simplicity, it is assumed that annual contributions to the portfolio are made at the end of each year with allocation rebalancing occurring at that time.
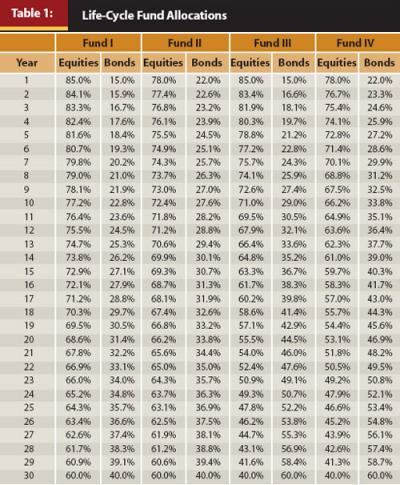
Four hypothetical LCFs are considered as potential investments for this woman, each with a different glide path. Each of the glide paths for Funds I, II, III, and IV begins with allocation to equities ranging from 78 percent to 85 percent. In subsequent years, the equity allocation decreases linearly as the percentage allocation to corporate bonds increases. Hence, the glide is downward toward an increased bond allocation and a decreased equity allocation.
The glide paths for the four LCFs are reversed to produce four additional funds for comparison purposes. That is, we begin with a high bond allocation, and the glide path results in an increased equity allocation. The four LCF allocations are displayed in Table 1. Nine simple, or generic, allocations are considered as well. For each of these cases, a constant allocation of equities and corporate bonds is maintained for the entire 30 years. The allocation percentages for equities range from a high of 100 percent with successive incremental reductions of 10 percent to a low of 20 percent equities.
Data reported from 1970 through 2008 by Ibbotson & Associates (2009) for the three separate time series indexes of large-cap stocks, MSCI-EAFE (international) stocks, and corporate bonds are the basis for the analysis. The period 1970 through 2008 is chosen, given that 1970 is the first year that the MSCI-EAFE Index is reported. The period 1970 through 2008 covers a wide range of economic events including recessions, robust economic growth, terrorist attacks, and wars.
The effects of incorporating international equities into retirement portfolios are evaluated by varying the equity allocations for the generic portfolio of 100 percent equities. The MSCI-EAFE equities are assumed to comprise specific percentages in 10 percent increments, concluding with an equity allocation of 100 percent MSCI-EAFE.
Traditional portfolio risk analysis frequently focuses on volatility that is measured as standard deviation of return. Of equal if not greater importance than volatility is risk measurement by value at risk methods. With VAR, attention is focused on probabilities of achieving (or failing to achieve) targeted outcomes. Combining volatility measures with VAR methods provides a more complete risk analysis than considering volatility alone. Even though return volatility is relevant to measuring risk, volatility of terminal wealth outcomes is particularly relevant to analyzing portfolio risk. In the following sections, portfolio risk is analyzed considering both VAR and volatility of terminal portfolio values.
Each portfolio analyzed is simulated with 10,000 trials using Monte Carlo techniques. Each trial includes 30 years of simulated portfolio performance focusing on the statistical properties of the terminal value. A major challenge to simulating portfolios is addressing time series and covariance characteristics of the different asset categories. An analysis of the returns data indicates that serial correlation does not appear to be present in any of the three asset category indexes of large-cap stocks, MSCI-EAFE, and long-term corporate bonds.
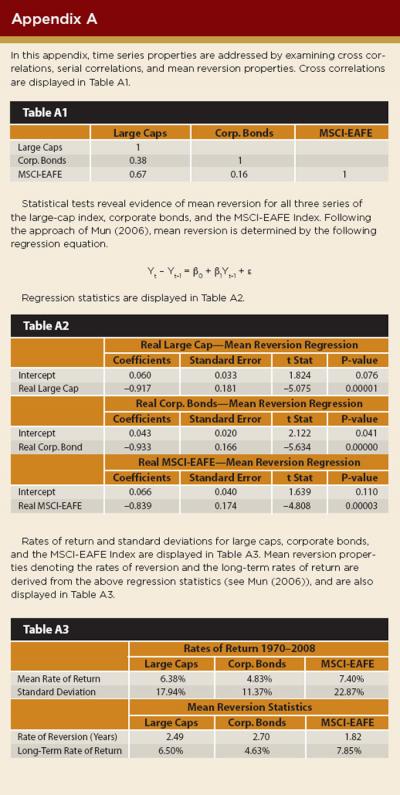
Cross correlations across asset categories are captured by including the covariance of error terms observed in estimating parameters of the mean reversion model. Appendix A shows regression analysis results. Also, see Mun (2006) for mean reversion models used in this analysis. Real rates are used to estimate the statistical properties of all three asset category indexes. As noted above, the data used in the analysis cover the years 1970 through 2008. The mean real rate of return for the MSCI-EAFE Index is 7.40 percent. The mean real rates of return for large-cap stocks and long-term corporate bonds during this period are 6.38 percent and 4.83 percent, respectively.
The International Effect
Including the MSCI-EAFE Index returns in the allocations provides the opportunity to examine the effects of international equities on portfolio performance. Figure 1 displays the probability of failure to reach target values of $1 million and $750,000 in 30 years for MSCI-EAFE percentages ranging from zero to 100 percent. With 20 percent of the equity allocation designated as MSCI-EAFE equities, risk as measured by probability of failure to reach $1 million is reduced by approximately 0.03 compared to the case of allocating zero percent MSCI-EAFE equities to the portfolio. As the percentage of MSCI-EAFE equities is increased beyond 20 percent, probability of failure continues to decrease at diminishing rates.
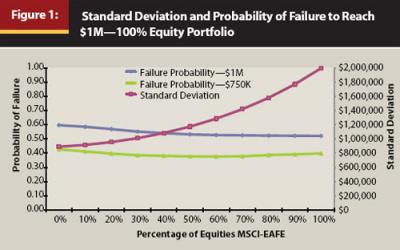
MSCI-EAFE allocations greater than 30 percent produce relatively high levels of volatility with only moderate improvements in reduced probabilities of failure. For target portfolio values of $750,000, the effect of increasing the MSCI-EAFE allocation is mixed with failure probabilities increasing slightly as the percentage of MSCI-EAFE exceeds 60 percent. The above observations apply to portfolios with 100 percent equities. Nevertheless, for all generic portfolios with 60 percent or more equities, allocating 20 percent of equities to MSCI-EAFE causes reductions of 0.028 to 0.029 in the probabilities of failure to reach the $1 million target. For example, the 60/40 generic portfolio, composed of 48 percent large-cap stocks, 12 percent MSCI-EAFE stocks, and 40 percent corporate bonds, has a $1 million failure probability of 0.630 compared to a failure probability of 0.658 for a generic 60/40 portfolio without any MSCI-EAFE allocation. The generic 50/50 portfolio with 20 percent MSCI-EAFE equities has a failure probability that is 0.021 less than the same portfolio with no MSCI-EAFE allocation. At virtually all percentile levels, terminal values obtained with 10 percent MSCI-EAFE allocations are greater than terminal values with zero percent MSCI-EAFE. The same is true for the case of 20 percent MSCI-EAFE, clearly indicating that the portfolios with MSCI-EAFE securities are statistically significant and advantageous for the investor.
Standard Deviation and Failure to Reach the Target
Table 2 displays statistics for all 17 portfolios analyzed in descending order of mean (average) terminal values. Not surprisingly, portfolios with the largest mean values also have the highest standard deviations. However, portfolios with higher standard deviations realized the lowest probabilities of failing to reach the 30-year $1 million target.
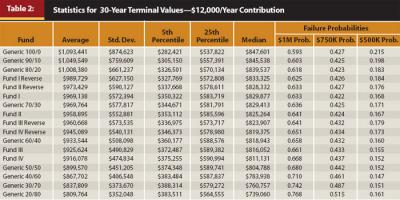
Figure 2 displays the relationship between probability of failure to reach target values and the standard deviations of terminal values for the 17 portfolios considered. Probability of failure to reach $1 million ranges from a low of 0.593 for the generic 100/0 to a high of 0.768 for the generic 20/80 portfolio. Only three portfolios achieved mean values of $1 million or more while the median values for all portfolios were less than $850,000. The mean rates of return for the remaining 14 portfolios are all less than 6.30 percent. Note that the mean terminal values exceed median terminal values for all portfolios, indicating that terminal values are skewed to the right.
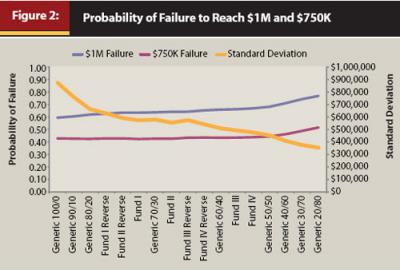
As probability of failure to reach the $1 million target increases, standard deviation tends to decrease. A similar pattern prevails for the $750,000 target. Interestingly, the probability of failing to reach a target value of $750,000 covers a narrow range of 0.427 to 0.442 when excluding the three generic portfolios with the smallest equity allocations (40/60, 30/70, 20/80). Including MSCI-EAFE equities in the equity allocations produces a similar relationship between standard deviation of terminal value and probability of failing to reach target values. As stated above, inclusion of 20 percent MSCI-EAFE equities reduces failure probabilities by 0.02 to 0.03 for a $1 million target.
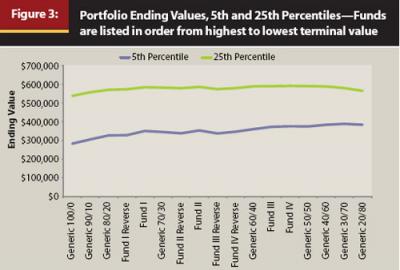
Another method for assessing portfolio risk is to observe terminal values at small percentile levels. Figure 3 displays terminal values for the 5th and 25th percentiles. In these cases, the more conservative portfolios with low levels of equities outperform the more equity-heavy portfolios. At the 5th percentile, terminal values range from $388,314 for the generic 30/70 portfolio to $282,421 for the generic 100/0 portfolio. 5th percentile values for the hypothetical LCF funds are highest for the more conservative funds. Nevertheless, the generic 20/80, generic 30/70, and generic 60/40 portfolios have 5th percentile terminal values greater than any of the LCF portfolios considered. Consequently, LCFs are dominated by generic portfolios at the low percentile levels.
Put another way, at the low end, volatile (high-equity-allocated) funds will yield similar portfolio terminal values as conservative funds. At the high end, those volatile funds are likely to achieve much higher terminal values and lower probabilities of failing to reach a target amount of $1 million.
Reversing the Glide Path
The pattern of asset allocations for LCFs over time, also referred to as the glide path, calls for higher levels of equities at the beginning of the planning period with the percentages of assets devoted to equities diminishing over time. For comparison purposes, the glide paths are reversed for each of the four LCFs analyzed. Figure 4 displays failure probabilities for the four LCFs and their corresponding reverse glide paths.
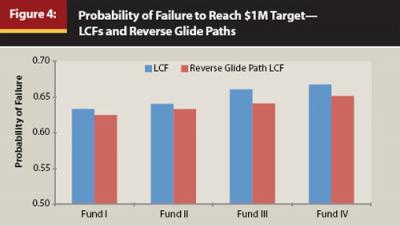
Consider the probability of failing to reach the $1 million target for each glide path and its corresponding reverse glide path. Comparing each original glide path with its corresponding reverse glide path reveals that the reverse glide path achieves a lesser probability of failure to reach the $1 million target in each of the four LCFs. When a target of $750,000 is established, failure probabilities are nearly constant across all eight portfolios considered.
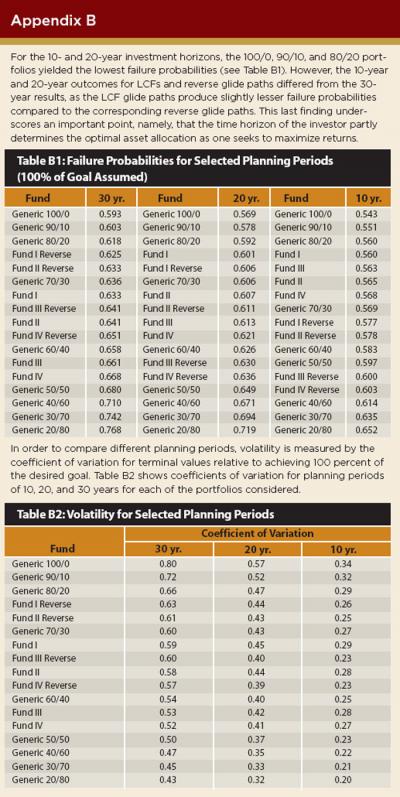
The above results are based on assumed planning periods of 30 years. Some investors have a shorter or longer planning horizon, perhaps as short as 10 years. Failure probabilities to reach a $1 million goal for planning periods of 10 and 20 years, in addition to the 30-year investment horizon in this paper, have also been analyzed. A comparison of these different planning periods is reported in Appendix B.
Discussion
The above analysis yields four important findings as it relates to asset allocation theory and practice. First, despite the current volatility and decline in the equity markets, the Monte Carlo simulation models demonstrate that a significant equity exposure is the most successful course of action for a hypothetical investor with a 30-year time horizon who seeks to achieve a target balance of $1 million by investing $12,000 annually. Simply put, conservative equity allocations, whether they are generic or in LCFs, tend to perform poorly relative to more aggressive asset allocation strategies. This poor performance is especially evident at the upper percentile levels of the simulated values. While there may be limited advantages to be gained with conservative portfolios at the lower (5th percentile) end, the same is not the case at the higher (50+ percentile) end.
This last point underscores how investor perception of risk and risk tolerance often determine how assets are allocated. An investor who loses sleep with an aggressive (equity-heavy) portfolio may prefer a more conservative one, even if it is likely to yield less wealth after 30 years. Put another way, 30 years of lost sleep is not necessarily outweighed by the ultimate benefits of more wealth upon retirement. However, for those who are willing to withstand volatility, the increased equity allocations generally yield more wealth, especially in the upper-percentile levels of terminal values with concomitant moderate increases of downside risk. These findings suggest the need for financial professionals, scholars, and journalists to educate people about what constitutes risk. Investors who are willing to live with more volatility are likely to reap the financial benefits of that type of risk.
Second, the above analysis questions the viability and underlying asset allocation logic of many life-cycle funds. While life-cycle funds decrease equity exposure over time, the simulation models reveal that an increased exposure to equities over 30-year periods yields equal or superior results to the hypothetical portfolios based on real LCFs. Generic portfolios that include equity allocations of 70 to 80 percent provide performance that is equal or superior to LCFs.
In the end, the individual investor must evaluate the trade-off between investing in the portfolio that provides moderate risk protection on the downside and the portfolio with high upside potential. For example, the 25th to 50th percentile (inter-quartile) range for Fund IV is $590,994 to $1,120,199. In contrast, the inter-quartile range for the generic 80/20 portfolio is $570,134 to $1,253,116. The 10th percentile to 90th percentile range for Fund IV is $443,513 to $1,504,226 compared to the 10th percentile to 90th percentile range of $397,401 to $1,804,976 for the 80/20 generic portfolio.
Third, exposure to international equities in all except the most conservative generic portfolios decreases failure probabilities by 2 to 3 percentage points. Including international equities that perform with moderately greater mean rates of return and greater standard deviations adds diversification to the portfolio with moderate and real, but relevant, reductions in failure probabilities. With the higher average returns from large caps and MSCI-EAFE equities, an annual investment of $12,000 produces expected terminal values exceeding the $1 million target. For example, the 70/30 portfolio with equities allocated as 80 percent large caps and 20 percent MSCI-EAFE achieves a mean terminal value of $1,008,087, whereas the median is $861,235. Financial planners should exercise caution when projecting portfolio values that only focus on mean portfolio values.
Fourth and finally, it should be noted that mean reversion properties of the three asset categories offer insight as to why equities tend to perform well in retirement portfolios. Mean reversion rates, measured in years, for the three asset categories are 1.82, 2.49, and 2.70 years for MSCI-EAFE equities, large caps, and corporate bonds, respectively (see Appendix A). In other words, equities tend to revert to the mean on average from 1.8 to 2.5 years with a somewhat longer time of 2.7 years for bonds. Note that the predicted reversion rates of return of 6.50 percent, 4.63 percent, and 7.85 percent for large-cap stocks, long-term corporate bonds, and the MSCI-EAFE Index, respectively, are similar to the corresponding historical rates of 6.38 percent, 4.83 percent, and 7.40 percent.
Conclusion
In recent years, life-cycle funds have been heavily marketed to investors saving for retirement. The increased awareness of LCFs has no doubt caused many individuals to address the issues of investing for retirement. Nevertheless, the asset allocation strategies of many LCFs may not provide the best portfolio risk protection when measured in terms of probability of reaching a specific portfolio target. The results reported above reveal that simple generic portfolios that maintain a fixed proportion of assets in equities throughout the entire planning period provide higher probabilities of reaching target values than LCFs. The attractiveness of simple generic portfolios, which maintain constant proportions of equities and bonds, is consistent with the conclusions of Canner, et al. (1997). They question the popular advice of many financial advisers who frequently call for portfolio allocations with decreasing proportions of equities over time.
Moreover, reversing the glide paths of LCFs may produce portfolios with greater probabilities of reaching target amounts than their corresponding LCFs. The reverse glide path, where one increases equity exposure over time, also slightly decreases the probability that one fails to make a target goal of amassing $1 million. As noted in Figure 4, an investor with a 30-year horizon can pursue a portfolio that gradually increases equity exposure. Such a strategy maintains a sufficient asset allocation in bonds, thereby assuring some level of non-correlated, diversified assets. The results reported above do not necessarily make the case that reverse glide paths are viable asset allocation strategies, but financial planners should be aware of the limitations of typical life-cycle funds. In other words, the glide paths of typical life-cycle funds offer no advantage in terms of risk reduction compared to either glide paths that increase the level of equities over time or simple fixed-asset allocation generic portfolios. Finally, our analyses confirm the work of Cooley, et al. (2003), as a modest amount of international equity asset allocation decreases failure probabilities to attain levels of wealth.
Our findings also underscore the importance of viewing VAR (see Lewis, et al. 2007 and Lewis and Okunev 2009) as a means to evaluate asset allocation portfolio strategies. Even as our work suggests reverse glide paths are comparable to traditional glide paths, portfolio risk traditionally has been measured in terms of volatility, and portfolio decisions are often based on the trade-off between mean returns and standard deviation of returns. Although volatility continues to be an important measure of risk, VAR methods provide complementary measures of risk that may be more easily understood by the lay investor. The lay investor may find it difficult to establish her personal preference for risk expressed as a rate of return/standard deviation combination. On the other hand, establishing a portfolio performance in terms of probability of reaching (or failing to reach) a target is understandable. Risk can be explained either in terms of probability of reaching a target or in terms of terminal values achieved for selected percentiles.
References
Bhargava, Vivek, Daniel K. Konku, and D. K. Malhotra. 2004. “Does International Diversification Pay?” Financial Counseling and Planning 15, 1: 53–62.
Booth, Laurence. 2004. “Formulating Retirement Targets and the Impact of Time Horizon on Asset Allocation.” Financial Services Review 13, 1: 1–17.
Canner, Niko, N. Gregory Mankiw, and Daniel N. Weil. 1997. “An Asset Allocation Puzzle.” American Economic Review 87, 1: 181–191.
Cooley, Philip L., Carl M. Hubbard, and Daniel T. Walz. 2003. “Does International Diversification Increase the Sustainability of Withdrawal Rates from Your Retirement Portfolio?” Journal of Financial Planning 16, 1: 74–80.
Dunleavey, M. P. 2010. “Some Target-Date Funds Adjusting After Criticism” (April 11). www.nytimes.com/2010/04/11/business/mutfund/11target.html?emc=eta1.
Gunthorpe, Deborah, and Haim Levy. 1994. “Portfolio Composition and the Investment Horizon.” Financial Analysts Journal 50, 1: 51–56.
Hanna, Michael, Joseph P. McCormack, and Grady Perdue. 1999. “A Nineties Perspective on International Diversification.” Financial Services Review 8, 1: 37–45.
Ibbotson & Associates. 2009. Ibbotson 2009 SBBI Classic Yearbook. Chicago: Morningstar Inc.
Israelsen, Craig L., and Katie Walker. 2006. “Right on Target.” Financial Planning (July 1).
Kim, Jane J. 2010. “Making Target-Date Funds Live Up to Their Mission.” Wall Street Journal (March 27).
Laise, Eleanor. 2006. “Fidelity’s Life-Cycle Allocations Get More Aggressive.” Wall Street Journal (March 2): D2.
Lewis, Nigel D. 2008. “Assessing Shortfall Risk in Life-Cycle Investment Funds.” Journal of Wealth Management 11, 1: 15–19.
Lewis, Nigel D., and John Okunev. 2009. “Using Value at Risk to Enhance Asset Allocation in Life-Cycle Investment Funds.” Journal of Investing 18, 1: 87–91.
Lewis, Nigel D., John Okunev, and Derek White. 2007. “Using a Value at Risk Approach to Enhance Tactical Asset Allocation.” Journal of Investing 16, 4: 100–107.
Markowitz, Harry M. 1959. Portfolio Selection: Efficient Diversification of Investments. New York: John Wiley & Sons.
Mincer, Julian. 2006. “As Life-Cycle Funds Gain Fans, Their Style Gets More Aggressive.” Wall Street Journal (December 26): D3.
Mun, Jonathan. 2006. Modeling Risk: Applying Monte Carlo Simulation, Real Options Analysis, Forecasting, and Optimization Techniques. Hoboken: John Wiley & Sons.
Opdyke, Jeff D. 2006. “Retirement Planning for 20-Somethings: Don’t Fall into The ‘Playing It Safe’ Trap.” Wall Street Journal (November 15): D1.
Schleef, Harold J., and Robert M. Eisinger. 2007. “Hitting or Missing the Retirement Target: Comparing Contribution and Asset Allocation Schemes of Simulated Portfolios.” Financial Services Review 16, 3: 229–243.
Schooley, Diane K., and Debra Drecnik Worden. 1999. “Investors’ Asset Allocations Versus Life-Cycle Funds.” Financial Analysts Journal 55, 5: 37–43.
Solnik, Bruno. 1995. “Why Not Diversify Internationally Rather Than Domestically?” Financial Analysts Journal (January/February): 89–94.
Vora, Premal P., and John D. McGinnis. 2000. “The Asset Allocation Decision in Retirement: Lessons from Dollar-Cost Averaging.” Financial Services Review 9, 1: 47–63.