Journal of Financial Planning: February 2015
Ozge Uygur, Ph.D., is an assistant professor of finance at Rohrer College of Business at Rowan University. Her field of expertise is empirical corporate finance, and her research focuses on corporate governance, executive compensation, mergers and acquisitions, and financial transparency.
Gulser Meric, Ph.D., professor of finance, is the first person to hold the prestigious John B. Campbell Professorial Chair in the Rohrer College of Business at Rowan University. She has presented research papers at numerous prestigious national and international conferences, and she was named professor of the year by students in 2000.
Ilhan Meric, Ph.D., is a professor of finance at Rider University. His research interests include global financial markets, global investing, index funds, closed-end country funds, and corporate finance.
Executive Summary
- The 1987 and 2008 stock market crashes were the two most significant market declines in U.S. history since the Great Depression. The S&P 500 lost 28.5 percent of its value, and the NASDAQ lost 24.6 percent of its value in the 1987 crash. The S&P 500 lost 23.7 percent of its value, and the NASDAQ lost 24.8 percent of its value in the 2008 crash.
- This study uses multivariate analysis of variance and logistic regression analysis statistical techniques to identify the financial characteristics of the firms that lost the most value in the 1987 and 2008 stock market crashes.
- Results show that beta is a reliable predictor of loss in stock market crashes and that firms with a high financial leverage tend to lose more value in major stock crashes.
- This study finds that investors who select stocks, stock portfolios, mutual funds, and ETFs with a high beta or stock in firms with a high financial leverage are likely to lose more than average value in a major stock market crash.
A stock market crash is a sharp decrease in stock prices within a short period of time. The 1987 and 2008 crashes were the two most important stock market collapses in the United States since the Great Depression. In the 1987 crash, the S&P 500 Index lost 28.5 percent, and the NASDAQ Composite Index lost 24.6 percent in value. In the 2008 crash, the S&P 500 lost 23.7 percent, and the NASDAQ lost 24.8 percent of its value.
The 2000 crash was also an important stock market event. However, because it was caused by the collapse of the dot-com bubble, it affected mainly NASDAQ stocks; the effect on the S&P 500 stocks was limited.
The 10 most important stock market crashes since 1929 are presented in Table 1. The statistics in Table 1 indicate that significant stock market declines have affected the NASDAQ more than the S&P 500 during the last two decades. The average stock price decrease since 1997 was 18.5 percent for the NASDAQ, compared to only 12.6 percent for the S&P 500.
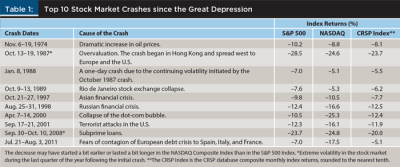
This study identifies the financial characteristics of the firms that lost the most value in the 1987 and 2008 stock market crashes. As the statistics in Table 1 indicate, major stock market corrections have occurred with high regularity since 1974. Therefore, knowing which firms are likely to lose more value in a major stock market correction is important for financial planners.
The capital asset pricing model (CAPM) predicts that high beta stocks should gain more value in up markets and lose more value in down markets. However, there is limited empirical evidence that the CAPM beta is a reliable predictor of loss in major stock market crashes. In this study, empirical evidence on this subject with data for the 1987 and 2008 stock market crashes is provided.
An important characteristic affecting firm values during stock market crashes is bankruptcy risk (Wang, Meric, Liu, and Meric 2009). The debt ratio is generally used as a proxy measure of bankruptcy risk in empirical studies (Baek, Kang, and Park 2004; Bonfim 2009; Mitton 2002). In this study, firms with higher debt ratios lost more value in the 1987 and 2008 crashes.
A credit crunch and a liquidity shortage were serious problems in 2008 (Mizen 2008). A liquidity shortage increases the technical insolvency risk of firms, and it may lead to bankruptcy (Wang, Meric, Liu, and Meric 2013). In this study, firms with lower liquidity ratios lost more value in the 2008 crash. A liquidity shortage was not a serious problem in the 1987 crash, and as such, the liquidity ratio was not a significant determinant of loss in the 1987 crash.
Hamada (1969) demonstrated that firms with a higher debt ratio tend to have more return volatility and higher betas. Although the CAPM beta captures this volatility risk, it does not capture a firm’s bankruptcy risk, which is a major concern for investors in stock market crashes (Wang et al. 2009). In this study, the debt ratio, when controlled with beta and as a proxy measure for bankruptcy risk, was a significant determinant of loss in the 1987 and 2008 stock market crashes.
Data and Methodology
In the CAPM, as shown in equation [1], beta measures a stock’s market risk. It is the key determinant of a stock’s returns.
In equation [1], Ri represents the returns expected on stock , Rf is the risk free rate, RM is the expected market rate of return, and βi is the market risk of stock i. Whether beta (βi) is a significant determinant of stock returns in stock market crashes has not been sufficiently studied. This study tests this hypothesis with data from the 1987 and 2008 stock market crashes.
The CAPM predicts that high beta stocks should gain more value in up markets and lose more value in down markets relative to low beta stocks. Using linear multivariate regression models, Wang et al. (2009; 2013) found beta to be a significant determinant of stock returns in several stock market crashes and post-crash market reversals. In this study, multivariate analysis of variance (MANOVA) and logistic regression analysis (LOGIT) statistical techniques were used to test the hypothesis that high beta stocks lost more value relative to low beta stocks in the 1987 and 2008 stock market crashes.
Stock returns for the 1987 and 2008 stock market crashes were computed with price index data obtained from the Center for Research in Security Prices (CRSP) database. Firm betas were computed by regressing monthly stock returns against the CRSP composite monthly index returns with data covering the five-year (60 months) period prior to the year of the crash.
In their three factor asset pricing model, Fama and French (1992, 1993) demonstrated that, in addition to beta, firm size and market-to-book ratio are also significant determinants of stock returns. Consider equation [2]:
where SIZEi is the firm’s market capitalization, and MKBKi is the market-to-book ratio. Whether SIZEi and MKBKi are significant determinants of stock returns in stock market crashes has not been widely studied.
This paper does not provide a formal test of the Fama-French three-factor model (for a formal test of the model, see Brigham and Ehrhardt 2014). Instead, the analysis uses a firm’s market capitalization (SIZE) and its market-to-book ratio (MKBK) as control variables, along with beta, to study the effects of several firm operating characteristics on stock returns during crashes (Wang et al. 2009; 2013).
Fama and French (1992, 1993) argued that investors consider small firms to be riskier than large firms. Firms with a low market-to-book ratio may be in financial distress. Because of this, they are riskier for investors than high market-to-book ratio firms. Therefore, investors require higher returns from investments in small company stocks and in the stocks of firms with a low market-to-book ratio. Miyajima and Yafeh (2007) and Jiang and Lee (2007) found firm size and market-to-book ratio to be among the most important determinants of firm stock performance. This paper tests the hypothesis that smaller firms and those with lower market-to-book ratios lost more value in the 1987 and 2008 stock market crashes.
Capital asset pricing models assume that the firm-specific idiosyncratic risk can be diversified away. However, Amihud (2002) and Xu and Malkiel (2003) demonstrated that the idiosyncratic risk related to firm-specific characteristics can be significant determinants of stock returns. The Hamada (1969) equation explains the effect of the debt ratio on beta. However, because of the bankruptcy risk concerns of investors, the debt ratio has an added importance in stock market crashes. Wang et al. (2009) demonstrated that stock returns cannot be explained by asset pricing models alone. Firm-specific characteristics such as liquidity, financial leverage, and profitability, are also significant determinants of stock returns in stock market crashes.
Empirical studies show that bankruptcy risk is a serious concern for investors during stock market crashes (Wang et al. 2013). Miyajima and Yafeh (2007) determined that financial leverage was an important determinant of stock returns in the 1995–2000 Japanese banking crisis. Mitton (2002), Baek et al. (2004), and Bonfim (2009) used the debt ratio as a determinant of stock returns in their empirical studies. In this study, the hypothesis that firms with higher debt ratios, and thus greater bankruptcy risk, lost more value in the 1987 and 2008 stock market crashes was tested.
Many empirical studies show that firms’ potential inability to meet their maturing obligations (technical insolvency risk) is also an important concern for investors (Wang et al. 2013). Technical insolvency, if persistent, usually results in bankruptcy. Firms with higher levels of liquid assets would be better able to meet their maturing obligations. Bonfim (2009) determined that the liquidity ratio has a negative impact on default probability. Bankruptcy prediction models generally include a liquidity ratio (Altman 1968). In this study, a test of the hypothesis that firms with a low liquidity ratio lost more value in the 1987 and 2008 stock market crashes is presented.
During normal periods, stock returns are mainly determined by market risk variables. In this paper, the hypothesis that firm-specific operating characteristics, such as the average collection period of accounts receivable and total assets turnover, can impact stock returns during major stock market declines was tested. During stock market crashes, a firm’s ability to collect accounts receivable may be adversely affected, increasing technical insolvency and bankruptcy risks. A high total assets turnover rate can affect the firm’s profitability favorably and may be associated with a lower bankruptcy risk. This possibility was tested in this paper.
Pástor and Veronesi (2003) noted that firm profitability is a key determinant of stock price. Bonfim (2009) found that firm profitability is closely related to bankruptcy risk. Mitton (2002), Baek et al. (2004), and Wang et al. (2009) used various measures of profitability as determinants of stock returns during economic and financial crisis periods. In this study, two measures of profitability were used: earning power ratio (operating income/total assets) and return on equity (net income/common equity). These two profitability measures have been widely used in previous studies as determinants of stock returns. The hypothesis that firms with high profitability ratios lost less value in 1987 and 2008 was tested.
The firm size, market-to-book ratio, liquidity ratio, debt ratio, average collection period, total assets turnover, earning power ratio, and return on equity data were obtained from the year-end financial statements of the firms in the Standard & Poor’s Compustat database for the year prior to the year of the crash. Firms with missing data were excluded from the sample. Following Gadarowski, Meric, Welsh, and Meric (2007) and Wang et al. (2009), the distributions of the variables were Winsorized at the 1 percent level to prevent outliers from influencing the results. The variables used in the study are presented in Table 2.
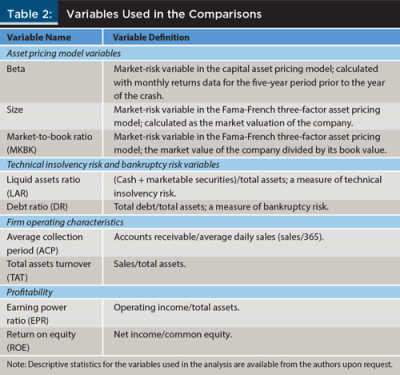
Following Fama and French (2001) and Gadarowski et al. (2007), utilities (SIC 4900-4999) and financial firms (SIC 6000-6999) were excluded from the study. Utilities were excluded because their financial decisions are affected by regulation. Financial firms were excluded because their financial ratios are not comparable to those of other firms. The final sample consisted of 2,736 firms for the 1987 crash and 2,866 firms for the 2008 crash.
For each stock market crash, the firms in the sample were divided into three equal groups based on incurred losses during the crash. MANOVA was used to compare the financial characteristics of the firms with the least losses in the top 1/3 group (hereafter called LessLoss firms) and those with the most losses in the bottom 1/3 group (hereafter called MoreLoss firms). The MANOVA technique has been used extensively in previous studies to compare the financial characteristics of different groups of firms (Hutchinson, Meric, and Meric 1988; Johnson and Wichern 2007; Meric, Leveen, and Meric 1991).
In MANOVA, individual variables are compared with univariate ANOVA tests and a possible interaction between the variables is not taken into consideration. To disentangle the significance of individual variables, a LOGIT analysis was used based on assuming values of “1” and “0” for the LessLoss and MoreLoss firms, respectively, as the dependent variable, and the firm characteristics compared serving as the independent variables.
MANOVA Results
The MANOVA results comparing the financial characteristics of the top 1/3 LessLoss group with the bottom 1/3 MoreLoss group for 1987 and 2008 are presented in Table 3 and Table 4, respectively. The multivariate test statistics for both crashes show that the overall financial characteristics of the LessLoss firms and the MoreLoss firms were significantly different at the p < .01 level. The multivariate F value statistics imply that there were greater differences between the LessLoss and MoreLoss firm groups in the 1987 crash than in the 2008 crash.
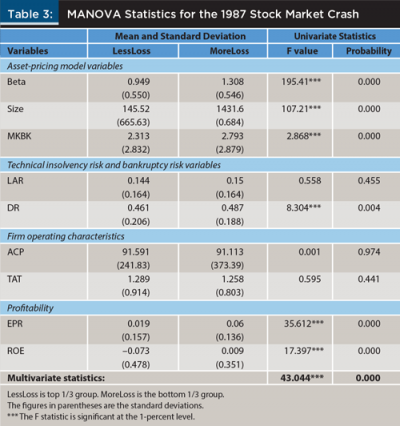
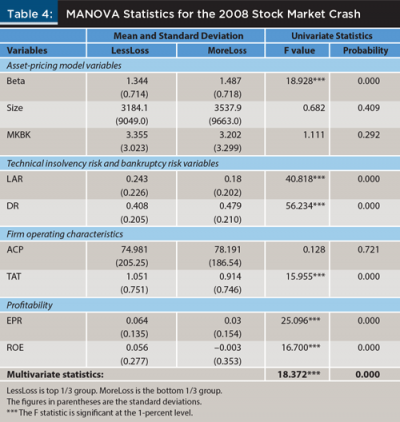
The univariate test statistics show that firms with higher betas lost more value, compared with low beta firms, both in the 1987 and in the 2008 crashes. These findings conform to CAPM predictions. The results indicate that large firms and those with a high market-to-book ratio also lost more value in the 1987 crash. However, these variables were not statistically significant for the 2008 crash.
A key characteristic of the 2008 stock market crash was a credit crunch and a liquidity shortage (Mizen 2008). The univariate test statistics for the 2008 crash confirm this characteristic. Firms with a high liquid assets ratio—firms with less technical insolvency risk—lost less value relative to those with a low liquid assets ratio in the 2008 crash. However, the liquid assets ratio was not significant for the 1987 crash because a liquidity shortage was not a problem in that crash.
The debt ratio is commonly used as a proxy measure for bankruptcy risk in empirical studies (Baek et al. 2004; Mitton 2002; Wang et al. 2013). The debt ratio was significant for both the 1987 and 2008 crashes (see Table 5 and Table 6). In both crashes, firms with a high debt ratio lost more value relative to those with a low debt ratio.
The univariate test statistics show that the average collection period and total assets turnover (as measures of operating characteristics of firms) were not significant determinants of loss in the 1987 crash. Similarly, the average collection period was not a significant determinant of loss in the 2008 crash. However, firms with a lower total assets turnover lost more value relative to those with a higher total assets turnover in the 2008 crash.
The findings indicate that more profitable firms, as measured by both earning power ratio (EPR) and return on equity (ROE), lost less value in the 2008 crash and more value in the 1987 crash relative to other firms. In empirical studies, profitability has been found to be closely related to bankruptcy risk (Bonfim 2009).
Because bankruptcy risk was a serious concern for investors in the 2008 crash (Wang et al. 2013), it is not surprising that more profitable firms lost less value in the 2008 crash. However, contrary to the results for the 2008 crash, findings indicate that more profitable firms lost more value in the 1987 crash. Unlike the 2008 crash, overvaluation has commonly been mentioned in the mainstream press and as one of the main reasons for the 1987 crash. This implies, statistically, that these firms were overvalued before the crash.
LOGIT Results
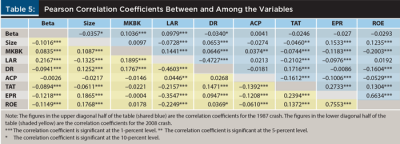
As previously mentioned, with MANOVA, each variable is compared between groups with an ANOVA test that does not consider the variable’s interaction with other variables. LOGIT was used next to disentangle the significance of individual variables. The correlation matrices between the variables in the 1987 and 2008 stock market crashes are presented in Table 5. The correlations coefficients in Table 5 indicate that the liquid asset ratio (LAR) and debt ratio (DR) and the profitability variables (EPR and ROE) were highly correlated. Therefore, to avoid analytical multicollinearity issues, these highly correlated variables were used in two different regression models. Because LAR was less correlated with ROE than with EPR, LAR and ROE were incorporated in regression model 1. Because DR was less correlated with EPR than with ROE, DR and EPR were used in regression model 2.
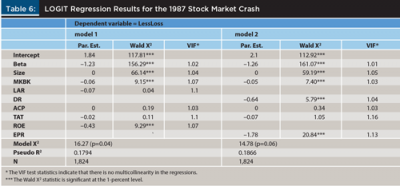
The LOGIT regression results are presented in Table 6 and Table 7 for the 1987 and 2008 stock market crashes, respectively. The LessLoss firm group was coded 1, whereas the MoreLoss firm group was coded 0. The firm financial characteristics were included as the independent variables.
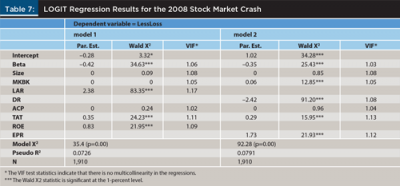
Beta was significant at the p < .01 level with a negative sign in both models. This indicates that stocks with a higher beta had a greater loss in both stock market crashes relative to lower beta stocks. This result is in line with the finding using the MANOVA method. It also confirms the CAPM’s prediction that stocks with higher betas tend to have greater loses relative to lower beta stocks in down markets.
The debt ratio (DR) was significant, with a negative sign in model 2 in both 1987 and 2008 regressions. The LOGIT finding with the debt ratio was also in line with the MANOVA results. Firms with a high debt ratio lost more value relative to low debt ratio firms in both crashes. This implies that investors tend to bid down the prices of firms with a high debt ratio sharply in major stock market crashes because of their concern over bankruptcy risk.
Because a bank credit crunch and a liquidity shortage were well-known characteristics associated with the 2008 stock market crash (Mizen 2008), as in the MANOVA tests, the liquid assets ratio (LAR) was highly significant at the p < .01 level with a negative sign in model 1 in the LOGIT test for the 2008 crash (see Table 7). This indicates that firms with lower liquid asset levels lost more value relative to those with higher liquid asset levels in the 2008 stock market crash. However, in line with the MANOVA test results, the LAR variable was not statistically significant for the 1987 stock market crash (see Table 6), because a credit crunch or a liquidity shortage was not a major concern for investors in the 1987 crash.
As with the MANOVA test, the LOGIT test results indicate that larger firms lost more value relative to smaller firms in the 1987 stock market crash (see model 1 and model 2 in Table 6). However, firm size was not a significant determinant of loss in the 2008 stock market crash (see models 1 and model 2 in Table 7).
Wang et al. (2009) found conflicting results with the market-to-book (MKBK) ratio variable in different stock market crashes. Conflicting results with the MKBK variable was also found for the 1987 and 2008 stock market crashes. Fama and French (1992, 1993) considered the MKBK ratio as a market risk variable. They argued that firms with a low MKBK ratio may be in financial distress. The coefficient of the MKBK variable was significant with a positive sign in model 2 of the LOGIT regressions for 2008. This implies that firms with a low MKBK ratio lost more value relative to high MKBK ratio firms in the 2008 crash because investors considered low MKBK ratio firms to be riskier investments with a greater bankruptcy risk. In tests with the LAR and DR variables, it also was determined that bankruptcy risk was a serious concern for investors in the 2008 stock market crash. However, the coefficient of the MKBK variable was significant with a negative sign in both LOGIT models for the 1987 stock market crash. This indicates that firms with a high MKBK ratio lost more value relative to low MKBK ratio firms in the 1987 crash. Overvaluation was one of the causes for the 1987 crash. Results from this study support this assertion. High MKBK ratio firms were overvalued before the crash.
As in the MANOVA tests, firms with a higher total assets turnover (TAT) ratio and more efficient total assets management lost less value in the 2008 stock market crash relative to other firms. However, the TAT variable was not a significant determinant of loss in the 1987 stock market crash. The average collection period (ACP) variable was not a significant determinant of loss in either stock market crash.
Finally, as in the MANOVA tests, the regression coefficients of both profitability variables EPR and ROE were highly significant at the p < .01 level with a negative sign in the 1987 regressions and with a positive sign in the 2008 regressions. Empirical studies have demonstrated that firm profitability is closely related to bankruptcy risk (Bonfim 2009). Bankruptcy risk was a serious concern for investors in the 2008 crash (Wang et al. 2013), therefore, more profitable firms with less bankruptcy risk lost less value in this crash. Unlike the 2008 situation, market overvaluation was one of the main causes of the 1987 crash. More profitable firms lost more value in the 1987 crash, which implies that these firms were overvalued before the crash.
Summary and Conclusions
Stock market crashes occur with regularity. Knowing which firms lose more value in stock market crashes is important for financial planners. The 1987 and 2008 crashes were the two most important stock market failures in U.S. history since the Great Depression.
This paper provides an overview of the financial characteristics of the firms that lost the most value in the 1987 and 2008 stock market crashes. The firms in the sample were divided into three groups based on their losses during the 1987 and 2008 stock market crashes. The financial characteristics of the firms in the top 1/3 group (LessLoss firms) were compared with the financial characteristics of the firms in the bottom 1/3 group (MoreLoss firms). The multivariate test statistics indicated that the financial characteristics of the LessLoss and MoreLoss firms were significantly different in both stock market crashes.
This study provides new empirical evidence showing that stocks with high betas lost more value relative to low beta stocks in both crashes. Results also suggest that firms with high debt ratios lost more value relative to low debt ratio firms in the 1987 and 2008 stock market crashes.
Financial planners can use results from this study when working with clients. Planners should advise their clients that if they invest in high beta stocks or in firms with high debt ratios, they are likely to have greater than average losses if a major stock market crash occurs in the future. Clients with a high risk tolerance who seek high long-term returns could invest in high beta stocks and in high debt ratio firms with a long time horizon to compensate for any short-term losses due to stock market crashes. However, investors with a low risk tolerance and a short investment horizon should avoid investing in high beta stocks and in high debt ratio firms to avoid large short-term losses due to stock market crashes.
References
Altman, Edward I. 1968. “Financial Ratios, Discriminant Analysis, and the Prediction of Corporate Bankruptcy.” Journal of Finance 23 (4): 589–609.
Amihud, Yakov 2002. “Illiquidity and Stock Returns: Cross-Section and Time-Series Effect.” Journal of Financial Markets 5 (1): 31–56.
Baek, Jae-Seung, Jun-Koo Kang, and Kyung S. Park. 2004. “Corporate Governance and Firm Value: Evidence from the Korean Financial Crisis.” Journal of Financial Economics 71 (2): 265–313.
Bonfim, Diana 2009. “Credit Risk Drivers: Evaluating the Contribution of Firm Level Information and of Macroeconomics Dynamics.” Journal of Banking and Finance 33 (2): 281–299.
Brigham, Eugene F., and Michael C. Ehrhardt. 2014. Financial Management: Theory and Practice (14th ed.). Mason, OH: South-Western.
Fama, Eugene F., and Kenneth R. French. 1992. “The Cross-Section of Expected Stock Returns.” Journal of Finance 47 (2): 427–466.
Fama, Eugene F., and Kenneth R. French. 1993. “Common Risk Factors in the Returns on Bonds and Stocks.” Journal of Financial Economics 33 (1): 3–56.
Fama, Eugene F., and Kenneth R. French. 2001. “Disappearing Dividends: Changing Firm Characteristics or Lower Propensity to Pay.” Journal of Financial Economics 60 (1): 3–43.
Gadarowski, Christopher, Gulser Meric, Carol Welsh, and Ilhan Meric. 2007. “Dividend Tax Cut and Security Prices: Examining the Effect of the Jobs and Growth Tax Relief Reconciliation Act of 2003.” Financial Management 36 (4): 89–106.
Hamada, Robert S. 1969. “Portfolio Analysis, Market Equilibrium, and Corporate Finance.” Journal of Finance 24 (1): 13–31.
Hutchinson, P., Ilhan Meric, and Gulser Meric. 1988. “The Financial Characteristics of Small Firms which Achieve Quotation on the UK Unlisted Securities Market.” Journal of Business Finance and Accounting 15 (1): 9–20.
Jiang, Xiaoquan, and Bong-Soo Lee 2007. “Stock Returns, Dividend Yield, and Book-to-Market Ratio.” Journal of Banking and Finance 31 (2): 455–475.
Johnson, Richard, and Dean W. Wichern. 2007. Applied Multivariate Statistical Analysis (6th ed.). Englewood Cliffs, NJ: Prentice Hall.
Meric, Gulser, Serpil Leveen, and Ilhan Meric. 1991. “The Financial Characteristics of Commercial Banks Involved in Interstate Acquisitions.” Financial Review 26 (1): 75–90.
Mitton, Todd 2002. “A Cross-Firm Analysis of the Impact of Corporate Governance on the East Asian Financial Crisis.” Journal of Financial Economics 64 (2): 215–241.
Miyajima, Hideaki, and Yishay Yafeh. 2007. “Japan’s Banking Crisis: An Event Study Perspective.” Journal of Banking and Finance 31 (9): 2866–2885.
Mizen, Paul. 2008. “The Credit Crunch of 2007–2008: A Discussion of the Background, Market Reactions, and Policy Responses.” Federal Reserve Bank of St. Louis Review (September/October): 531–567.
Pástor, L’uboš, and Pietro Veronesi. 2003. “Stock Valuation and Learning about Profitability.” Journal of Finance 58 (5): 1749–1789.
Wang, Jia, Gulser Meric, Zugang Liu, and Ilhan Meric. 2009. “Stock Market Crashes, Firm Characteristics, and Stock Returns.” Journal of Banking and Finance 33 (9): 1563–1574.
Wang, Jia, Gulser Meric, Zugang Liu, and Ilhan Meric. 2013. “Investor Overreaction to Technical Insolvency and Bankruptcy Risks in the 2008 Stock Market Crash.” Journal of Investing 22 (2): 8–14.
Xu, Yexiao, and Burton G. Malkiel. 2003. “Investigating the Behavior of Idiosyncratic Volatility.” Journal of Business 76 (4): 613–644.
Citation
Uygur, Ozge, Gulser Meric, and Ilhan Meric. 2015. “Which Firms Lose More Value in Stock Market Crashes?” Journal of Financial Planning 28 (2): 44–51.