Journal of Financial Planning: December 2017
Executive Summary
- This study sought to test the value of U.S. government debt relative to U.S. corporate debt in a portfolio alongside stocks with the goal to better enable financial planners to produce the optimum portfolio allocation for their clients.
- After assumed state and local taxes of 2 percent to 4 percent, a portfolio of 50 percent U.S. government bonds and 50 percent U.S. stocks outperformed a portfolio of 50 percent corporate bonds and 50 percent U.S. stocks, on a risk-adjusted basis.
- On average, relatively greater market drawdowns (28 percent mean, 17 percent median) showed outperformance of a portfolio holding stocks and U.S. government bonds over a portfolio holding stocks and corporate bonds.
- Planners working with a client’s taxable portfolio seeking protection from market drawdowns may wish to consider U.S. government-issued debt over corporate debt.
Jon Luskin, CFP®, is a financial planner with Define Financial. For his master’s thesis on investment management, Luskin showed how university endowments can generate more wealth and take on less risk by adopting low-cost investment strategies.
Acknowledgement: The author thanks Meghaan Lurtz, Steven Rocha, Taylor Schulte, CFP®, and Ryan Char for their help with this manuscript.
Stocks, compared to bonds, have historically contributed more volatility and return to portfolios. Adding bonds to a portfolio has been shown to decrease portfolio volatility (Philips, Walker, and Kinniry Jr. 2012).
The bond asset class can be broken down into a variety of sub-asset classes, including: (1) U.S. government; (2) corporate; and (3) international debt, among others. Each bond asset class has its own unique risk and return characteristics. Furthermore, each bond asset class has a distinct correlation to equities. Although there are many bond asset classes, the focus of this study was on the two oldest bond asset classes: U.S. government bonds and domestic corporate bonds. This choice was guided by the availability of robust index data since 1926.
U.S. government-backed debt has been noted as the superior portfolio diversifier (Swensen 2005; Swedroe 2016; Philips, Walker, and Kinniry Jr. 2012; Connolly, Stivers, and Sun 2005). Thus, this study sought to test and quantify the value of U.S. government debt relative to U.S corporate debt in a portfolio alongside stocks with the goal to better enable financial planners to produce the optimum portfolio allocation for their clients.
Literature Review
Elton, Gruber, Agrawal, and Mann (1999) noted that a large portion of the corporate bond premium existed to compensate investors for the additional expenses of state and local income taxes. That is, corporate bonds offer a “tax premium” over government-backed ones, because the latter are not taxed at the state or local level. They calculated that this corporate bond tax premium compensated corporate bond investors given an effective state tax rate of 4 percent.
In a successive paper, Elton, Gruber, Agrawal, and Mann (2001) suggested that corporate bonds offered a systematic, i.e. non-diversifiable, risk premium over U.S. government debt instruments. Corporate bonds offered a higher investment return, because corporate issues were inherently riskier than U.S. government debt. This risk premium existed even for highly rated AA bonds.
Fama and French (1993) noted that U.S. government and corporate bonds may provide similar long-term expected returns. They noted that there was “little evidence corporate bonds have higher average returns than U.S. government bonds” (p. 13).
Swedroe (2014) created hypothetical portfolios, pairing domestic stocks with either U.S. government, corporate, or high-yield bonds. In his analysis, the portfolio holding U.S. government bonds showed lower figures of standard deviation, nominally higher risk-adjusted—by Sharpe ratio—figures, and varying degrees of nominal investment return.
Miller (2016) examined “crisis alpha,” which he defined as the excess return offered over cash for those months when equity markets witnessed a decline greater than 5 percent. He noted that although U.S. government bonds did indeed offer crisis alpha, it was marginal, at 0.12 percent on average.
The Federal Reserve Bank of Atlanta noted that the returns of stock and Treasury securities exhibited little or even negative correlation during periods of high stock market volatility (Stivers and Sun 2002). In both this and a successive paper, Connolly, Stivers, and Sun (2005) made the case that the negative correlation of U.S. government bonds during market drawdowns made U.S. government bonds an effective portfolio diversifier.
Ilmanen (2003) showed low correlation between U.S. equity and U.S. government bonds during times of economic uncertainty. And Li (2002) noted a low correlation between U.S. government debt and equities. The same was reported by Philips, Walker, and Kinniry Jr. (2012), who found “… only U.S. Treasury bonds have proven to be a true diversifier, correlating at –0.3 to U.S. equities” (p. 1). They showed that a broadly diversified bond portfolio, which includes holding corporate debt, underperformed a portfolio with greater weight given to Treasuries during the 2008 Great Recession.
Swedroe (2014) and Philips, Walker, and Kinniry Jr. (2012) sufficiently measured the value of U.S. government and corporate bonds alongside equities. However, the period considered by Swedroe, 89 years, is inapplicable for all but institutional investors. Philips, Walker, and Kinniry Jr. (2012) limited their analysis to the recent Great Recession. This may be problematic, because the impact of outliers can greatly affect results. Metrics such as median performance and market drawdown performance should be examined to measure the value of the distinct bond asset classes more thoroughly.
Conceptual Framework
Corporate bond liquidity premium. Because of their relatively reduced liquidity and smaller trading volume, corporate debt issues have a liquidity premium. It costs more money to trade corporate bonds than it does to trade U.S. government bonds (Damodaran 2005; Elton et al. 1999).
Credit/default premium. Corporate bonds offer a credit or default premium over U.S. Treasuries (Elton et al. 1999). Because corporate bonds are inherently riskier, they offer a higher coupon than U.S. government bonds. This increased credit risk is manifested in a higher standard deviation of investment returns for corporate bonds relative to Treasuries.
Taxes. For those states and municipalities that impose income taxes, corporate bond income is taxable at both the state and local levels. In contrast, income from Treasuries is exempt from such taxation.
Correlation. Historically, bonds have demonstrated low correlation to stocks. For this reason, creating a portfolio of both stocks and bonds is often ideal, assuming the goal of higher risk-adjusted returns. Although corporate bonds have shown low correlation to domestic equities, U.S. government bonds have shown even lower correlation to stocks (see Table 1, Panel A).

The low correlation of U.S. government bonds to domestic equities is pronounced because of the “flight-to-quality” phenomenon, i.e. market participants purchase Treasuries when domestic equity prices are in decline (Stivers and Sun 2002; Connolly, Stivers, and Sun 2005; Ilmanen 2003). This causes the price of Treasuries to increase.
Philips, Walker, and Kinniry Jr. (2012) noted that correlations are dynamic; they are subject to change. This is especially pronounced during market drawdowns. Hence, filtering bond performance for those months during which stocks (CRSP 1-10)1 witnessed drawdowns demonstrated this tendency (see Table 1, Panel B). Additionally, the correlation of U.S. government bonds was lower for months during which U.S. stocks suffered drawdowns. Moreover, the correlation of corporate bonds to U.S. stocks increased, nearly doubling, during months of domestic stock drawdowns. Put differently, the value of corporate bonds was far more likely to decrease than that of U.S. government bonds when domestic stocks decreased in value. This may make corporate bonds a poorer diversifier relative to U.S. government bonds.
Methodology
Index data. The U.S. stock market was represented by the CRSP 1-10 index.
Corporate bonds were represented by Morningstar’s Long-Term Corporate Bond Index. The corporate bond index data used in this study was composed of domestic corporate bonds with maturities of seven years or longer. The bonds were rated either a AAA or AA. The data assumed reinvestment of all income and did not account for taxes or transaction costs. This index was chosen because of the robustness of its data, which goes back to 1926. Although there are numerous other bond asset classes to consider (investment grade, municipal, high-yield, etc.), the index data available for those other asset classes does not reach as far back.
The standard deviation of all the portfolios that held corporate bonds was computed before the additional costs of taxes and the liquidity premium, which will be discussed later. That is, it is the standard deviation that an investor could expect on their investment account statements—and not on their tax returns.
Treasury bonds were represented by Morningstar’s U.S. Long-Term Government Bond Index. This index holds Treasury and U.S. government agency bonds with maturities of seven years or longer. At times, the index holds 3.45 percent U.S. government agency debt. Ideally, a pure long-term Treasury index would be used; however, such data going back to 1926 was not available.
Corporate bond liquidity premium. As discussed earlier, it costs more money to trade corporate bonds than U.S. government bonds. To calculate this corporate bond liquidity premium, the average expense ratio of investment grade corporate bond funds and U.S. government bond funds was sourced from ETF.com. This selection process screened bond funds for an AUM minimum of at least $100 million and excluded any irregular strategies such as inverse bond funds and levered funds.
This process found an average corporate bond liquidity premium of 0.06 percent or six basis points—that is, the average expense ratio for corporate bond funds was six BPS greater than the average of U.S. government bond funds. Elton et al. (1999) assumed an average corporate bond spread of 10 BPS greater than U.S. government-issued debt. Swedroe (2014) argued that the existence of credit risk in corporate bonds requires diversification. (Such credit risk does not exist for Treasury bonds.) The least-expensive corporate bond fund has an expense ratio of seven BPS. For this paper, the smallest figure, six BPS, was used.
To facilitate a realistic comparison between U.S. government and corporate bond returns, a new index was created to account for the corporate bond liquidity premium of six BPS. Thus, the corporate bond index data from Morningstar was modified to account for a six BPS annual drag on investment returns. This drag was applied to both principal and growth by applying the following formula:
rne = [(1 + ra) * (1 – e)] – 1
where rne is the corporate bond index investment return net of the corporate bond liquidity premium; ra equals the annual return of the corporate bond index; and e equals the corporate bond liquidity premium of 0.06 percent.
State and local taxation. Tax drag decreases the after-tax investment return available to investors in states and localities that tax corporate bond income. To replicate the tax drag on corporate bond investment returns in this study, taxes were applied to corporate bond returns. The net-of-tax and corporate bond liquidity premium index was calculated via:
rte = rne * (1–t)
where rte is the corporate bond return after taxes and expenses; rne equals the return net of corporate bond liquidity premium; and t is the effective, combined state and local tax bracket (tax brackets considered ranged from 1 percent to 10 percent).
Portfolio construction. Multiple portfolios holding U.S. government bonds were constructed with varying degrees of equity and bond exposure. The portfolio titles and composition of portfolios used for this study included:
X stock/Y gov.: X percent composition of CRSP 1-10 and Y percent long-term U.S. government bonds. U.S. government bond allocation ranged from 50 percent to 47 percent.
50 stock/50 corp., gross fees and taxes: 50 percent CRSP 1-10 and 50 percent long-term corporate bonds. Performance is gross of expenses and taxes.
50 stock/50 corp., net premium: 50 percent CRSP 1-10 and 50 percent long-term corporate bonds with a 0.06 percent drag on both corporate bond principal and growth. This will simulate an investor’s return after accounting for the additional expenses of trading corporate bonds relative to government bonds, because the corporate bond index returns do not account for the additional trading cost.
50 stock/50 corp., Z percent tax: 50 percent CRSP 1-10 and 50 percent long-term corporate bonds with a 0.06 percent drag on corporate bond principal and growth, and a Z percent tax on the corporate bond investment return. This is the above 50 stock/50 corp., net premium portfolio after accounting for state and local taxes on corporate bond income.
The portfolios were rebalanced annually. There were no considerations for federal taxes or trading expenses in allocating or rebalancing the accounts. There was no consideration for capital loss carryovers in this study.
Challenges simulating taxes given limited data. In real life, capital appreciation or depreciation of bond principal might only be realized given a complete liquidation of securities. In this simulation, such appreciation was taxed annually, resulting in corporate bond performance realizing a tax penalty in decreasing interest rate environments from 1924 to 1946, and from 1981 to 2008. In rising rate environments, the opposite was the case, considering the period from 1946 to 1981. In this increasing interest rate environment, the simulation benefited corporate bonds. This is because the principal loss was written off annually against the year’s coupon. Year by year, this tax calculation is not accurate. However, over longer periods of time, the benefit in a rising rate environment may cancel out the penalty in a decreasing rate environment in this simulation.
As previously mentioned, Morningstar’s U.S. Long-Term Government Bond Index can hold up to 3.45 percent U.S. government agency debt. Although Treasury issues are exempt from state and local taxation, certain U.S. government agency debt is not exempt. However, the impact of taxation on the U.S. government bond index may be negligible, given the relatively small contribution of U.S. government agency debt to the U.S. government bond index. Given the small allocation of agency debt, state and local government taxes were not incorporated in the index when computing the returns on government bonds.
Findings
Crisis alpha. Once the bond performance was filtered for those months in which U.S. equity markets suffered a drawdown, a pattern was revealed (see Figure 1). U.S. government bonds averaged superior crisis alpha over corporate bonds. Median performance similarly showed U.S. government bonds as the superior diversifier. Recall that “crisis alpha” is the excess return offered over cash for those months in which equity markets witness a decline of 5 percent or more. The results were concurrent with those shown by Miller (2016). In short, it is the previously mentioned credit risk that manifests Treasury bond outperformance. During market drawdowns, investors may shun credit risk, opting instead for the protection offered by holding Treasuries.

91-year performance. Consider the 52 stock/48 gov. portfolio, composed of 52 percent U.S. stocks and 48 percent U.S. government bonds. Compare its performance to the 50 stock/50 corp., gross fees and taxes portfolio. Portfolios with distinct stock/bond allocations were compared, because a portfolio holding 52 percent U.S. stocks and 48 percent U.S. government bonds produced a similar standard deviation of investment returns compared to a 50/50 mix of U.S. stocks and corporate bonds. Gross of fees and taxes, the portfolio with corporate bonds (50 stock/50 corp., gross fees and taxes) marginally outperformed the portfolio using 52 percent stocks and 48 percent U.S. government bonds (52 stock/48 gov.), generating a superior investment return by six BPS. To match the investment return of a portfolio holding corporate bonds, a portfolio holding U.S. government bonds must have endured higher volatility by allocating a greater weight to equities (see Table 2).

When considering the corporate bond liquidity premium of six BPS and a state income tax of 1 percent, the difference in performance between the two types of portfolios disappeared. The performance of the 50 stock/50 corp., 1 percent tax portfolio fell neatly in line with the efficient frontier created by the portfolios holding decreasing weightings of U.S. government bonds. The performance of 52 stock/48 gov. portfolio and the 50 stock/50 corp., 1 percent tax were almost identical.
In the 50 stock/50 corp., 4 percent tax portfolio, the application of a 4 percent tax on the investment return on corporate bonds manifests the inferior risk and return characteristics of corporate bonds. An additional 11 BPS of performance was available when using a portfolio holding 48 percent of U.S. government bonds (52 stock/48 gov.). Also, as previously mentioned, the standard deviation for both portfolios was almost identical.
Rolling 10-year periods. Ten-year rolling calendar year returns presented similar results as the 91-year analysis (see Table 3). Gross of fees or taxes, the portfolio holding corporate bonds (50 stock/50 corp., gross fees and taxes) outperformed the 50 stock/50 gov. portfolio. As with the previous analysis, this excess return manifested at the expense of greater volatility.
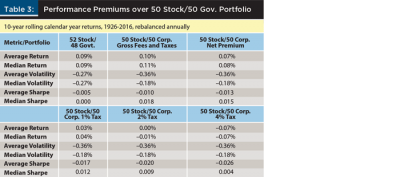
Increasing equity allocation by 2 percent, as in the 52 stock/48 gov. portfolio, resulted in a marginal degree of outperformance for the portfolio holding corporate bonds. This outperformance was erased given the inclusion of the six BPS liquidity premium (50 stock/50 corp., net premium).
A 2 percent combined effective state and local tax on a portfolio holding corporate bonds erased any outperformance over a portfolio holding 50 percent U.S. government bonds. However, median and average standard deviation was higher for the portfolios holding corporate bonds. Simply said, the application of a 2 percent effective combined state and local tax provided nearly identical returns but greater risk for the portfolio holding corporate bonds.
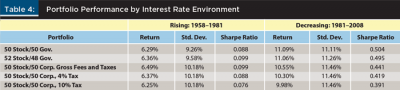
Rising versus decreasing interest rate environments. Given the role interest rates play in bond returns, a successive analysis examined performance in distinct interest rate environments. Given the limited availability of data, this analysis was restricted to one period of increasing interest rates, from 1958 through 1981, and one period of decreasing interest rates, from 1981 through 2008.
The rising rate environment showed outperformance by the portfolio holding corporate bonds. Unlike the previous analysis, it was not until the application of a 4 percent effective combined state and local tax that the portfolio holding government bonds was shown to generate a superior risk-adjusted return. For the decreasing interest rate period, the portfolio holding U.S. government bonds outperformed all portfolios with corporate bonds, even before fees or taxes were considered (see Table 4).
Drawdown performance. This analysis examined those periods that witnessed drawdowns of CRSP 1-10 greater than 10 percent (i.e., a market correction) over the course of one month or more.
Note that drawdowns greater than 10 percent have often occurred over the course of just a few days. However, mean reversion, to the extent that the return for the entire month was only a single-digit loss at the close of the month, led to the omission of said data points. The decision to use monthly returns was based on the lack of availability of daily investment return data.
The 50 stock/50 gov. portfolio frequently outperformed the 50 stock/50 corp., gross fees and taxes portfolio. The differences in performance were often smaller than 100 BPS. It could be argued that a difference of less than 1 percent is negligible, as 1 percent amounts to only $10,000 on a million-dollar account.
During relatively greater market drawdowns (approximately 18 percent decline in CRSP 1-10 or more over one month or more), the portfolio holding more equity plus U.S. government bonds did a better job of mitigating total portfolio downward deviation. Often, the inclusion of U.S. government debt aided total performance during relatively greater drawdowns.
When analyzing the data in this regard, an anomaly emerged: corporate bonds significantly outperformed in the market drawdowns following June 1932. There was some correlation (–0.29) between the severity of a given market drawdown and the degree to which the portfolio holding U.S. government bonds (50 stock/50 gov.) outperformed a portfolio holding corporate bonds (50 stock/50 corp., gross fees and taxes). The correlation was much less significant (–0.10) for the 52 stock/48 gov. portfolio (see Figure 2).

In summary, when there was a significant difference in the performance of the two types of portfolios, the portfolios holding U.S. government bonds more frequently outperformed the others. The application of the liquidity premium and taxes had little impact on drawdown performance, because the impact of the liquidity premium was marginal, and taxes on corporate bond income is usually not applicable during severe market drawdowns.
Conclusions
A portfolio of 50 percent corporate bonds and 50 percent U.S. stocks provides negligibly similar risk and investment return performance to a portfolio of 52 percent U.S. stocks and 48 percent U.S. government bonds—given a 1 percent effective combined state and local income tax. After assumed state and local taxes of between 2 percent to 4 percent, a 50 percent U.S government bonds and 50 percent U.S. stocks portfolio outperformed a portfolio of 50 percent corporate bonds and 50 percent U.S. stocks on a risk-adjusted basis.
Roughly two-thirds of the time, drawdown performance resulted in a negligible difference between the two portfolios. Roughly one-third of the time, a difference in excess of 1 percent between the performances of the two portfolios was shown. When that significant difference did exist, the portfolios holding U.S. government bonds more frequently outperformed the portfolio holding corporate debt. It should be noted that, when there were marked differences in the performance of the two portfolios, stocks underwent more significant drawdowns.
The takeaway of this analysis is that when the equity market undergoes relatively greater volatility, a portfolio holding U.S. government bonds is more likely to outperform a portfolio holding corporate bonds. Based on this finding, one could conclude that the value in U.S. government bonds lies in protecting a portfolio from more severe market corrections.
Replicating the results of other studies. Elton et al. (1999) noted that a large portion of the corporate bond premium existed to compensate investors for the additional expenses of state and local taxes—at an effective state tax rate of 4 percent, which is the “tax-premium” previously mentioned in this study. Examining the risk and return performance of a portfolio holding both corporate bonds and U.S. stock in this study, one could conclude that the corporate bond tax premium does indeed exist between a 1 percent and 4 percent effective combined state and local tax.
Fama and French (1993) noted that, “There is little evidence corporate bonds have higher average returns than U.S. government bonds” (p. 13). This paper made a similar observation in the context of total portfolio performance. Gross of taxes (or a significant corporate bond liquidity premium), the difference in pre-tax performance of the 52 stock/48 gov. portfolio and the corporate bond portfolios was negligible.
Using a 60/40 portfolio, Swedroe (2014) noted 10 BPS of outperformance for the portfolio holding corporate bonds. This was at the expense of an additional 30 BPS of standard deviation. This study examined different allocations but reached a similar conclusion: between 10 to 14 BPS higher pre-tax return at the expense of increased standard deviation, and between 18 and 36 BPS for the portfolio holding corporate bonds.
Elton et al. (2001) observed that corporate debt offered a higher investment return because corporate issues were inherently riskier. This study found that the same applied when those bonds were paired with stocks: corporate bonds offered a risk premium over U.S. government debt, at least pre-tax.
As with the results of Philips, Walker, and Kinniry Jr. (2012), a portfolio holding U.S. government bonds outperformed one holding corporate debt in excess of 8 percent during the most recent financial crisis. Dynamic correlations (discussed in greater detail in the following section) showed up in both this study and Philips, Walker, and Kinniry Jr. (2012).
Theoretical insights. It has been observed that an allocation to corporate bonds over U.S. government bonds is comparable to a 2 percent greater weighting to equities. However, this comes at the expense of frequent poorer corporate debt performance during stock market drawdowns. This supports the observation that corporate bonds are part stocks and part U.S. government bonds (Swedroe 2016).
The historical data selected had a huge impact on the conclusion, specifically considering the drawdown performance analysis. Had the period analyzed only stretched back to the 1970s, the research would have shown U.S. government bonds were the superior portfolio diversifier during market drawdowns. However, the longer period analyzed provided more opportunities for corporate bonds to outperform U.S. government debt. This was most manifest during the equity market drawdowns that followed the initial market crash that spawned the Great Depression. Why was this the case? Because there is not enough available data, it was not possible to determine if this was a function of the credit premium of corporate debt issues at the time. Consider that the change in price appreciation—due to a flight-to-safety—may have raised the value of U.S. government bonds. However, the relatively larger coupon offered by corporate bonds could have generated a greater total return than U.S. government debt.
As previously mentioned, the lack of available data makes testing this hypothesis impossible. While the coupon rate data for both corporate and U.S. government bonds during that time was available, the coupon rate data for the respective bond asset classes of similar maturities was not.
Another possible explanation for the outperformance of the portfolio holding corporate bonds is the inclusion of U.S. government agency debt in the U.S. government bond index. As with the recent Great Recession, the Great Depression accompanied a severe decline in housing values and high mortgage default rates. As such, any index containing mortgage-backed securities would have likely suffered from poor performance during that time.
To better demonstrate this, consider the period from June 1933 to October 1933. A 50/50 portfolio holding corporate bonds outperformed a 50/50 portfolio holding government bonds by 1.42 percent. (Both portfolios witnessed negative returns for the period in question, as equity markets suffered a 16.90 percent loss.) Had the 3.45 percent allocation of agency debt in the government index gone to 0 percent, a 50/50 portfolio holding government bonds would have lost 1.725 percent. Lastly, the outperformance of portfolios holding corporate bonds during these periods could be a function of both the higher coupon and the performance of agency debt.
To better illustrate the inferior drawdown correlation of the U.S. government bond index used in this study relative to a pure long-term Treasury index, consider that during the months that CRSP 1-10 showed a negative return greater than 5 percent (1976 to 2016), the correlation to Morningstar’s Long-Term U.S. Government Bonds Index was –0.05, and the correlation to Bloomberg Barclays U.S. Treasury Bond Index Long was –0.09. (For this study, the Bloomberg Barclays U.S. Treasury Bond Index Long was not used because of its relatively shorter history: 1976 for the Bloomberg benchmark versus 1926 for the Morningstar benchmark.)
Contribution to the Literature
This study quantified the historical performance of a portfolio holding U.S. government bonds in terms of investment return, standard deviation of return, risk-adjusted return, and portfolio resiliency during market drawdowns. This paper also explored the impact of the corporate bond liquidity premium. Given a premium of just six BPS, the impact of this premium on portfolio performance is relatively small, and arguably negligible.
As demonstrated in this study, state and local taxes can make a substantial impact on a portfolio’s performance. After considering taxes, corporate bonds showed inferior performance over U.S. government issues. However, the risk and return performance difference in U.S. government and non-government bonds in a diversified portfolio may be negligible for a tax-advantaged account.
Practical Implications for Planners
Given this paper’s analysis, it should be clear that corporate bonds will likely hinder total portfolio performance when considering the impact of state or local taxes. Financial planners working with a client’s taxable portfolio should strongly consider U.S. government-issued debt over corporate debt.
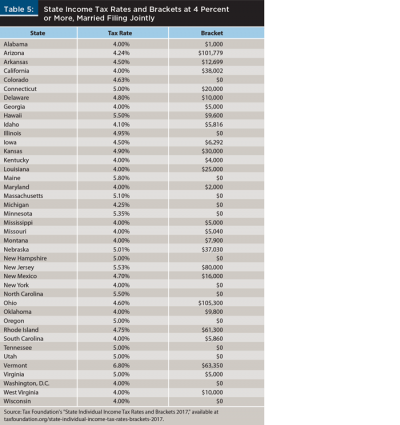
A 4 percent effective state and local tax can be exceptionally low (see Table 5). Given how easy it is to achieve a 4 percent state income tax bracket—it is $0 in many states—a typical financial planning client would likely be impacted by the decision to use taxable bonds. As might be expected, however, each state has its own special set of tax laws.
Drawdown performance. The lower correlation of U.S. government debt to stock market performance showed that U.S. government-issued debt was the superior portfolio diversifier. This effect was further pronounced during market drawdowns. During significant market drawdowns, investors would likely be thankful to be holding U.S. government bonds over corporate bonds.
Cautions for application. Correlation, including drawdown correlation, changes over time. Moreover, the negative correlation premium of U.S. government bonds over corporate debt also changes over time.
This study used long-term bond index data to compare the two distinct bond asset classes because of the robustness of the data; the performance of these two bond asset classes of shorter maturities were not compared. This is because bond index data of shorter maturities is less robust. For example, the Citi U.S. Broad Investment-Grade Corporate Bond Index 3–7 Years AAA/AA only stretches back to 1980. However, using a shorter maturity bond index over the shorter timeline may produce similar results (see Table 6).

As with the longer maturity bond indices, a small increase in equity allocation to the portfolio holding Treasuries provided similar risk and return performance to a portfolio holding corporate bonds pre-tax. Thus, it does not appear that investors must use the longer-term bonds to capitalize on the findings in this study.
Duration differences may also need to be considered. For an equivalent term, U.S. government-issued debt will have a higher pre-tax duration than corporate-issued debt, because corporate debt issues contain a higher pre-tax coupon. Planners wary of higher duration debt may wish to carefully consider opting for U.S. government-issued debt and its accompanying higher pre-tax duration. However, corporate bonds—after taxes—may provide a similar duration to U.S. government bonds of equal maturities (see Table 7).

Consider an example comparing two bonds of equal maturities for sale via Schwab.com in August 2017: a roughly five-year Treasury note (CUSIP 912828TY6) and a AAA-rated corporate bond issued by Microsoft (CUSIP 594918AQ7). Assuming a 1 percent increase in interest rates, the five-year Treasury bond in this example would lose just six BPS more in value than the corporate bond. Assuming a 4 percent state income tax rate, the difference drops to four BPS. Assuming a 13.3 percent state income tax, as is the maximum rate in California, the Treasury note now has a shorter post-tax modified duration than the corporate bond.
A final note of caution regarding application of the results from this study: if every investor were to drop corporate bonds in favor of Treasuries, the results of this study would likely no longer be applicable—this is the publication effect. The price of U.S. government debt would increase and the price of corporate debt would decrease. Accordingly, corporate bonds would have the potential to yield substantially better return characteristics—possibly even before taxes. The flight-to-quality benefit offered by Treasuries would likely remain.
Suggestions for Future Research
Other fixed-income asset classes can be tested, including shorter-term maturity bonds and lower investment grade bonds, as well as municipals. A portfolio holding international stocks should also be considered. Given that taxes played a major role in the outperformance of the two asset classes, examining the role of municipals is extremely relevant. Examining the impact of a portfolio holding a greater weighting of bonds can also be measured. And given the availability of superior data, periods as small as days can also be examined. A deeper analysis of bond performance following the initial drawdowns in the years following the 1929 stock market crash can be analyzed as well. Lastly, a comparison using pure Treasury bond returns (as opposed to the broader category of U.S. government debt) can be used in a successive analysis.
Endnote
- CRSP 1-10 is the Center for Research in Security Prices’ 1-10 Deciles index. CRSP (www.crsp.com) is one of the 12 research and learning centers at the University of Chicago Booth School of Business. Its historical indexes serve as benchmarks for the investment community and as a foundation for academic research.
References
Connolly, Robert, Chris Stivers, and Licheng Sun. 2005. “Stock Market Uncertainty and the Stock-Bond Return Relation.” The Journal of Financial and Quantitative Analysis 40 (1): 161–194.
Damodaran, Aswath. 2005. “Marketability and Value: Measuring the Illiquidity Discount.” Posted Nov. 14 to Social Science Research Network, available at papers.ssrn.com/abstract_id=841484.
Elton, Edwin J., Martin J. Gruber, Deepak Agrawal, and Christopher Mann. 1999. “Is There a Risk Premium in Corporate Bonds?” New York University Stern School of Business working paper available at pages.stern.nyu.edu/~eelton/working_papers/Is_there_a_risk_premium_in_corporate_bonds_2.pdf.
Elton, Edwin J., Martin J. Gruber, Deepak Agrawal, and Christopher Mann. 2001. “Explaining the Rate Spread on Corporate Bonds.” The Journal of Finance 56 (1): 247–277.
Fama, Eugene F., and Kenneth R. French. 1993. “Common Risk Factors in the Returns on Stocks and Bonds.” Journal of Financial Economics 33 (1): 3–56.
Ilmanen, Antti. 2003. “Stock-Bond Correlations.” The Journal of Fixed Income 13 (2): 55–66.
Li, Lingfeng. 2002. “Macroeconomic Factors and the Correlation of Stock and Bond Returns.” Yale University Department of Economics working paper available at ssrn.com/abstract_id=363641.
Miller, Andrew. 2016. “Will Bonds Deliver Crisis Alpha in the Next Crisis?” Alpha Architect. Blog posted June 7 at alphaarchitect.com/2016/06/07/will-bonds-deliver-crisis-alpha-in-the-next-crisis.
Philips, Christopher B., David J. Walker, and Francis M. Kinniry Jr. 2012. “Dynamic Correlations: The Implications for Portfolio Construction.” Vanguard research paper available at vanguard.com/pdf/s130.pdf.
Stivers, Chris, and Licheng Sun. 2002. “Stock Market Uncertainty and the Relation Between Stock and Bond Returns.” Federal Reserve Bank of Atlanta working paper 2002-3, available at citeseerx.ist.psu.edu/viewdoc/download?doi=10.1.1.197.4328&rep=rep1&type=pdf.
Swedroe, Larry. 2014. “Swedroe: Fixed Income’s Low Risk Anomaly.” ETF.com, posted April 23 at etf.com/sections/index-investor-corner/21862.html?nopaging=1.
Swedroe, Larry. 2016. “Swedroe: Reconsidering Corporate Bonds.” ETF.com, posted July 15 at etf.com/sections/index-investor-corner/swedroe-reconsidering-corporate-bonds?nopaging=1.
Swensen, David F. 2005. Unconventional Success. New York, N.Y.: Free Press.
Citation
Luskin, Jon. 2017. “Examining Total Portfolio Performance: U.S. Government Vs. Corporate Bonds.” Journal of Financial Planning 30 (12): 46–55.