Journal of Financial Planning: August 2014
John E. Grable, Ph.D., CFP®, holds an Athletic Association Endowed Professorship at the University of Georgia where he conducts research and teaches financial planning. He is best known for his work related to financial risk tolerance assessment and psychophysiological economics. He serves as co-director of the Financial Planning Performance Laboratory at UGA. Email author HERE.
Swarn Chatterjee. Ph.D., is an associate professor of financial planning at the University of Georgia. He has published more than 40 peer-reviewed papers and teaches classes in investing, portfolio management, and behavioral finance. He serves as co-director of the Financial Planning Performance Laboratory at UGA. Email author HERE.
Executive Summary
- Gamma, as a financial planning term, refers to the additional value obtained by someone from making more informed financial planning decisions. Gamma is the value added through the use of financial planning tools and techniques beyond the management of portfolio assets.
- This paper proposes a similar value measure called zeta (z). Zeta, as defined here, is a function of alpha and gamma, and represents the value of advice in reducing wealth volatility.
- This study estimated zeta results for clients who met with a financial adviser prior to the Great Recession. Respondents who had previously met with a financial adviser experienced less wealth volatility, on a risk-adjusted basis. Results suggest that the financial advisory services add value that is quantifiable and meaningful in terms of reducing wealth volatility over time.
Financial advisers generally assume that their professional expertise and advice adds value to the lives of clients (Hanna and Lindamood 2010). There is, in fact, limited evidence in the literature to support this assertion. The purpose of this paper is to report findings from a study that was undertaken to quantify the value of financial advice.
As has been documented frequently and extensively in the academic literature and public media, the sense of economic well-being shared by many Americans was severely challenged beginning in 2007 (Greenspan 2013). The year 2007 marked the beginning of what can best be described as a period of financial stress. Financial stress, as used in this paper, can be defined from a macroeconomic and household perspective.
Hakkio and Keeton (2009) described macroeconomic financial stress as the “interruption to the normal functioning of financial markets” (p. 6). Financial stress, when viewed from this lens, exists when policymakers and consumers experience increased uncertainty about (1) the value of assets, (2) the behavior of other investors, (3) information gaps between buyers and sellers of assets, (4) the prudence of holding risky assets, and (5) the usefulness of illiquid assets within portfolios.
At the household level, financial stress is generally defined in the context of the reactions exhibited by those in a household after experiencing a financial shock, such as losing employment, receiving late payment notices, being forced to forgo planned expenditures because of lack of income or assets, and losing wealth because of systematic changes in global markets (Garman, Leech, and Grable 1996). Negative reactions such as questioning the real value of assets—such as real estate and equities—and making significant asset allocation shifts from risky illiquid assets to high-quality, low-risk assets are indicative of events triggered by financial stress.
Actions taken by policymakers beginning in 2005 to simultaneously promote asset building and restrict open access to the credit markets, coupled with the growing use of financial derivatives created to help deal with information asymmetry, contributed to a series of events that led to what is now commonly called the Great Recession. From a nominal peak in the mid-2000s, American households collectively experienced drops in both income and wealth for the remainder of the decade. In some circumstances, the negative change in wealth has yet to be rectified.
Amidst this background, the financial services marketplace experienced unprecedented growth. According to a January 2011 U.S. Government Accountability Office (GAO) report on consumer finance, “Regulatory Coverage Generally Exists for Financial Planners, but Consumer Protection Issues Remain” (www.gao.gov/new.items/d11235.pdf), the number of financial advisers doubled during the first decade of the 21st century. In the early 2000s, the number of Certified Financial Planner™ (CFP®) professionals was less than 30,000; by 2010 that number exceeded 60,000. Much of this growth occurred prior to and during the beginning phases of the Great Recession.
Surprisingly, even with the growth in the number of advisers, less than one quarter of Americans (22 percent) were working with a financial professional at the outset of the Great Recession. The GAO noted that rather than prompting a decline in the demand for financial advisory services, the financial stress experienced by Americans during the Great Recession created even greater demand for financial advice. The GAO has projected that by 2018 there will be more than 271,000 financial advisers working the United States. Kevin Keller, CEO of Certified Financial Planner Board of Standards Inc., has expressed the possibility of certifying up to 100,000 of these professionals by the end of the decade1; however, even reaching these numbers may not be enough to meet the burgeoning demand for financial planning and advisory services.
The combination of global and household financial stress, the growth of the financial services profession, and the future of financial services delivery in the United States leads to an important question: Does professionally delivered financial advice, broadly defined, provide value as a professional service? This paper was written to address this question in the context of the Great Recession. This paper describes changes in wealth over the period 2007 to 2009 for Americans aged 45 to 53 in 2010. The paper specifically illustrates the value added by financial advisers—zeta (z)—in reducing wealth volatility at the household level.
Background Review
As outlined in the January 2011 GAO report on consumer finance, the term “financial adviser” among others is still a relatively undefined expression. In general, however, the term financial adviser is most appropriately used to describe someone who uses a process to help clients set financial goals, examine their current financial situation, and measure financial progress (CFP Board 2013).
Many financial advisers use the six-step planning process to create a targeted or comprehensive financial plan for a client. The process steps are: (1) establishing the client-adviser relationship based on full disclosure and ethical standards, (2) gathering client data and developing goals, (3) analyzing and evaluating all aspects of the client’s financial situation, (4) making and reviewing recommendations, (5) implementing recommendations, and (6) benchmarking progress against financial goals.
Advisers who follow the planning process tend to focus broadly on improving a client’s overall financial situation rather than looking for improvement in only one aspect of a client’s financial situation. Stated another way, financial advisers who abide by the planning process are more likely to assess a client’s income and wealth situation within the context of client-derived financial goals from a generalist perspective. Rather than concentrate, for example, only on increasing the value of a client’s investment portfolio, the planning process is designed to ensure that clients achieve financial stability over time, consistent with stated goals and lifecycle expectations.
The Role of Gamma
When asked, nearly all financial advisers will indicate that their portfolio management and general advisory services provide meaningful, long-term financial benefits to the clients they serve. Until recently, the validity of this broad assessment has only been partially supported (see Hanna and Lindamood 2010). The field has spent nearly 50 years quantifying the effectiveness of portfolio management advice and developing advisory tools, but has remained somewhat silent in documenting how other services add value to a client’s situation. Steps were taken in 2012 to help fill this missing piece of the planning puzzle. Blanchett and Kaplan (2013) introduced a new concept and metric titled “gamma” as a way to quantify the value added by appropriately implemented financial planning tools and techniques beyond portfolio management applications. Specifically, gamma refers to the additional value planning techniques provide that help clients make better, more-informed financial decisions.
In some respects, gamma is similar to the concept of alpha within modern portfolio theory. Alpha refers to the return on a portfolio in excess of the expected risk-adjusted return. In effect, alpha indicates whether or not an active portfolio management approach is or has been effective historically. Advisers who exhibit a positive alpha are able to quantify their active management value within the context of portfolio management services. A negative alpha, on the other hand, indicates suboptimal risk-adjusted performance.
The concept of gamma extends this reasoning further by suggesting that the prudent application of financial planning concepts can add risk-adjusted excess portfolio performance. Blanchett and Kaplan (2013) explored five types of gamma that impact financial outcomes experienced by retirees: (1) using appropriate asset allocation strategies; (2) creating dynamic withdrawal strategies at retirement; (3) understanding the appropriate use of annuity products; (4) choosing between tax-efficient investing and withdrawal strategies; and (5) building portfolios that account for risks faced by retirees through liability relative portfolio optimization. Although their study was focused on estimates of retirement gamma, it is reasonable to hypothesize that gamma-like returns can exist for anyone who follows an “efficient financial planning strategy” (Blanchett and Kaplan, p. 20).
Although their research did not specifically examine the role financial advisers play in shaping these client outcomes, Blanchett and Kaplan (2013) alluded to how financial planning techniques help improve portfolio efficiency. They estimated that a typical retiree could generate 23 percent more income on a certainty-equivalent, utility-adjusted basis when using financial planning techniques, compared to implementing a 4 percent retirement income withdrawal strategy and a 20 percent equity allocation portfolio. They noted that this works out to an increased average annual return of 1.59 percent. That is, the gamma-equivalent alpha generated by improved financial decision making is equal to nearly 2 percent annually, at least within the context of retirement planning. It is reasonable to assume that similar improvements in returns can be achieved by those who work directly with financial advisers following the financial planning process.
Introducing Zeta
This paper extends the work of Blanchett and Kaplan (2013) by quantifying the value of financial advice as a means for managing total wealth. Zeta specifically measures the extent to which financial advice can be used to minimize wealth volatility. Zeta is premised on the overarching assumption that the value of financial advice can best be measured in times of financial stress. It is during moments of macroeconomic and household stress that the value proposition associated with financial advice can best be examined. The analysis that follows is based on the following premises: (1) financial advisers who follow the planning process have a goal to manage a client’s total financial wealth rather than a specific aspect of wealth; (2) a facet of financial advice value comes from reducing wealth volatility over time; and (3) the value of financial advice can be quantified into a zeta estimate.
The first premise flows from the definition of financial planning as outlined by CFP Board and others (Lytton, Grable, and Klock 2013; Mittra, Sahu, and Starn 2012). In effect, financial advisers who adopt a planning perspective are interested in the evaluation of multiple aspects of a client’s life on a current basis. Within the planning process, it is common to integrate recommendations related to cash flow, net worth, tax, insurance, investment, retirement, and estate topics in ways that serve to optimize someone’s overall wealth situation. It is unreasonable to assume that a financial adviser who is guided by the process of financial planning would ever eschew a recommendation that would help a client systematically minimize asset loss. For example, even though financial advisers may not include the value of a client’s home in their assets under management fee, few advisers would ever avoid real estate topics, such as mortgage choice, leverage ratios, and debt load, when working with clients. That is, even though a financial adviser may be focused primarily on issues related to, say, portfolio management or retirement income generation and withdrawal rate strategies, someone following the process of financial planning will also provide guidance and advice on the prudent acquisition, sale, allocation, and use of other assets.
The second premise is based on the notion that consumers of financial service products and services tend to be risk averse. Recall that financial stress, at the household level, results from a negative reaction to a financial stressor. Although nearly all people prefer to experience an increase in wealth over time, few are comfortable with the prospect of losing wealth. This holds true regardless of demographic or socioeconomic profile (Kahneman and Tversky 1979). In other words, nearly all clients are risk averse when presented with the possibility of facing a wealth decline (Weagley and Gannon 1991). Under this premise, in moments of financial stress, clients will tend to prefer to hold their wealth in less risky assets. As such, financial advisers who can reduce the volatility associated with wealth over time may be in a position to add qualitative and quantitative value to the client-adviser relationship.
The third premise related to quantifying the value of financial advice is based most closely on the work of Blanchett and Kaplan (2013) and Scott (2012). These researchers argued that financial planning tools and techniques can be used to add value in ways that go beyond portfolio management issues. Their original works focused on information and knowledge as factors driving more intelligent decisions. This paper advances this notion by suggesting that financial advisers who follow the planning process, as subject matter experts, likely add value by increasing client financial competence and confidence, as well as providing recommendations that reduce wealth volatility over time.
At least in terms of retirement planning, Blanchett and Kaplan were able to show that the use of planning tools adds 1.59 percent of gamma-equivalent alpha. It is reasonable to assume that similar returns exist for pre-retiree clients as well, or what is termed zeta in this study. Consider, for example, a client who seeks the help of a financial adviser compared to someone who does not. Holding all other factors constant, the concept of zeta suggests that those who have engaged the services of a financial adviser should experience financial outcomes that are superior to those faced by others. That is, the combination of portfolio allocation recommendations and financial advice should minimize wealth volatility over time. Data from the Great Recession provides an ideal market laboratory in which to test this hypothesis.
Methods
The primary purpose of this study involved testing the hypothesis that financial advice adds value through the minimization of wealth volatility over time. It is important to note that wealth, as conceptualized in this study, is defined broadly to include portfolio assets, real estate, and other forms of tangible and intangible assets. This hypothesis was tested using data from the 2010 release of the National Longitudinal Survey of Youth (NLSY). The NLSY is a publically available dataset that is sponsored by the U.S. Bureau of Labor Statistics. The survey is nationally representative of Americans born between 1957 and 1964. Data are comparable with other nationally representative datasets, such as the Health and Retirement Study and the Panel Study of Income Dynamics (Schoeni, Stafford, McGonagle, and Andreski 2014; Zagorsky 1999, 2013). When first interviewed, respondents were between 14 and 22 years of age. The 24th round of interviews was concluded in 2010 when respondents were between 45 and 53 years of age.
Beginning in 2006–2008, a specific retirement module was added to the NLSY. These questions were limited to respondents who were currently 50 years of age or older. Data from this module of questions was used in this analysis. Although the demographic and socioeconomic characteristics of the sample are nationally representative for those age 50 or older, data for this study were delimited by the fact that not all respondents were asked whether or not they had reached out to a financial adviser for help. The result of the delimiting factors was a useable sample size of 464 respondents.
Wealth Variables
Wealth was measured in 2007 and again in 2009. Respondents were asked, “Suppose you were to sell all of your major possessions (including your home), turn all of your investments and other assets into cash, and pay all of your debts. How much would you have left?”
It is important to put the net wealth data into context. When viewed from a mean and standard deviation perspective, the variability in wealth during the two periods was quite large, which resulted in skewed mean and standard deviation estimates. The standard deviation of wealth change was quite large. This suggests that the Great Recession did not impact everyone in the same manner. Net wealth fell, on average, across the sample; however, some individuals experienced significant increases in wealth, at least in percentage terms. Increases may have resulted from the receipt of an inheritance, a windfall bonus, prudent investments, or serendipity.
Given the skewed nature of the wealth estimates, data were trimmed so that the maximum possible increase in wealth from 2007 to 2009 was 1,000 percent. Given the cross-sectional nature of the wealth data used in the study, it was not possible to smooth the wealth estimates. As such, the maximum loss in wealth was limited to 100 percent. The following net wealth data provide a baseline for future comparisons. The full delimited sample net wealth in 2007 was $130,747,788. In 2009, net wealth had fallen to $101,363,536, for a total loss of approximately $29,484,000, or nearly 23 percent. The standard deviation of wealth estimates was 177.14 percent.
Financial Advice
The NLSY sample provides an interesting glimpse into the impact the Great Recession had on household wealth in the United States. Data for use in this study were delimited to include only respondents within the NLSY that indicated either positively or negatively meeting with a financial adviser in 2005, prior to the financial shocks that began in 2007. The decision to use sequential results was purposely made in order to provide some causal evidence linking financial advice with future financial outcomes and zeta results. This causal linkage would have disappeared had the sample delimitation been made using help-seeking behavior in 2007.
Respondents over the age of 50 were asked the following question: “People begin learning about and preparing for retirement at different ages and in different ways. Have you consulted a financial planner about how to plan your finances after retirement?” Of the 464 respondents, 128 indicated meeting with a financial planner. At 28 percent of the sample, this corresponds closely with the 2011 national average use of financial advisers as reported by the GAO (22 percent).
Zeta Estimates
A two-step process based on the working premises presented earlier in the paper was used to evaluate the zeta value added through financial advice. First, respondents were separated into two groups: (1) those who indicated meeting with a financial adviser in 2005; and (2) those who did not. Second, the longer-term impact of financial advice was measured by comparing 2007 wealth figures with 2009 wealth data from the same respondents.
Two approaches were used to evaluate the value of financial advice in minimizing volatility in wealth from the nominal high in 2007 through 2009. The first step involved creating mean and standard deviation wealth estimates for the two groups and calculating wealth returns over the period. This was followed by standardizing the returns for the amount of risk taken. The level of risk implied by the wealth volatility estimates was calculated using a modified standard deviation to adjust for the period of excess negative returns.2 This measure was then used within a modified Modigliani measure (M2) to estimate the expected level of wealth volatility controlling for risk (Modigliani and Modigliani, 1997). One advantage of using the method of risk-adjusted performance, as described by Modigliani and Modigliani, is that the outcome measure can be expressed in the same units as the underlying performance being evaluated (percentage returns in this case). In this study, the M2 ratio was estimated using the following formula:
where, M2 is the Modigliani measure, RW is the mean wealth return during the period 2007 to 2009, Ri is the inflation rate during the period,3 σW is the standard deviation of the return on wealth, and σEW is the benchmark standard deviation of the return on wealth. The remainder of this paper describes the results of the hypothesis tests. Specifically, wealth changes between 2007 and 2009, for those who did and did not meet with a financial adviser in an earlier period, are illustrated. Additionally, a zeta estimate is presented showing the value of financial advice.
Results
Before presenting the core findings from this study, it is important to place the results in context. First, as has generally been reported in the literature, individuals who sought financial guidance tended to be wealthier than others. This is not to imply a causal effect, but rather to highlight a bivariate association between financial advisory services and wealth. In 2007, those who sought guidance exhibited a mean household wealth of $521,700. This compared to $189,822 for those who did not seek help. Second, on average, the wealth of both those who met with and those who did not meet with a financial adviser declined over the period of study. Average household wealth declined to $412,509 and $143,805, respectively. Table 1 illustrates these dollar figures in terms of percentage and standard deviation of change. Nominally, those who reported using the services of a financial adviser did 3.31 percent better over the period with less dispersion from the respective average.
The results presented in Table 1 highlight an interesting story. In a perfect world, financial advisers, on the whole, should have anticipated the financial shocks and resulting stress that was soon to occur during the latter part of the 2000s. It is unlikely that many advisers actually did anticipate the difficultly that was to emerge, and even if they had, it is highly improbable that they could have positioned their clients’ wealth in such a way to eliminate wealth volatility (Greenspan 2013). Instead, the evidence shows a link between financial advice and reduced wealth volatility. That is, financial advisers helped reduce wealth volatility during one of the most turbulent economic episodes in American history. Even though those who met with a financial adviser lost wealth from 2007 to 2009, they lost proportionately less wealth than others.
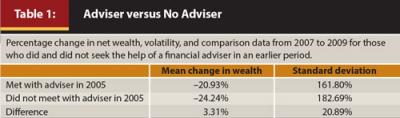
A key question comes to mind in relation to this finding. Specifically, was the 3.31 percent mean adviser advantage and the 20.89 percent reduction in wealth volatility over the multi-year period meaningful? These figures, after all, do not take into account the level of risk implied through a financial advisory service. The M2 model was used to test this question. Specific inputs into the formula were as follows:
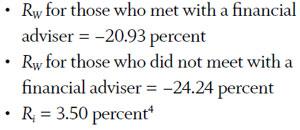
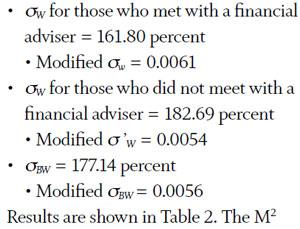
measures indicate the risk-adjusted level of wealth volatility households should have expected had they simply been exposed to benchmark levels of wealth variation. As a reminder, M2 is based on the Sharpe ratio. The M2 ratio is, however, more intuitive. The M2 can be interpreted in the same units as the return of the underlying measure. The ratio compares the return of a portfolio (broadly defined) as if it had the same risk as that of the market or the underlying benchmark index of the portfolio, thus creating an apples-to-apples comparison between the risk-adjusted return of the portfolio with respect to another portfolio or risk-adjusted benchmark return (Bodie, Kane, and Marcus 2010; Le Sourd 2007; Strong 2003). The M2 is not an “alpha” type of indicator but rather a comparison tool that shows that if risk associated with obtaining financial advice, compared to the risk taken by those who did not engage the services of a financial adviser, had been the same as the overall change in wealth, those who received financial advice would have done even better than households who did not consult a financial adviser.

Estimating Zeta
Zeta, as defined in this study, was estimated using the following formula:
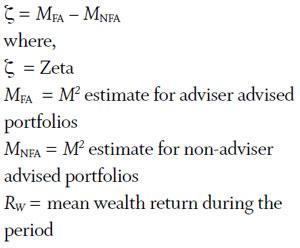
Using this formula, which is similar to the manner in which risk-adjusted performance is determined within a modern portfolio framework, results in the following zeta estimate:
Zeta = 6.25 percent
In effect, respondents who had met with a financial adviser not only did nominally better, they also did so in a risk-adjusted manner. The cumulative performance advantage offered by financial advisers in reducing wealth volatility was more than 6 percent during the period.
Discussion
In their noteworthy study, Blanchett and Kaplan (2012) were able to show that financial planning tools and techniques can be used to add value by enhancing knowledge that clients can use to make better-informed decisions. The outcome associated with the use of certain planning tools generates what they termed gamma. Blanchett (2013) further described gamma as the incremental value that financial planning tools add to the performance of portfolios beyond basic asset allocation (measured through beta) and investment selection (measured through alpha) processes.
In other studies, Bennyhoff and Kinniry (2010) and Scott (2012) described this value addition to a client’s portfolio as an adviser’s or household’s alpha. According to Blanchett, although gamma is a more abstract concept, and relatively more difficult to measure, it remains a factor that generates favorable outcomes for consumers. Moisand (2013) noted that although gamma is difficult to formalize, it is very important that households be educated about the potential benefits of financial advice and counsel. Zeta is one tool that can be used to illustrate this point. As illustrated in this study, alpha and gamma functioning together results in zeta. Zeta can then be used to quantify the way the financial advice helps reduce wealth volatility.
Financial advisers most often generate zeta by following and applying the comprehensive financial planning process. It is the inclusive nature of advice and guidance that generates value beyond what portfolio management, asset selection, or distribution advice, for example, can solely achieve.5
At its core, the financial planning process puts clients, instead of portfolio issues, at the center of recommendation development. According to Hogan (2012), good financial advice also integrates clients’ personal values and broadens the client perspective from being solely anchored on portfolio management to viewing the entire financial picture over a client’s life course. According to Haubrich (2013), appropriately delivered financial advice also takes into account a client’s human capital. Forward-looking financial plans take into account a client’s ability to convert this human capital to wealth across time. Haubrich described this process as career asset management.
This study adds to the financial planning literature by testing the relationship of changes in wealth over a multi-time period. Results are not, however, without controversy. Some may wonder whether those who met with a financial adviser did better because they were exposed to the planning process or whether the result would have happened because of other factors—the person was more conscientious or wealthy to begin with, for example. Although it is impossible to address this question directly given restrictions in the dataset, it is possible to conjecture an answer.
Although it is true that wealthier households were more likely to report meeting with an adviser, both groups studied were composed of households with varying levels of wealth. It may be that wealthier, more conscientious individuals are more likely to seek the help of an adviser; however, this does not ensure that the outcomes associated with this activity are guaranteed to improve financial outcomes. In other words, a help-seeking bias is not sufficient to create reduced wealth volatility.
Others may argue that wealthy people are, by definition, smarter than less wealthy individuals, and as such, they should be expected to generate financial outcomes that are consistently higher than those from less wealthy households. Although this argument may be valid, the issue presented is really one of risk capacity. In other words, wealthy individuals may be in a position to take on more risk than less wealthy households. Using this argument, however, one would expect to see increased volatility associated with their wealth. This was not the case. However, the risk-adjusted performance of the portfolio was much better. It appears that regardless of absolute wealth, the financial advice adds value by supplementing traditional portfolio allocation decisions and gains made from the use of planning tools. The value of financial advice can be found in overall wealth management, which includes portfolio management as well as tax planning, estate planning, retirement planning, insurance planning, family dynamics, and human capital acquisition management.
Results suggest that financial advice may add meaningful value within the consumer marketplace when financial stress is experienced. In this study, those who had previously met with a financial adviser did 6.25 percent better than others when accounting for the level of risk taken. Future research is warranted to replicate this finding and to further examine the concept of zeta. For example, future work should test whether zeta results are possibly due, in part, to other client factors, such as marital status, education, income, or other socioeconomic indicators. Additionally, future zeta estimates should be extended to include different age cohorts and wealth benchmarks. Estimates of zeta in bull markets may also provide evidence of the value of financial advice.
The key takeaway from this study, however, is that attempts to quantify the value of financial advice appear to offer potential for future study. The concept of zeta shows that financial advice can be quantified as a separate contribution from returns obtained through the portfolio management process. Overall, this study lays the groundwork showing that financial advice is likely associated with a reduction in wealth volatility.
Endnotes
- See the December 2012 Financial Planning article “Raising the CFP Profile: CEO Kevin Keller Discusses Enforcement” at www.financial-planning.com.
- Past literature suggests that a modified standard deviation ought to be used to generate more accurate risk-adjusted performance measurement estimates during periods of excess negative returns, such as the one during the period of this study. The standard deviation modification formula (σ` = (σ –1)/100) used in this study was suggested by Israelsen (2005).
- Traditionally, the risk-free rate of return is used in the formula. This is appropriate when the ratio is being used to evaluate an investment portfolio. Given that wealth is more inclusive than just portfolio assets, the inflation rate was used as the baseline return measure.
- The inflation rate was estimated using an online calculator at www.usinflationcalculator.com.
- Some readers may question whether the reduction in wealth volatility was large enough to warrant the expense associated with engaging the services of a financial adviser. It is important to note that few financial advisers charge a management or retainer fee based on either gross or net assets. Rather, it is more common for financial advisers to charge based on a percentage of investable assets. Given that the wealth figures used in this study include assets that fall outside a typical assets under management or wrap account fee, the resulting reduction in wealth volatility likely more than makes up for typical advisory fees.
References
Bennyhoff, Donald G., and Francis M. Kinniry Jr. 2010. “Advisor’s Alpha.” Vanguard Research (April) advisors.vanguard.com.
Blanchett, David M. 2013. “The ABCDs of Retirement Success.” Journal of Financial Planning, 26 (5): 38–45.
Blanchett, David, and Paul Kaplan. 2013. “Alpha, Beta, and Now…Gamma.” Morningstar Investment Management. corporate.morningstar.com.
Bodie, Zvi., Alex Kane, and Alan J. Marcus. 2010. Essentials of Investments (8th ed.). New York: McGraw-Hill Irwin.
CFP Board. 2013. “Working with a Financial Planner.” letsmakeaplan.org/working-with-a-financial-planner/financial-planning-process.
Garman, E. Thomas, Irene E. Leech, and John E. Grable. 1996. “The Negative Impact of Employee Poor Personal Financial Behaviors on Employers.” Journal of Financial Counseling and Planning 7: 157–168.
Greenspan, Alan. 2013. The Map and the Territory: Risk, Human Nature, and the Future of Forecasting. New York: Penguin Press.
Hakkio, Craig S., and William R. Keeton. 2009. “Financial Stress: What Is It, How Can It Be Measured, and Why Does It Matter?” Federal Reserve Bank of Kansas City, Economic Review 3: 5-50.
Hanna, Sherman D., and Suzanne Lindamood. 2010. “Quantifying the Economic Benefits of Personal Financial Planning.” Financial Services Review 19 (2): 111–127.
Haubrich, Michael P. (2013). “Career Asset Management: Where Wealth Is Created.” Journal of Financial Planning 26 (2): 22–24.
Hogan, Paula. (2012). “Financial Planning: A Look from the Outside In.” Journal of Financial Planning 25 (6): 54–62.
Israelsen, Craig (2005). “A Refinement to the Sharpe Ratio and Information Ratio.” Journal of Asset Management 5 (6): 423–427.
Kahneman, Daniel, and Amos Tversky. 1979. “Prospect Theory: An Analysis of Decisions Under Risk.” Econometrica 47 (2): 313–327.
Le Sourd, Veronique. 2007. “Performance Measurement for Traditional Investment.” Financial Analysts Journal 58 (4): 36–52.
Lytton, Ruth H., John E. Grable, and Derek D. Klock. (2013). The Process of Financial Planning: Developing a Financial Plan (2nd ed.). Erlanger, Kentucky: National Underwriter.
Mittra, Sid, Anandi P. Sahu, and Harry Starn. 2012. Practicing Financial Planning for Professionals. Detroit, Michigan: American Academic Publ
ishing.
The Journal of Portfolio Management 23 (2): 45–54.
Moisand, Dan. 2013. “Converting a Do-It-Yourselfer to a Client.” Financial Advisor. April.
Schoeni, Robert T., Frank Stafford, Katherine A. McGonagle, and Patricia Andreski. 2014. “Response Rates in National Panel Surveys.” The ANNALS of the American Academy of Political and Social Science 645 (1): 60–87.
Scott, Jason. 2012. “Household Alpha and Social Security.” Financial Analysts Journal 68 (5): 6–10.
Strong, Robert A. 2003. Portfolio Construction, Management, & Protection (3rd ed.). Mason, Ohio: Thomson-Southwestern.
Weagley, Robert O., and Colleen F. Gannon. 1991. “Investor Portfolio Allocation.” Journal of Financial Counseling and Planning 2 (1): 131–153.
Zagorsky, Jay L. 1999. “Young Baby Boomers Wealth.” Review of Income and Wealth 45 (2): 135–156.
Zagorsky, Jay L. 2013. “Do People Save or Spend Their Inheritances? Understanding What Happens to Inherited Wealth.” Journal of Family and Economic Issues 34 (1): 64–76.
Citation
Grable, John E. and Swarn Chatterjee. “Reducing Wealth Volatility: The Value of Financial Advice as Measured by Zeta.” Journal of Financial Planning 27 (8) 45–51.