Journal of Financial Planning: April 2013
Executive Summary
- In today’s near-zero interest rate environment, dividend investing is back in fashion. The popularity of stocks that offer investors generous dividend distributions has only been heightened by their recent performance. From January 1, 2011, to September 30, 2012, the FTSE High Dividend Yield Index of U.S. stocks returned 26 percent compared to just 19 percent for the S&P 500 Index.
- In seeking to better understand the outperformance of high-dividend-yielding stocks relative to the broader equity market, this paper dissects their return patterns and examines returns over a period of more than 30 years through the lens of risk factors.
- Results suggest that it was actually the value factor that is inherent in most high-dividend-yielding stocks that was responsible for the outperformance of these stocks over the period studied.
- The yield factor associated with high-dividend-yielding stocks actually detracted from performance.
- A takeaway for advisers and investors is that if outperforming the broader market on a medium- to long-term basis is a main objective, applying a value tilt to a portfolio is generally a better strategy than overweighting high-dividend-yielding stocks.
Gregg S. Fisher, CFA, CFP®, is chief investment officer of Gerstein Fisher, an independent investment management and advisory firm founded in 1993. Gerstein Fisher manages investments on behalf of individuals, families, and institutions using a scientific, quantitative research-based approach that is grounded in economic theory and common sense.
Acknowledgement: I would like to acknowledge the assistance of the Gerstein Fisher Investment Strategy Team in researching this paper.
The notion that the high-dividend-yielding stocks outperform the market is widely accepted by investors. Consider results from a Tweedy, Browne Company LLC (2012) Worldwide High Dividend Yield Value Fund white paper. The paper provided a comprehensive list of publications supporting this notion. A paper by Arnott (2003) was cited. Arnott concluded that dividends are the main source of stock returns. Another paper by Keppler (1991) showed that investing in the highest-yielding stocks is a highly profitable strategy when viewed from a multi-country perspective. Siegel’s (2005) paper that reported correlations between S&P 500 stocks and high-dividend yields also was cited.
It is not surprising why so many investors hold a belief in the superiority of high-yield-dividend investing. The idea that high-yielding-dividend stocks outperform other equity investments has its roots in Wall Street folklore. For example, Dow (1920) made this argument nearly 100 years ago. One can easily add to this list of publications additional research including Ball (1978), Litzenberger and Ramaswamy (1979), and Miller and Scholes (1982).
This is not to say that investors believe that only high-yielding stocks outperform other stocks. Some have argued that over the long run, high-value stocks in general, not just those that pay dividends, outperform the overall market (Basu, 1977; Graham and Dodd, 1934; Stattman, 1980; Rosenberg, Reid, and Lanstein, 1985). The purpose of this study was to examine what really contributes to higher returns. This paper investigates the outperformance of dividend yield and value factors relative to the market and the relationship between these two factors in the context of the Barra (2007) performance attribution framework.1
A central issue for any investor, but portfolio managers in particular, is which of those two factors—dividend yield and value factors—best accounts for the common movement in stocks returns. Fama and French (1995) found that there is a common factor between value and earning yield; however, they suggested that it need not be related to the common component in the returns. Taylor and Brennan (2010) found that some combination of value returns contains information about future market returns over horizons of a few quarters, but dividend yield provides information that is useful for predicting market returns at business cycle horizons or longer. These insights confirm earlier findings of Fama and French (1988) that showed the power of dividend yields to forecast stock returns increases with the return horizon. Kothari and Shanken (1997) found that over the entire period 1926–1991, for example, value was stronger, but that over the 50-year sub-period of 1941–1991 dividend yield was stronger.
The citations influenced the author’s development of this paper by motivating and validating the risk factor approach in studying outperformance of stocks. This research adds to the existing body of literature by using the industry standard Barra (2007) performance attribution framework to show that outperformance of high-yielding-dividend stocks can be explained by the value factor. That is, outperformance returns appear to arise from value factors rather than as a result of dividend yield. The following discussion highlights the methodology involved in arriving at this result.
Methodology
Sources of stock returns over the 33-year period from August 1, 1979, to July 31, 2012, were analyzed. Risk factors, such as value, growth, momentum, and company size were separated out. The Russell 3000 Index was then divided into 10 deciles. Two portfolios were evaluated: one representing the entire market, which comprises all securities in the Russell 3000 Index (referred to as “market portfolio” in this paper) that essentially served as a benchmark, and the other being the decile comprising the highest-yielding stocks. In other words, the second portfolio consisted of the 10 percent of stocks with maximum exposure to the dividend yield factor (referred to as “high-dividend-yield portfolio”). Portfolio data were updated monthly (quarterly prior to 1987, prior to which monthly data were unavailable).
Results
The high-dividend-yield portfolio’s annualized return was 1.27 percentage points greater than that of the total market portfolio (12.42 percent vs. 11.15 percent), which was enough to compound wealth 48-fold over the 33 years compared to 33-fold for the market portfolio. But when the factors explaining the returns were decomposed, it was determined that the dividend yield factor actually contributed negative 1.02 percentage points annualized to the excess return. In other words, the factor actually detracted from performance.
With a multi-factor analytical approach, total returns can be broken down into contributions from several risk factors such as industries, asset selection, etc. The total contribution explained by risk factors for the high-yield-dividend portfolio was 3.16 percentage points higher than that of the market portfolio. The return from risk factors can be further broken down into individual risk factors like value, size, earnings yield, dividend yield, etc. Analyzing these individual risk factors provides an insight into what actually happens when investments in a high-dividend-yield portfolio are made.
Table 1 shows the exposure and annual contribution of the individual risk factors of the high-dividend-yield portfolio.
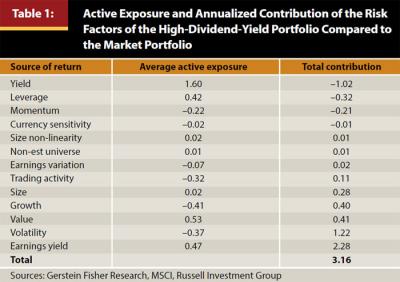
The following discussion takes a closer look at some of the line items in Table 1. The first factor is yield. This represents the dividend yield factor. As expected, yield has the highest exposure among other risk factors as the analysis deliberately tilted the portfolio toward high-yield-dividend stocks. The contribution of the yield factor, however, is a negative 1.02 percentage points, which indicates that the higher return of the high-yield-dividend portfolio is not due to the yield factor. Rather, the yield factor acts as a negative contributor.
Value, defined as the book value to price ratio, has a positive exposure of 0.53 and positive contribution of 0.41 percentage points, the third-highest contributor to the total returns. Earnings yield, defined as stock earnings per share divided by price per share, also has a positive exposure of 0.47 and is the highest contributor to total returns, adding 2.28 percentage points. This indicates that the portfolio of high-yield-dividend stocks also is tilted toward value and earnings yield, and that these factors are contributing meaningfully to the portfolio’s high returns.
The high-dividend-yield portfolio also is less volatile, as compared to the market, by a factor of −0.37. Volatility has a positive contribution of 1.22. Size is also important. Given that dividend-paying stocks usually are large capitalization companies, it would have been reasonable to expect the portfolio’s size factor to have been higher than it was. In fact, it was fairly neutral, with an exposure of just 0.02. To understand this result, the dividend-paying stocks were separated from the Russell 3000 and these were compared to the market portfolio as of July 31, 2012. The exposure of the size factor of this portfolio was 0.24, which demonstrates the fact that if investors were to take the entire lot of dividend-paying stocks (n = 1,382), investors would end up with a portfolio containing more large-capitalization companies as compared to the market. But because this analysis is only considering the top 10 percent of these stocks—for which, as of July 31, 2012, the exposure was −0.05—the average size of the companies in this top 10 percent portfolio is fairly similar to that of the market portfolio.
So what, in aggregate, do these risk factors tell investors? First, by focusing on high-yield-dividend stocks, investors unwittingly tilted their portfolios to value stocks. The dividend yield factor is subsumed in the value and earnings yield factors. Second, the value factor, not the yield factor, was responsible for the excess performance over the period studied. And finally, the dividend yield factor tilt also brought with it a high exposure to the earnings yield factor, which is a commonly used method for identifying value stocks and a strong contributor to positive returns.
The Benefit of a Value Tilt
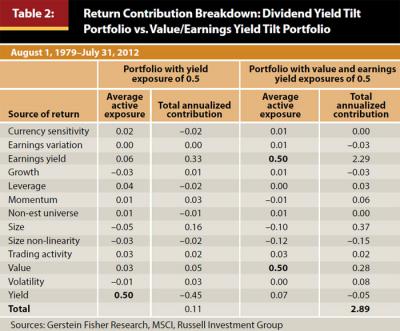
Back tests of the two versions of the market portfolio were conducted to illustrate the benefit of a value tilt within a portfolio. In the first, the portfolio’s dividend yield factor exposure was fixed at 0.50. In the second, an exposure of 0.50 was set for both the value factor and the earnings yield factor. Both portfolios were back tested over the same period (August 1, 1979–July 31, 2012). The portfolio with the value and earnings yield tilts realized a total annualized return of 14.12 percent, compared to 11.40 percent for the portfolio with the dividend yield factor exposure. Analyzing these returns using the multi-factor model and segregating the portion explained by the risk factors indicates that the exposure of 0.50 toward dividend yield is still a negative contributor, and that the most positive contribution comes from the earnings yield factor. The complete analysis of the returns explained by risk factors is shown in Table 2.
When the return streams on a monthly basis were analyzed, it was determined that the dividend yield factor had a negative contribution to return in 231 months and a positive contribution in 170 months. Not only was the dividend yield factor’s contribution to return negative more often than it was positive, but the average downside was larger than the average upside. Specifically, the monthly average for negative months was −0.40 percent compared to a monthly average of 0.35 percent for the positive months. As a result, the overall contribution of the dividend yield factor was negative.
But the question that remains unanswered is this: why is the return of the dividend yield factor negative? One possible explanation for this outcome could be a combination of delayed reaction by management and price momentum, as described below.
Markets do a reasonably good job of pricing risk. Based on the fundamentals of a company, the market adjusts the price of a company’s stock. Company management and boards of directors, however, tend to take longer to adjust dividend policy. Assuming dividends remain unchanged, an increase in stock price results in a decrease in dividend yield, and a decrease in the price results in an increase in the dividend yield. The net effect is that a stock that declines in price would now have a higher dividend yield, and the stock that increases in price would have a lower dividend yield. This is where the next dynamic, price momentum, comes into play.
Price momentum is the tendency of recent outperforming stocks to keep outperforming and underperforming stocks to continue on a downward trajectory. As it relates to the previous example, the theory of price momentum suggests that the stock that decreases in price will tend to keep decreasing in price and the stock that increases in price will tend to keep increasing in price. Said another way, the stock that now has a higher dividend yield will tend to decrease in price; that is, have a negative return. The stock that now has a lower dividend yield will tend to increase in price and have a positive return.
Conclusion
Investors who, in the past, tilted their portfolios toward high-dividend-yielding stocks took on an inherent value tilt. These investors might have attributed their over-performance when compared to the market to the yield generated by their stock holdings, but it was really the value and earnings yield factors that contributed to the portfolio’s strong returns relative to the broader market. In this study, the dividend yield factor has been shown to actually detract from portfolio performance. Nonetheless, high-yield-dividend stocks have their place in a diversified portfolio, particularly if investors value an investment’s income characteristics. Yet, if it is long-term outperformance over the broader market that investors are seeking, findings from this study suggest a more direct approach would be to employ a portfolio tilt toward value and high-earnings-yield stocks.
Endnote
- Barra/MSCI uses a history of asset patterns observed over time to build a multiple-factor model and to forecast portfolio or asset risk.
References
Arnott, Robert D. 2003. “Dividends and the Three Dwarfs.” Financial Analysts Journal 59, 2: 4–6.
Ball, Ray. 1978. “Anomalies in Relationships Between Securities’ Yields and Yield-Surrogates.” Journal of Financial Economics 6, 2: 103–126.
Barra. 2007. Barra Risk Model: Handbook. MSCI Barra: www.barra.com/support/library/barra_integrated_model/barra_risk_model_handbook.pdf
Basu, Sanjoy. 1977. “Investment Performance of Common Stocks in Relation to their Price-Earnings Ratio: A Test of the Efficient Market Hypothesis.” Journal of Finance 32 (June): 663–682.
Dow, Charles H. 1920. Scientific Stock Speculation. New York: The Magazine of Wall Street.
Fama, Eugene F., and Kenneth R. French. 1988. “Dividend Yields and Expected Stocks Returns.”
Journal of Financial Economics 22, 1: 3–25.
Fama, Eugene F., and Kenneth R. French. 1995. “Size and Book-to-Market Factors in Earnings and Returns.” Journal of Finance 50, 1: 131–155.
Graham, Benjamin, and David L. Dodd. 1934. Security Analysis: Principles and Technique. New York: McGraw-Hill.
Keppler, A. Michael. 1991. “The Importance of Dividend Yields in Country Selection.” Journal of Portfolio Management 17, 2: 24–29.
Kothari, S. P., and Jay Shanken. 1997. “Book-to-Market, Dividend Yield, and Expected Market Returns: A Time Series Analysis.” Journal of Financial Economics 44, 2: 169–203.
Litzenberger, Robert H., and Krishna Ramaswamy. 1979. “The Effect of Personal Taxes and Dividends on Capital Asset Prices: Theory and Empirical Evidence.” Journal of Financial Economics 7, 2: 163–195.
Miller, Merton H., and Myron S. Scholes. 1982. “Dividend and Taxes: Some Empirical Evidence.” Journal of Political Economy 90: 1118–1141.
Rosenberg, Barr, Kenneth Reid, and Ronald Lanstein. 1985. “Persuasive Evidence of Market Inefficiency.” Journal of Portfolio Management 11: 9–17.
Siegel, Jeremy J. 2005. The Future for Investors, Why the Tried and the True Triumph over the Bold and the New. New York: Crown Business.
Stattman, Dennis. 1980. “Book Values and Stock Returns.” The Chicago MBA: A Journal of Selected Papers 4: 25–45.
Taylor, Alex P., and Michael J. Brennan. 2010. “Predicting the Market Using Information from Equity Portfolio Returns.” Social Science Research Network: http://ssrn.com/abstract=1786531.
Tweedy, Browne Company LLC Worldwide High Dividend Yield Value Fund. 2012. “The High Dividend Yield Return Advantage: An Examination of Empirical Data Associating Investment in High Dividend Yield Securities with Attractive Returns over Long Measurement Periods.” http://w.tweedy.com/resources/library_docs/papers/TheHighDivAdvantageStudyFUNDweb.pdf.