Journal of Financial Planning: July 2013
Executive Summary
- Imprecise estimates are one source of gaps between optimized mean-variance portfolios and portfolios that investors prefer. Investor preferences beyond high mean and low variance is the other source. Both sources of gaps call for investor judgment.
- Harry Markowitz, who introduced mean-variance portfolio theory and its optimizer, noted that judgment plays an essential role in the proper application of mean-variance analysis.
- The charade of the efficient frontier involves “massaging” the estimates of the mean-variance parameters until they yield the efficient frontier and portfolios we prefer.
- This paper offers the “efficient range,” the location of portfolios that acknowledge imprecise estimates of mean-variance parameters and accommodate investor preferences beyond high mean and low variance, as a replacement for the “efficient frontier.”
Meir Statman, Ph.D., is the Glenn Klimek Professor of Finance at Santa Clara University in Santa Clara, California, and visiting professor at Tilburg University in the Netherlands. He is the author of What Investors Really Want: Know What Drives Investor Behavior and Make Better Financial Decisions. (mstatman@scu.edu)
Joni L. Clark, CFP®, CFA, is chief investment officer at Loring Ward in San Jose, California, where she directs investment policy and portfolio management strategies and chairs the company’s investment committee. She has advised clients on all aspects of investment strategy and portfolio risk management for nearly 25 years. (jclark@loringward.com)
Acknowledgements: The authors thank Harry Markowitz for his comments but remain solely responsible for opinions and errors. The authors thank Christine Lubienieck and Alicia Temmerman for excellent research help.
The usual application of the mean-variance optimizer is a charade, “an absurd pretense intended to create a pleasant or respectable appearance,” according to OxfordDictionaries.com. Charades are fun, but they are not funny when we are blind to their pretense.
Here is how the charade is played within the context of portfolio theory. We assemble estimates of parameters for the mean-variance optimizer: expected returns, standard deviations, and correlations. We assemble the estimates from historical returns or from seemingly sophisticated methods, such as those invoking Bayes theorem or “resampling.” We place the estimated parameters in the mean-variance optimizer and give it a spin. Out comes an efficient frontier with portfolios such as the one with 70 percent in European stocks and 30 percent in gold. We find this portfolio unappealing, so we push down the estimated return of European stocks or add a constraint that limits European stocks to 10 percent of portfolios. We give the optimizer another spin and get another efficient frontier. We continue spinning until we get an efficient frontier with portfolios that really appeal to us, the ones we wanted all along. The result is that we can now pretend that we have found them on the “scientific” efficient frontier.
It is time to end the charade. Indeed, Harry Markowitz who introduced mean-variance portfolio theory and its optimizer noted in Markowitz (2010) that judgment plays an essential role in the proper application of mean-variance analysis. Estimates of mean-variance parameters involve judgment. Even a purely historical approach to estimation involves judgment in the choice of the estimation period, whether the most recent decade or the last four decades, whether derived from monthly returns or from annual returns. Moreover, the preferences of normal investors extend beyond high expected returns and low variances. Some investors prefer to be true to their values, choosing socially responsible funds even if their expected returns are low. Other investors prefer the prestige of hedge funds, choosing them even if their expected returns are lower than advertised and their variances much higher.
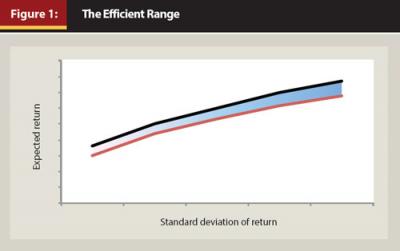
We offer the “efficient range,” depicted in Figure 1, as a replacement for the “efficient frontier.” The efficient range is the location of portfolios that acknowledge imprecise estimates of mean-variance parameters and accommodate investor preferences beyond high mean and low variance.
Imprecise Estimates
Imprecise estimates are one source of gaps between optimized mean-variance portfolios and portfolios that investors prefer. Michaud (1989, 33) argued that mean-variance optimizers are, in effect, “estimation-error maximizers,” allocating too much to assets that, because of imprecise estimates, show high returns, low standard deviations, or low correlations with other assets.
Green and Hollifield (1992), however, found that the extreme allocations in optimized mean-variance portfolios are, in fact, inherent in mean-variance efficient portfolios constructed with precise estimates. Sensitivity of allocations to small changes in precise mean-variance parameters is also inherent in mean-variance optimization. Therefore, increasing the precision of estimates would not make mean-variance efficient portfolios more appealing to investors. Green and Hollifield recommended that investors abandon their notions of appealing portfolios and accept optimized mean-variance efficient portfolios, even if unappealing, as their best portfolios. Investors, however, have rejected that recommendation in the past and will likely reject it in the future.
Fisher and Statman (1997) illustrated the extreme sensitivity of optimized mean-variance portfolios to small variations in the estimates of parameters by comparing optimized mean-variance portfolios in which parameters were estimated from monthly returns to optimized portfolios in which parameters were estimated from annual returns. Differences in estimates of parameters were small. For example, the correlation between the returns of U.S. stocks and European ones was 0.65 when estimated from monthly returns and 0.62 when estimated from annual returns. But differences in optimal allocations were very large. For example, setting the standard deviation of the portfolio to
20 percent, the optimal allocation to U.S. stocks was 24 percent when parameters were estimated from monthly returns and 101 percent when estimated from annual returns.
It is widely known that allocations in mean-variance optimized portfolios are sensitive to small changes in the estimates of parameters, and we know that we can never find the precise parameters. Therefore, we can never find the true mean-variance efficient frontier. But we can find an efficient range based on a range of estimates of the mean-variance parameters.
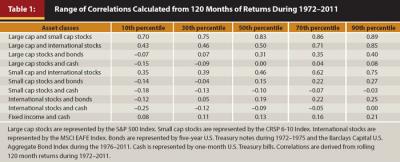
Consider a range of estimates of the correlation between the returns of two assets, derived from rolling 120-month correlations during 1972–2011. We can specify an acceptable range from the 30th percentile to the 70th percentile or from the 10th percentile to the 90th percentile.
The 10th percentile estimate of the correlation between large cap stocks and small cap stocks, presented in Table 1, is 0.70, increasing to 0.75 at the 30th percentile, 0.83 at the median, 0.86 at the 70th percentile, and 0.89 at the 90th percentile. In this study, we calculated similar ranges of correlations of the other pairs of assets, such as bonds and cash. As noted earlier, judgment plays an essential role in the proper application of mean-variance analysis. We choose ranges from the 10th to the 90th percentile, accepting that others might choose different ranges, perhaps from the 30th percentile to the 70th percentile or from the 5th percentile to the 95th percentile.
What is the optimal mean-variance portfolio in which we estimate correlations by their 10th percentile, and set the standard deviation of the portfolio not to exceed 12 percent? We set estimates of means and variances to equal their annual means during 1972–2011.
The mean-variance-efficient portfolio consists of a 4 percent allocation to large cap stocks, 29 percent to small cap stocks, 19 percent to international stocks, 174 percent to bonds, and a short 126 percent allocation to cash. The expected return of this portfolio is 13.4 percent. The corresponding mean-variance efficient portfolio in which we estimate correlations by their 90th percentile consists of a short 59 percent allocation to large cap stocks, 55 percent to small cap stocks, 14 percent to international stocks, 183 percent to bonds, and a short 92 percent to cash. The expected return of this portfolio is 12.1 percent. We consider both portfolios as residing within the efficient range. The efficient range would be wider if we were to choose a range from the 5th percentile to the 95th percentile. It would be narrower if we were to choose a range from the 30th percentile to the 70th percentile.
Kritzman (2011, 4) noted that portfolio allocations are sensitive to variations in estimates of the mean-variance parameters but argued that such sensitivity is not a serious problem because “the return distributions of the correct and incorrect portfolios will likely be very similar.” We agree. The range of expected returns in portfolios with a standard deviation of 12 percent is rather narrow, from 13.4 percent when we apply correlations at the 10th percentile to 12.1 percent when we apply correlations at the 90th percentile, despite much wider ranges of asset allocations within these portfolios.
Financial services companies, such as Schwab, Vanguard, and Fidelity, offer model portfolios. They likely rely on their perceptions of investor preferences rather than on mean-variance optimization as they construct their portfolios. Model portfolios are remarkably similar. For example, the “moderately conservative” model portfolio by Schwab allocates 40 percent to stocks and 60 percent to bonds and cash, equal to the allocations in the “balanced” Vanguard portfolio. The Fidelity “balanced” portfolio is not much different, 50 percent to stocks and 50 percent to bonds and cash. The ratio of international stocks to U.S. stocks in Schwab portfolios is approximately one to three, similar to the ratio in Fidelity portfolios.¹
Consider the Schwab “moderate portfolio” presented in Table 2 consisting of a total of 60 percent in stocks and 40 percent in bonds and cash. Among stocks, 15 percent is allocated to international stocks, 35 percent to large-cap stocks, and 10 percent to small-cap stocks. The expected return of the Schwab moderate portfolio is 10.34 percent, based on mean-variance parameters estimated from annual returns during the years 1972–2011. The standard deviation of the portfolio is 11.73 percent. The optimized mean-variance portfolio analogous to the Schwab moderate portfolio is the portfolio with the highest expected return, but a standard deviation that does not exceed 11.73 percent. The expected return of this optimized mean-variance portfolio is 11.00 percent, not much higher than the 10.34 percent return of the Schwab moderate portfolio, but the allocations in the optimized portfolio are very different from those of the Schwab moderate portfolio.
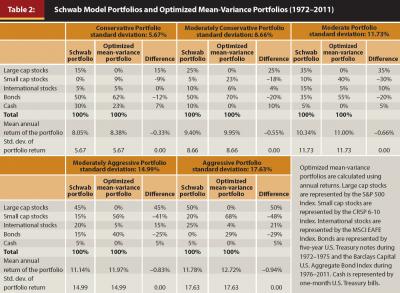
Differences are especially striking when it is noted that allocations in the optimized portfolio are already constrained to exclude short positions. For example, the allocation to large cap stocks in the optimized portfolio is zero, whereas the allocation to large cap stocks in the Schwab moderate portfolio is 35 percent, and the allocation to small cap stocks in the optimized portfolio is 40 percent, whereas the allocation to small cap stocks in the Schwab moderate portfolios is 10 percent.
Investor Goals and Preferences
Markowitz’s mean-variance portfolio theory is a “production” theory. Investors using the theory produce portfolios that combine expected returns and standard deviations of returns at levels that are optimal for them. Mean-variance portfolio theory is not a “consumption” theory as it is silent about investors’ consumption goals, such as a secure and comfortable retirement, college education for children and grandchildren, and bequests to family and charities. Ultimately, however, investors care about their consumption goals, and portfolios are merely production means for reaching consumption goals. Shefrin and Statman (2000) presented behavioral portfolio theory that combines production and consumption. Investors begin by setting their consumption goals and build portfolios best suited to reach their goals.
Mental-accounting portfolio theory is a goal-based theory, developed by Das, Markowitz, Scheid, and Statman (2010, 2011), that links production and consumption. The theory combines production and consumption, built on the joint foundation of mean-variance portfolio theory and behavioral portfolio theory and combining some of their most appealing features.
Investors care mostly about reaching their life goals, but they also have preferences beyond life goals. Some investors are socially responsible, preferring to invest only in stocks of companies with good employee relations or good environmental records. A 2012 survey by the Spectrem Group—the findings of which were reported June 14, 2012, by Retirement Income Journal (www.retirementincomejournal.com)—revealed that 37 percent of investors with net worth of $1 million to $5 million consider social responsibility when they invest. But preference for socially responsible companies varies by investor age. Whereas 50 percent of investors younger than 45 prefer investments in socially responsible companies, only 31 percent of those older than 65 have such preference.
Investors’ preferences for socially responsible companies might place their portfolios below optimized mean-variance efficient frontiers. Geczy, Stambaugh, and Levin (2005) compared optimized mean-variance portfolios constrained to include only socially responsible mutual funds to unconstrained optimized mean-variance portfolios of all mutual funds. They found that the expected returns of portfolios constrained to include only socially responsible mutual funds fall below the optimized mean-variance efficient frontier by more than 3 percentage points each year, under the assumption that expected returns are determined by the four-factor asset pricing model.
We characterize portfolios constrained to include only socially responsible mutual funds as portfolios within the efficient range, even if not on the optimized mean-variance efficient frontier. This is because such portfolios conform to the preferences of socially conscious investors. Indeed, in the eyes of socially responsible investors, portfolios constrained to include only socially responsible mutual funds are superior to unconstrained portfolios, even if such constrained portfolios fall below the optimized mean-variance efficient frontier.
Preferences can be genuine or mere reflections of cognitive errors and misleading emotions. Preferences for socially responsible investing are likely genuine but preferences for international investments or against them might be mere reflections of cognitive errors and misleading emotions. The late 1990s were not only the time of the great bubble but also the time of a great divergence between the returns of U.S. stocks and international stocks. For example, the cumulative return of the S&P 500 Index of U.S. stocks exceeded 151 percent during the five years ending in December 1997, but the cumulative return of the EAFE Index of international stocks was short of 71 percent. Investors who divided their stocks equally between U.S. and international stocks were regretful, even angry, as they contemplated their portfolios in hindsight, even though such allocation was reasonable when viewed in foresight, consistent with the relative market values of U.S. and international stocks in a global portfolio. Lowenstein (1997) amplified investors’ regret and anger in a Wall Street Journal article titled “97 Moral: Drop Global-Investing Bunk.” He taunted proponents of global diversification as people who believe that “the ‘sound’ investor is defined as one who has moved a goodly chunk of his money out of the society he knows to countries with which he is unfamiliar, each according to their market weights.”
Many investors were misled to abandon global diversification in the late 1990s by the cognitive errors of representativeness and hindsight and by the emotions of regret and anger. Representativeness errors led them to extrapolate past returns and conclude that future returns of international stocks would continue to trail those of U.S. stocks. Hindsight errors misled them into thinking that the relatively poor performance of international stocks was as clear in foresight as in hindsight. Regret compounded hindsight, inflicting frustration for not having switched from international stocks to U.S. stocks years before. And anger urged them to act in haste, dumping international stocks.
Still, some investors have a genuine preference for U.S. stocks over international stocks, whereas other investors have a sincere preference for international stocks over U.S. stocks. Investor questionnaires can educate investors about investments, guide them to resist the pull of cognitive errors and misleading emotions, and elicit their genuine preferences. Consider the portion in the questionnaire by Loring Ward that is centered on education and elicitation of preferences.
Within the Loring Ward firm’s questionnaire, first comes education about global diversification: “International investing can help increase your portfolio’s diversification as it enables you to spread risk across a variety of economies and financial markets. International investments include developed markets, such as France and Germany, with well-established companies and listing standards similar to the U.S., and also include more speculative emerging markets in countries with rapid but volatile economic growth.”
Next comes elicitation of preferences:
- “Which statement best reflects your view on international investing?”
- I am very comfortable with international investments.
- I am comfortable with international investments.
- I am somewhat comfortable with international investments.
- I am somewhat uneasy with international investments.
- I am uneasy with international investments.
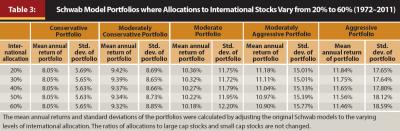
Investors can choose to allocate to international stocks as little as 20 percent of their equity allocation or as much as 60 percent. Advisers then take investor preferences into account when they guide them into portfolios. Portfolios with relatively high allocations to international stocks will yield relatively high returns at times and relatively low returns at others, but each portfolio meets the preference of particular investors, and provides similar combinations of expected returns and risk. All the portfolios lie within the efficient range, as illustrated in Table 3.
Conclusion
Gaps between optimized portfolios produced by mean-variance optimizers and portfolios that investors prefer come from two sources. One is imprecise estimates of mean-variance parameters. The other is investor preferences beyond high expected returns and low risk. We offer the mean-variance “efficient range” as the location of all mean-variance efficient portfolios that acknowledge imprecise estimates and accommodate investor preferences.
But how wide is the efficient range, one might ask? Won’t the efficient range be wider if we accept ranges from the 5th percentile to the 95th percentile of the distribution of mean-variance parameters than if we accept ranges only from the 10th percentile to the 90th percentile? Won’t the efficient range be wider if we accept preferences ranging between a zero allocation to international stocks and a 100 percent allocation than if we accept preferences ranging only between 20 percent and 60 percent?
The answer is that financial advisers must use their judgment in setting reasonable ranges and reasonable boundaries for the efficient range, recalling that judgment is inherent in mean-variance portfolio optimization. The answer might not appeal to those who insist on finding the true mean-variance efficient frontier and are willing to pretend that they can find it. We, however, find such pretension unreasonable.
Practical Applications for Planners
Advisers share a guilty feeling. They are eager to note that asset allocation matters most in investment success, and that they derive their asset allocation from the mean-variance portfolio optimizer of Nobel Prize winning modern portfolio theory. Yet advisers find asset allocation in optimized portfolios unappealing. They modify optimized portfolios by constraints, whether maximum constraints on commodities or minimum constraints on bonds. But they often feel guilty for straying from modern portfolio theory.
We argue that advisers’ guilt is misplaced. Harry Markowitz, the father of modern portfolio theory, noted that optimized portfolios should reflect the preferences of investors, beyond mean and variance, whether a preference for socially responsible funds or the preference against international funds.
Endnote
- Schwab model portfolios (accessed 04/27/13).
References
Das, Sanjiv, Harry Markowitz, Jonathan Scheid, and Meir Statman. 2011. “Portfolios for Investors Who Want to Reach Their Goals While Staying on the Mean–Variance Efficient Frontier.” Journal of Wealth Management 14 (2): 25–31.
Das, Sanjiv, Harry Markowitz, Jonathan Scheid, and Meir Statman. 2010. “Portfolio Optimization with Mental Accounts.” Journal of Financial and Quantitative Analysis 45 (2): 311–334.
Fisher, Kenneth, and Meir Statman. 1997. “The Mean-Variance Optimization Puzzle: Securities Portfolios and Food Portfolios.” Financial Analysts Journal 53 (4): 41–50.
Geczy, Christopher, Robert Stambaugh, and David Levin. 2005. “Investing in Socially Responsible Mutual Funds.” Working Paper, Wharton. Available at SSRN 416380. http://papers.ssrn.com/sol3/papers.cfm?abstract_id=416380.
Green, Richard, and Burton Hollifield. 1992. “When Will Mean-Variance Efficient Portfolios Be Well Diversified?” Journal of Finance 47 (5): 1785–1810.
Kritzman, Mark. 2011. “The Graceful Aging of Mean-Variance Optimization.” Journal of Portfolio Management 37 (2): 3–5.
Lowenstein, Roger. 1997. “97 Moral: Drop Global-Investing Bunk.” Wall Street Journal (December 18): C1.
Markowitz, Harry. 2010. “Portfolio Theory: As I Still See It.” Annual Review of Financial Economics 2 (1): 1–23.
Michaud, Richard O. 1989. “The Markowitz Optimization Enigma: Is ‘Optimized’ Optimal?” Financial Analysts Journal 45 (1): 31–42.
Shefrin, Hersh, and Meir Statman. 2000. “Behavioral Portfolio Theory.” Journal of Financial and Quantitative Analysis 35 (2): 127–151.
Citation
Statman, Meir, and Joni L. Clark. 2013. “End the Charade: Replacing the Efficient Frontier with the Efficient Range.” Journal of Financial Planning 27 (7): 42–47.