Journal of Financial Planning: June 2018
C. Edward Chang, Ph.D., is a professor of finance in the College of Business at Missouri State University. His current research interests include performance measurement of investment vehicles. His recent articles have been published in the Journal of Wealth Management, Journal of Investment Management, Journal of Investing, American Journal of Business, and Journal of Financial Planning.
Thomas M. Krueger, DBA, is the J.R. Manning Endowed Professor of Innovation in Business Education in the College of Business Administration at Texas A&M University–Kingsville. He chairs the Department of Accounting and Finance and is a member of the Texas Board of Higher Education–Graduate Education Advisory Council. His current research interests focus on financial market efficiency and academic accreditation standards. His published research has appeared in the Journal of Finance, Journal of Investing, and Journal of Financial Planning.
Executive Summary
- This study reports the results of an analysis of the key issues facing investors in the popular age-based 529 portfolios, namely equity allocation and cost containment.
- Most 529 plans provide a set of portfolios that range from a high equity allocation to a high debt allocation, mirroring expected changes in investor preference as college draws near. Many of these age-based portfolios have a predetermined orientation to equity, such as “high equity” (sometimes referred to as “aggressive”) versus “low equity” (frequently referred to as “moderately conservative”).
- This research shows that there is enough similarity among these styles to eliminate almost all importance related to the style-based selection. Nonetheless, selection of low-expense and no-load funds significantly increases terminal portfolio value.
- This study used an empirical approach to identify the impact of fees on money available to pay for college.
- Financial planners should carefully focus on mutual fund charges when choosing among 529 portfolios, while not being overly concerned about the portfolio’s equity concentration.
When saving for the college education of children and grandchildren, one needs the discipline to start early, contribute often, and monitor the gap between anticipated needs and predicted terminal value. Making the situation more complicated, this investment is often done during a period when one is contributing to a retirement fund and experiencing ongoing budgetary needs as children grow and mature. Setting money aside for the future takes place against the backdrop of the typical needs for more expensive clothing, braces, pets, band instruments, and the list could go on and on.
Fortunately, the federal government has responded with a variety of college savings options. One of the most popular of these is the Section 529 plan, which is named after the portion of the U.S. tax code that authorized these plans. Federal tax savings, state tax savings (in some states, and typically only for in-state plans), estate planning benefits, high contribution limits, and no income limitations are among the 529 plan advantages. However, withdrawals must be used for qualified educational expenses, or they will be subject to a 10 percent penalty.
Once the decision has been made to invest in a 529 plan, investors select among thousands of portfolios offered by myriad plans. Some of these can be eliminated quickly because they service residents in another state or are designed for children in different age brackets. Thereafter, three key decisions remain: (1) select an age-based portfolio or a static portfolio; (2) assuming an age-based portfolio, select one that has a “high equity,” “medium equity,” or “low equity” concentration over time; and (3) regardless of equity allocation, select a high-cost or low-cost 529 portfolio, where selection of the former is based upon the belief that paying higher fees results in better performance.
Investors who prefer a hands-off, “set it and forget it” management style would find age-based 529 funds appealing, according to Stalter (2014), who viewed static options as being more appropriate choices for people with more investing experience and a greater understanding of financial markets. Her article concluded with a generalized comment that regardless of which option investors choose, they should carefully analyze fees and expenses because these factors can make a big difference in the returns. In this study, an empirical approach was taken to identify the actual impact of fees on money available to pay for college.
This study assumed the investor decided to purchase an age-based 529 portfolio to take advantage of the pre-arranged, automatically increasing debt allocation, thereby reducing investment risk as the beneficiary gets ready to go to college. The findings section has two components. In the first component, it is shown that there was relatively little difference in the performance of 529 portfolios with “high equity,” “medium equity,” or “low equity” concentrations. The second component documents the importance of minimizing annual expenses and load fees.
Literature Review
529 plans. Much of the existing 529 plan literature has focused on their relative importance and how to market these offerings. Opiela (2001) initially urged parents to focus on their retirement so that they do not become burdens on their children. This stance was later replaced with discussions of how to compare 529 plan options (i.e., in-state versus out-of-state, funds needed to open account, and reallocation). Regarding reallocation, Opiela (2003) proposed that grandparents start off with a guaranteed account and then move a portion of the funds to a risky portfolio on an annual basis so that some funds are always available for college expenses. However, this strategy runs contrary to the increasing debt allocation found in most 529 glide paths. Instead of examining 529 portfolios, Eighme (2006) provided Morningstar ratings of the asset components found in Connecticut’s age-based plans.
When selecting the optimal portfolio, Mladina (2011) urged readers to consider expenses, taxes, and inflation. Although the focus was on expenses, the selection of tax-advantaged 529 funds and employment of performance measures (which indirectly consider inflation to the extent the risk-free rate is sensitive to the contemporaneous inflation rate), implicitly addressed the other considerations in ending up with what Mladina referred to as “triple net returns.”
Alexander, Luna, and Gill (2015) found that the provision of more plan information resulted in investors choosing fewer 529 portfolios and making selections based on past performance. These authors computed alpha statistics and found negative values.
Mutual funds. A concise yet broad listing of studies showing the ability of mutual funds to outperform market surrogates in general was provided in Berk and van Binsbergen (2015). Daniel, Grinblatt, Titman, and Wermers (1997) found some evidence of superior stock selection among mutual funds, while Kacperczyk, Van Nieuwerburgh, and Veldkamp (2014) documented an ability of mutual fund managers to shift funds away from equities at the onset of recessionary markets and select stocks during expansions. Meanwhile, Krueger and Chang (2013) disclosed Consumer Reports’ success in selecting mutual funds.
Two widely disseminated studies, Kosowski, Timmermann, Wermers, and White (2006) and Fama and French (2010), used alpha to measure investment performance and reached opposite conclusions regarding the level of fund manager selection prowess. Jeon, Kang, and Lee (2017) also employed alpha to demonstrate that the greater the precision in the performance measures, the more willing investors were to invest in a particular fund.
One way to compare fund performance is through the Morningstar RatingTM (often called the “star rating”), which measures fund performance from a one- to five-star rating. A study initially published by Morningstar (Kinnel 2010) and expounded on by The Wall Street Journal (Kim 2010) concluded that picking mutual funds based on expenses was more likely to achieve superior investment performance than picking funds based upon Morningstar star ratings.
Bogan (2014) studied the relationship between 529 benefits and fees charged and found that fees charged on 529 plan accounts were typically above that of the mutual fund industry but less than the tax-savings benefits of 529 plans.
When it comes to loads, Morey (2003) found that performance of no-load funds was statistically better than load funds at the 1 percent level. Huesler, Malevergne, and Sornette (2014) showed that investor perception of manager skills played a significant role in load-setting behavior, documenting that many mutual funds increased loads by as much as 1.5 percent during the bullish 2003 to 2007 period. Khorana and Servaes (2012) reported a positive relationship between fund family load fees and market share, which suggests that investors respond to advertising afforded by load-related revenues.
Target date funds. Perhaps the closest cousin to the 529 fund in the mutual fund world is the target date fund. Both are used to save for an actuarially well-known future financial need frequently using a glide path. Spitzer and Singh (2011) found that target date funds did not outperform mutual funds with the same style during the accumulation phase. Nonetheless, Berk and van Binsbergen (2015) revealed that investors were willing to pay to have historically successful managers direct the investment of their funds. Similarly, Johnson and Kanuri (2018) attempted to address the apparent paradox of target-date mutual fund underperformance and popularity. Finally, Chang, Krueger, and Wrolstad (2017) provided evidence that to eliminate losses, it was financially advantageous to avoid funds charging loads.
Data and Research Methods
This study explored the role that equity concentration and cost play in achieving the goals of those saving for their children’s education with these specialized 529 vehicles. This research studied a period twice as long and more recent than that of Bogan (2014) and Alexander, Luna, and Gill (2015). A wider range of risk, return, and risk-adjusted return measures were used to compare high-fee to low-fee 529 portfolios and to investigate loads. In this study, “529 portfolios” refer to specific investment options within 529 plans and are what investors actually select.
Given its widespread use by financial planners and investors, this study relied on Morningstar for the proper categorization of portfolios. The 2013 “Morningstar CategoryTM Classifications for 529 Investment Options”1 was used to identify performance within every age/equity category. At least one portfolio was necessary for Morningstar category inclusion. Data, including all portfolio-level risk and return measures, were collected using Morningstar’s Advisor Workstation 2.0 for consistency and comparability purposes.
Data. As of December 2016, there were 1,712 age-based 529 portfolios. Information on the distribution of these portfolios across Morningstar categories is presented in Table 1, where a distinct shift toward less risk is evident. The 19-plus age category had no high-equity portfolios with 10 years in existence. In every age category, the medium-equity portfolios outnumbered the high-equity portfolios and low-equity portfolios combined. By comparing the performance of funds that have survived for 10 years without regard for whether they have high or low expense ratios (and with and without loads), a survivorship bias exists for all funds and is therefore not likely to be a direct contributor to the differences observed in this study.
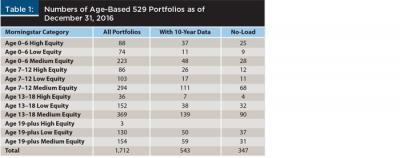
By employing a 10-year investment horizon, the sample period included a variety of market conditions and limited the likelihood that 529 portfolio performance was not a function of any short-term phenomena. The third column of Table 1 identifies the number of age-based 529 portfolios with at least 10 years of data. In total, 543 portfolios, or 32 percent, had 10 years of data. There was a wide range in average portfolio age across categories. More than 40 percent of the portfolios had 10 years of data in the Age 0–6 High Equity (i.e., 37/88 = 42 percent) category. At the other extreme, only 14 percent of Age 0–6 Low Equity portfolios had 10 years of data. No-load funds accounted for 64 percent of the funds with 10 years of data.
Morningstar definition of equity levels. As college draws closer, the risk of being unable to recover from a stock market decline rises. As a result, Morningstar uses a shifting scale to designate what is considered a “high,” “medium,” and “low” equity position as college becomes progressively closer.
Table 2 documents how Morningstar incorporates an increasing level of risk aversion into its equity classification age-based 529 portfolios. In addition to the three six-year age brackets (i.e., 0–6, 7–12, and 13–18), a catch-all bracket (age 19-plus) is included for 529 portfolios servicing beneficiaries in college. As shown in Table 2, when the beneficiary is age 6, “low equity” would be any 529 portfolio with less than 61 percent in the stock market. However, upon turning age 13, the “low equity” metric is applied only to 529 portfolios with less than 21 percent of their concentration in equities.

Analytical model. Standard investment risk and performance measures were employed, including annual average return, total risk-based measures (standard deviation, Sharpe ratio, and Sortino ratio), and market risk-based measures (beta, Treynor ratio, and Jensen’s alpha). The Sharpe ratio considers return in excess of the risk-free rate relative to excess return standard deviation. The Sortino ratio is typically higher than the Sharpe ratio, because it divides return in excess of the risk-free rate by the downside portion of total risk. If returns are not normally distributed, the Sharpe and Sortino ratios can be a different ranking of investments. The 2013 “Morningstar CategoryTM Classifications for 529 Investment Options” provides an objective means to compare portfolios based on chosen assets.
Age-based 529 portfolios are likely to be only a portion of an investors’ investment portfolio. Hence, the correlation of 529 portfolio returns with the market and related risk-adjusted return measurements is relevant. The first step is the measurement of systematic risk, followed by the division of returns in excess of the Treasury rate by beta, which is referred to as the Treynor ratio. Jensen’s alpha estimates return in excess of the market return after adjusting for both beta and the risk-free rate.
The t-test is any statistical hypothesis experiment in which the test statistic follows a student’s t-distribution under the null hypothesis of a normally distributed population. The statistical testing method applied here was a paired t-test for difference in investment performance metrics between one group of 529 portfolios (for example, lower expense ratio or no-load), and another group of 529 portfolios (for example, higher expense ratio and load) in the same category. With the noise from random variation in averages within categories eliminated, the paired t-test can better detect differences in averages between portfolio groups and is more powerful than an otherwise similar unpaired t-test. The null hypothesis in all tests is an equality of means, with the alternative hypothesis being an inequality of means. Standard pairwise t-test statistics were computed using Excel and were employed to assess the statistical significance of the differences in these means.
Findings
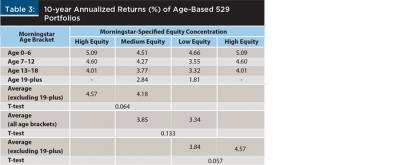
Impact of equity composition on 529 portfolio performance. Average returns of age-based 529 portfolios that were in existence during the January 1, 2007 to December 31, 2016 period for each of four Morningstar-designated age brackets are given in Table 3. For comparison purposes, the Standard & Poor’s 500 annualized yield was 4.64 percent over this decade.2 Add in the average annual dividend yield of 2.13 percent,3 and the average annual return on stock was 6.77 percent.
Although historically low, the yield on corporate bonds during this decade was 5.39 percent,4 resulting in an equity risk premium of 1.38 percent. Although the yield difference was smaller than the 4.3 percent observed for U.S. securities by Dimson, Marsh, and Staunton (2003), Arnott and Ryan (2001) concluded that the equity risk premium was imaginary. At a minimum, it can be concluded that during the sample period in this study, equities outperformed debt by a comfortable margin, making the selection of 529 portfolios with high equity concentrations a viable investment option.
Annual net-of-expense returns ranged from 5.09 percent for the Age 0–6 High Equity category to 1.81 percent for the Age 19-plus Low Equity category. There were no 529 portfolios in the Age 19-plus High Equity category with 10 years of data. This absence is the reason that two averages are given in the Medium Equity and Low Equity columns; one is used for a four-category comparison against each other, and one for the three-category comparison against the High Equity categories. The information found in Table 3 regarding inclusion of the Age 19-plus category (i.e., “excluding 19-plus”) applied in all subsequent tables, but was left out of subsequent tables for ease of reading.
During the first 18 years, the average annualized returns were 4.57 percent for the high equity 529 portfolios, 3.85 percent for medium equity 529 portfolios, and 3.34 percent for the low equity 529 portfolios. When the Age 19-plus age category was excluded from consideration, the medium equity return increased to 4.18 percent, while the low equity 529 portfolios’ mean return increased to 3.84 percent. None of the differences were statistically significant at the 0.05 level.
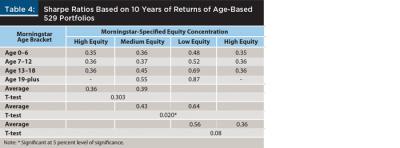
Sharpe ratios are exhibited in Table 4 to see whether there was a significant difference in risk-adjusted returns across the equity categories. The only significant difference observed was the Sharpe ratios of the four-category medium equity value of 0.43 and the low equity value of 0.64. Much of the difference was related to a Sharpe value of 0.87 among low equity portfolios for age 19-plus beneficiaries who were already in college and had limited opportunity to benefit from an advancing market.
Impact of costs on 529 portfolios charges. Expense ratios averaged 0.85 percent, with a range of 0.52 percent for the Age 13–18 Low Equity category to 1.14 percent for the Age 7–12 High Equity category. The typical high-equity 529 portfolio had an annual expense ratio of 1.03 percent, while the medium-equity 529 portfolio had an annual expense ratio of 0.95 percent, and the low-equity 529 portfolio had an annual expense ratio of 0.60 percent. Information on individual age categories is presented in Appendix A, which includes information regarding the components of these fees. Specific information is presented, because investors may have limited options based on beneficiary age or personal risk aversion. In all but one instance the highest charges arose from what is known as the “acquired expense ratio,” or fees assessed by the money manager.
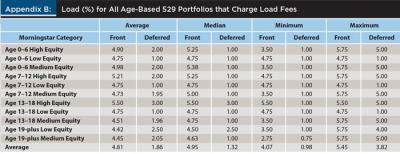
The average front load fee among age-based 529 portfolios charging a load was 4.81 percent. In instances where a deferred load was charged, the average deferred load fee was 1.86 percent. The highest average front load charge was 5.50 percent and was found in the Age 13–18 High Equity category. Such a finding is logical; there are fewer years over which to generate revenue from expenses.
Among 529 portfolios charging a load, the lowest average front load charge was 4.42 and was found in the Age 19-plus Low Equity category. As suggested by these values, there was less of a difference in load than expense ratios across 529 portfolio equity concentrations. In fact, the average front load for medium and low equity 529 portfolios was 4.67 percent, while load-charging high-equity funds had a 5.20 average. Information regarding load averages, medians, maximums, and minimums is presented in Appendix B.
Impact of charges on returns, total risk, and total risk-adjusted returns. Whether one is considering expense ratios or loads, there was a significant difference in the performance of low-cost and high-cost 529 portfolios.
As shown in the second data row of Table 5, all differences were significant at the 0.01 level. When there was a 50/50 percent split in each age/equity concentration category, 529 portfolios with the lower expense ratio earned an extra 1.04 percent (4.40 percent – 3.36 percent) annually over the coming year. This yield was higher than the average expense ratio of 0.85 percent, suggesting that high-expense 529 portfolio managers were unable to generate a return high enough to cover their annual charges. Comparing the lowest quartile of expense ratios to the highest quartile increased the difference to 1.69 percent (4.56 percent – 2.87 percent) or almost twice the average expense ratio.
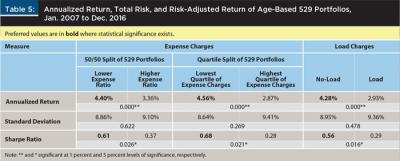
The gain over a 24-year period (e.g., four six-year periods) from investing $1,000 in the lowest quartile instead of the highest quartile of expense ratios was $762 ($1,000 (1.045624 – 1.028724)). This value equates to having 76.2 percent more for college expenses.
Avoiding loads increased annualized returns by 1.35 percent (4.28 percent – 2.93 percent). The gain over a 24-year period from investing $1,000 in no-load 529 portfolios instead of load 529 portfolios was $734 ($1,000 (1.042824 – 1.029324)). By contrast, risk was not statistically different. However, in each of the three pairs, the standard deviation was lower for the low-cost option. These results provide further evidence that investors can positively impact the likely outcome of money set aside for a beneficiary by avoiding portfolio expenses and loads.
Given the significantly different returns and the lower risk, all Sharpe ratio differences were significant. After adjusting for the Treasury yield, low expense-ratio 529 portfolios earned 61 percent of their standard deviation, while high-expense ratio 529 portfolios earned only 37 percent of their risk level. In the case of the 25/25 percent split, the Sharpe ratio of the lowest quarter of 529 portfolios was more than twice that of the 529 portfolios with the highest quartile of expenses. A similar level of relative significance existed for no-load versus load 529 portfolios. While this research was unable to provide any guidance relative to 529 portfolio equity concentrations, a case can be made for selecting the 529 portfolios charging low expenses and no loads.
Impact of charges on systematic risk and systematic risk-adjusted returns. Portfolio managers in the 529 portfolios analyzed here seek to maximize return, while encountering a glide path wherein a larger and larger portion of the portfolio is devoted to low-risk debt instruments. Therefore, one would not expect an expense- or load-related difference in systematic risk and that the systematic risk differences would be minimal. Both these hypotheses were borne out by the data, which is presented in the first set of rows in Table 6. Note that the low-cost option always had a lower systematic risk value.
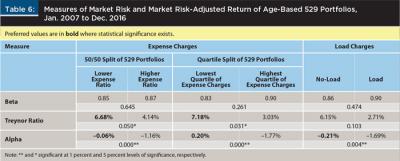
Given the significant annualized returns reported in Table 5 and the lack of systematic risk differences across 529 portfolios sorted by cost, it was not surprising that the Treynor ratios and alpha measures were generally significant. Both expense ratio comparisons were significant at the 0.05 level, with the Treynor ratio of the lowest quartile more than twice that of the highest quartile of expense ratios. The gain over a 24-year period from investing $1,000 in 529 portfolios in the lowest quartile of expense ratios instead of the highest quartile of expense ratios, per unit of systematic risk, was $3,234 ($1,000 (1.071824 – 1.030324)). Though statistically insignificant, the average Treynor ratio of the no-load funds was more than twice that of the load funds.
All differences in alpha measures were significant at the 0.01 level in Table 6. Note the value shown in the alpha value row’s lowest quartile column is positive 0.20 after adjusting for systematic risk and the risk-free rate, as proposed by Mladina (2011). The gain over a 24-year period from investing $1,000 in 529 portfolios in the lowest quartile of expense ratios instead of the highest quartile of expense ratios, per unit of systematic risk, was $398 ($1,000 (1.002024 – (1.0 – .0177)24)).
Although the other results were consistent with those of Alexander, Luna, and Gill (2015) who bemoaned the existence of negative alpha, the key point made in this study is that the alpha value can be significantly better if one avoids cost; those paying higher expense ratios and loads are not getting their money’s worth.
Impact of charges on Morningstar’s measures of relative performance. In one of the initial academic discussions of 529 portfolios, Eighme (2006) proposed the use of Morningstar’s ranking system to assess performance. With few observations over a short period, Eighme created a quasi-529 plan Morningstar measure based on components in 529 portfolios. More than a decade later, Morningstar ratings do exist for 529 portfolios. With this information, one can take a fresh look at how Morningstar’s metrics can be used to assess performance, with a focus on 529 portfolio costs. The key difference is that instead of sorting 529 portfolios by expenses and then determining whether high-cost funds do better or worse, through Morningstar it is possible to first sort funds by performance and then see whether those with funds in specific cost categories had higher comparative ratings using a metric that approximates a bell-shaped curve.
When only fees were used to differentiate 529 portfolios, a significant difference in the 529 portfolio’s relative performance was observed. As shown in the first row of Table 7, the performance of the low-cost group was always significantly better at the 0.01 level. Note also the low Morningstar ratings of the high-cost 529 portfolios. For instance, in the first row, the values for this group were 2.06, 1.54, and 1.72. Given that only 10 percent of mutual funds have a Morningstar return rating of 1.0, these low values suggest that many high-cost funds are in the worst 10 percent of mutual funds. Although risk ratings were not statistically different, the low-cost option had a preferable, lower rating, consistent with the standard deviation values found in Table 5 and the beta values found in Table 6.
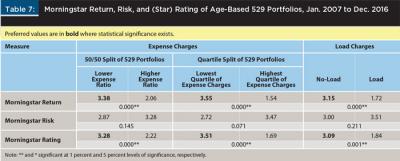
Given that Morningstar’s classification of 529 portfolios is being employed for fund classification on both age and equity concentration metrics, the Morningstar star ratings of 529 portfolios is especially relevant. As shown by the bottom line of Table 7, differences in performance were significant at the 0.01 level. This significance can be attributed to the “horrible” performance of the high-cost funds, because the low-cost portfolios’ average Morningstar rating was only slightly ahead of the three-star average. For example, although loads were charged before annualized returns began to accrue, the performance of load-bearing 529 portfolios earned less than two stars (1.84 stars); putting the typical 529 portfolios in the lower 32.5 percent (e.g., 10 percent plus 22.5 percent if two stars are earned) of fund choices.
Conclusion
One way to help the next generation with the increasing cost of education is the Section 529 college savings plan. Age-based 529 portfolios, which increase the debt allocation as a beneficiary approaches college, are a popular way to address the changing utility function (e.g., replacing a desire for returns with one of safety) over time. After setting aside money for these plans, investors confront a series of critical issues regarding 529 portfolio equity allocation and costs. Equity allocation is arguably important with 529 portfolios because there are a limited number of years before the child starts drawing on these funds—a situation in which one could argue for higher equity concentrations. However, there are also few years for a 529 portfolio to recover from a market decline. Investors have choices of high, medium, or low underlying equity concentrations at any beneficiary age.
This research revealed that the returns earned by 529 portfolios with varying equity classifications were not significantly different. One reason may be that the proportion of a portfolio that can be assigned to debt and still be considered a “high equity” concentration increases from 10 percent to 70 percent as beneficiaries get older. Another reason may be that the decade studied (2007 to 2016) was too short and had a smaller difference in total stock market returns and total bond market returns.
However, there was a consistent and significant difference in the return and risk-adjusted return of 529 portfolios when grouped based on management fees. Whether one considers annual expenses or load charges, investors would be significantly better off to avoid paying such fees. It appears age-based 529 portfolios charge what they can and not what their services are worth. Implications for financial planners are a logical extension of these findings, encouraging those using these tools to help clients fund their children’s education to place an emphasis on avoiding cost.
Future research could consider lengthening the horizon or choosing a time when the equity risk premium was closer to its historical 3 percent to 7 percent range. Further study can also consider how differences in tax deductions across states would affect the value of age-based 529 portfolios. Differences across economic conditions may be insightful, as would a comparison of age-based 529 portfolios with static 529 portfolios. Although the 2017 Tax Cuts and Jobs Act left 529 rules applicable to higher education largely untouched, any ramifications of the legislation may also be considered in greater detail. Insights provided by these studies would help investors make wise decisions as they attempt to help the next generation.
Endnotes
- See “The Morningstar CategoryTM Classifications for 529 Investment Options (for 529 Portfolios for Sale in the United States)” published October 31, 2013 at ibbotson.com/us/documents/MethodologyDocuments/MethodologyPapers/Morningstar_Category_Classifications_for_529_Investment_Options.pdf.
- See the stock price indices page at economagic.com.
- See the S&P 500 dividend yield by year at multpl.com/s-p-500-dividend-yield/table.
- See the ICE BofAML U.S. Corporate Master Index value at fred.stlouisfed.org/series/BAMLCC0A0CMTRIV.
References
Alexander, Raquel M., LeAnn Luna, and Steven L. Gill. 2015. “Does College Savings Plan Performance Matter?” In Advances in Taxation (John Hasseldine, ed.) Bingley, U.K.: Emerald Group Publishing Limited.
Arnott, Robert D., and Ronald J. Ryan. 2001. “The Death of the Risk Premium.” Journal of Portfolio Management 27 (3): 61–74.
Berk, Jonathan B., and Jules H. van Binsbergen. 2015. “Measuring Skill in the Mutual Fund Industry.” Journal of Financial Economics 118 (1): 1–20.
Bogan, Vicki L. 2014. “Savings Incentives and Investment Management Fees: A Study of the 529 College Savings Plan Market.” Contemporary Economic Policy 32 (4): 826–842.
Chang, C. Edward, Thomas M. Krueger, and Mark A. Wrolstad. 2017. “The Impact of Costs on Target Date Fund Performance.” Journal of Investment Management 15 (4): 1–16.
Daniel, Kent, Mark Grinblatt, Sheridan Titman, and Russ Wermers. 1997. “Measuring Mutual Fund Performance with Characteristic-Based Benchmarks.” Journal of Finance 52 (3): 1,035–1,058.
Dimson, Elroy, Paul Marsh, and Mike Staunton. 2003. “Global Evidence on the Equity Risk Premium.” Journal of Applied Corporate Finance 15 (4): 27–38.
Eighme, Jan E. 2006. “Rating the 529 College Savings Plans.” Journal of Accountancy 202 (3): 45–48
.
Fama, Eugene F., and French, Kenneth R. 2010. “Luck Versus Skill in the Cross-Section of Mutual Fund Returns.” Journal of Finance 65 (5): 1,915–1,947.
Huesler, Andreas, Yannick Malevergne, and Didier Sornette. 2014. “Investors’ Expectations, Management Fees, and the Underperformance of Mutual Funds.” International Journal of Portfolio Analysis and Management 1 (4): 345–379.
Jeon, Hyunglae, Jangkoo Kang, and Changjun Lee. 2017. “Precision About Manager Skill, Mutual Fund Flows, and Performance Persistence.” The North American Journal of Economics and Finance 40 (1): 222–237.
Johnson, William F., and Srinidhi Kanuri. 2018. “Is Target-Date Mutual Fund Underperformance Rational?” Journal of Investing 27 (1): 87–97.
Kacperczyk, Marcin, Stijn Van Nieuwerburgh, and Laura Veldkamp. 2014. “Time-Varying Fund Manager Skill.” Journal of Finance 69 (4): 1,455–1,484.
Khorana, Ajay, and Henri Servaes. 2012. “What Drives Market Share in the Mutual Fund Industry?” Review of Finance 16 (1): 83–113.
Kim, Jane. 2010. “Low Fees Outshine Fund Star System.” The Wall Street Journal, August 9, 2010.
Kinnel, Russel. 2010. “How Expense Ratios and Star Ratings Predict Success.” Morningstar Fund Spy, posted August 9, 2010 at morningstar.com/articles/347327/how-expense-ratios-and-star-ratings-predict-succes.html.
Kosowski, Robert, Alan Timmermann, Russ Wermers, and Hal White. 2006. “Can Mutual Fund “Stars” Really Pick Stocks? Evidence from a Bootstrap Analysis.” Journal of Finance 61 (6): 2,551–2,595.
Krueger, Thomas M., and C. Edward Chang. 2013. “How Good are Consumer Reports’ Recommendations of Mutual Funds?” Journal of Investing 22 (1): 88–103.
Mladina, Peter. 2011. “Portfolio Implications of Triple Net Returns.” The Journal of Wealth Management 13 (4): 51–59.
Morey, Matthew R. 2003. “Should You Carry a Load? A Comprehensive Analysis of Load and No-Load Mutual Fund Out-of-Sample Performance.” Journal of Banking and Finance 27 (2): 1,245–1,271.
Opiela, Nancy. 2001. “Tough Choices: Helping Parents Save for College and Retirement.” Journal of Financial Planning 14 (6): 68–77.
Opiela, Nancy. 2003. “When It Comes to College Funding, Planners Need to Go Back to School.” Journal of Financial Planning 16 (3): 46–53.
Spitzer, John J., and Sandeep Singh. 2011. “Assessing the Effectiveness of Lifecycle (Target-Date) Funds During the Accumulation Phase.” Financial Services Review 20 (4): 327–341.
Stalter, Kate. 2014. “529 Plans: Should You Choose Static or Age-Based?” U.S. News & World Report, posted September 3, 2014 at money.usnews.com/money/personal-finance/mutual-funds/articles/2014/09/03/529-plans-should-you-choose-static-or-age-based.
Citation
Chang, C. Edward, and Thomas M. Krueger. 2018. “529 Plan Investment Advice: Focusing on Equity Concentration and Fees.” Journal of Financial Planning 31 (6): 34–43.