Journal of Financial Planning: July 2022
William Reichenstein is head of research at Social Security Solutions, Inc. and Retiree, Inc. He is a professor emeritus at Baylor University and has published over 200 articles and written several books including Social Security Strategies (4th ed.) with William Meyer and Income Strategies.
William Meyer is CEO of Social Security Solutions, Inc. (ssanalyzer.com) and Retiree, Inc. in Overland Park, Kansas. He and Reichenstein developed software that coordinates for each client a smart Social Security claiming strategy with a tax-efficient withdrawal strategy (incomesolver.com).
NOTE: Click on images below for PDF versions
In this study, we present tax-efficient withdrawal strategies for five groups, where “withdrawal” is interpreted broadly to include Roth conversions. The key to developing a tax-efficient withdrawal strategy is to manage a household’s marginal tax rates, where marginal tax rate reflects the additional taxes paid on the next dollar of ordinary income. In preretirement years, the marginal tax rate (MTR) for a single individual or married couple filing jointly is usually the same as their tax bracket. However, as explained in the next two sections, their MTR in retirement years is often substantially higher than their tax bracket, due to the taxation of Social Security benefits and income-based Medicare premiums. As illustrated with an example, as a single retiree’s income rises, her MTR rises from her current tax bracket to 150 percent of her tax bracket, then to 185 percent, before falling back to her initial tax bracket when her income exceeds the level where 85 percent of Social Security benefits are taxable, which is the maximum. Furthermore, as her income continues to rise, there are up to five huge spikes in her MTR due to income-based increases in annual Medicare premiums. Tax-efficient withdrawal strategies require navigating this rollercoaster pattern of MTRs. The final section presents tax-efficient withdrawal strategies for five groups: four groups of retirees and the fifth group consisting of taxpayers who are younger than their retirement years.
Taxation of Social Security Benefits
The amount of a household’s Social Security benefits that are included in adjusted gross income (AGI) depends upon the household’s level of provisional income (PI). By definition, PI = modified adjusted gross income + ½ Social Security benefits + tax-exempt interest. MAGI appears in various places in the tax code, but its definition varies with each use. Thus, we use MAGIpi to denote this definition. For most retirees, MAGIpi consists of everything in AGI after deducting the taxable amount of Social Security benefits.1
There are two PI income threshold levels for singles, heads of households, and qualifying widow(er)s with a dependent child (henceforth, singles) of $25,000 and $34,000, and two for married couples filing jointly (henceforth, married couples) of $32,000 and $44,000. These PI income threshold levels have remained constant since Social Security became taxable in 1994. For a single household, the amount of Social Security benefits included in AGI is the lowest of three amounts: (1) 85 percent of Social Security benefits; (2) $0.50 for each dollar of PI between $25,000 and $34,000 plus $0.85 for each dollar of PI above $34,000; and (3) half of Social Security benefits plus $0.85 for each dollar of PI above $34,000. Unless annual Social Security benefits are below $9,000 for a single taxpayer, the amount of Social Security benefits included in AGI is the lower of (1) $4,500 + 0.85(PI - $34,000) or (2) 85 percent of Social Security benefits.
The amount of Social Security benefits included in AGI for a couple follows the same format, except the higher PI income threshold levels of $32,000 and $44,000 apply. Unless annual Social Security benefits are below $12,000 for a married couple, the amount of Social Security benefits included in AGI is the lower of (1) $6,000 + 0.85(PI - $44,000) or (2) 85 percent of Social Security benefits.
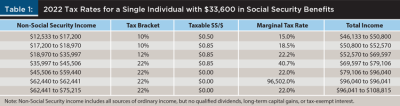
The goal of Table 1 is to show the range of non-Social Security taxable income (henceforth, non-SS income) for a single individual who, due to the taxation of Social Security benefits, is subject to MTRs of 150 percent or 185 percent of the tax bracket. To calculate the tops of tax brackets, we assumed non-SS income consists entirely of ordinary income (no qualified dividends, long-term capital gains, or tax-exempt interest). Furthermore, non-SS income does not include withdrawals from Roth accounts in retirement because they are tax-free. So, the calculations in Tables 1 and 2 of the levels of non-SS income that places a household at the tops of tax brackets may be somewhat off for some households. However, the major lessons from this study are not affected by this assumption.
Single Client
Table 1 illustrates the difference between single Betty’s tax bracket and her MTR on an additional dollar of income at various levels of non-SS income, where all amounts are rounded to the nearest dollar. Her 2022 annual Social Security benefits total $33,600. This would be her annual benefit level if her primary insurance amount (PIA) is $2,800 and she began her benefits at her full retirement age (FRA). It would also be her annual benefit level if she has a PIA of $2,121.20, FRA of 66, and began her benefits at age 70.
At non-SS income of $12,533, Betty’s PI is $29,333 [$12,533 + 0.5($33,600)]. So, $2,167 of her Social Security benefits are included in AGI. Thus, her AGI is $14,700 [$12,533 + $2,167]. Assuming she is at least 65 at the end of 2022, her standard deduction of $14,700 offsets this AGI. Thus, her tax bracket and MTR are 0 percent for each additional dollar of non-SS income up to $12,533.
For each additional dollar of non-SS income between $12,533 and $17,200, an extra $0.50 of Social Security benefits is included in AGI. Thus, her taxable income rises by $1.50. Since she is in the 10 percent tax bracket, her taxes go up by $0.15. Her MTR is 15 percent [10 percent bracket × 1.50].
At non-SS income of $17,200, her PI reaches $34,000, the second PI income threshold level. Thus, each additional dollar of non-SS income between $17,200 and $18,970 causes another $0.85 of Social Security benefits to be taxed. Thus, her taxable income rises by $1.85. Since she is in the 10 percent tax bracket, her taxes go up by $0.185. Her MTR is 18.5 percent [10 percent bracket × 1.85].
At non-SS income of $18,970, her taxable income reaches the top of the 10 percent tax bracket. Thus, each additional dollar of non-SS income between $18,970 and $35,997 causes another $0.85 of Social Security benefits to be taxed. Since she is in the 12 percent tax bracket, her MTR is 22.2 percent [12 percent bracket × 1.85].
At non-SS income of $35,997, her taxable income reaches the top of the 12 percent tax bracket. Thus, each additional dollar of non-SS income between $35,997 and $45,506 causes another $0.85 of Social Security benefits to be taxed. Since she is in the 22 percent tax bracket, her MTR is 40.7 percent [22 percent bracket × 1.85].
At non-SS income of $45,506, 85 percent of her Social Security benefits are taxed, which is the maximum. Thus, for Betty, the end of the tax torpedo occurs at this non-SS income level. At the end of the tax torpedo, Betty’s MTR falls sharply from 185 percent of her tax bracket to her tax bracket.
In short, due to the taxation of Social Security benefits, Betty’s MTR is 150 percent of her tax bracket for non-SS income between $12,533 and $17,200. More important, it is 185 percent of her tax bracket for non-SS income between $17,200 and $45,506, which is an income range of $28,306. As the Total Income column shows, Betty’s total income—that is, non-SS income + annual Social Security benefits—at the end of the tax torpedo is $79,106. Thus, many single clients of financial advisers have a non-SS income that place them within this tax torpedo.
Based on 2022 tax brackets, the taxation of Social Security benefits causes Betty’s MTR at the end of the tax torpedo to be 18.7 percentage points [40.7 percent - 22 percent] higher than her tax bracket. However, based on the Tax Cuts and Jobs (TCJA), the federal-alone MTR at the end of the tax torpedo is scheduled to be 21.25 percentage points higher than her tax bracket beginning in 2026 [46.25 percent - 25 percent, where 46.25 percent = 25 percent tax bracket × 1.85]. Moreover, the currently scheduled higher tax rates (i.e., 10 percent, 15 percent, 25 percent, etc.) may return sooner than 2026, and they may rise higher than they are currently scheduled to rise. In short, beginning in 2026 (if not sooner) and continuing for the rest of her life, Betty’s federal-alone MTR near the end of the tax torpedo will likely be at least 21.25 percent higher than her tax bracket. Furthermore, since most states impose income taxes, even if federal tax rates do not increase beyond the scheduled increases in the TCJA, many retirees will face federal-plus-state MTRs of 50 percent or higher on a significant range of their non-SS income for most of their retirement years.
The remaining rows of Table 1 will be explained later.
Married Clients
Table 2 presents the 2022 MTRs for a married couple with joint annual Social Security benefits of $60,000, where all amounts are rounded to the nearest dollar. This would be the size of their benefits if the higher earner (assumed male for clarity) has a PIA of $2,747, FRA of 66, filed for his retirement benefits at 70, and his wife filed for spousal benefits of half of his PIA at her FRA. It would also be the size of their annual benefits if each spouse had a PIA of $2,500 and filed for retirement benefits at their FRAs. As before, the calculations in Table 2 assume non-SS income consists entirely of ordinary income (no qualified dividends, long-term capital gains, or tax-exempt interest).
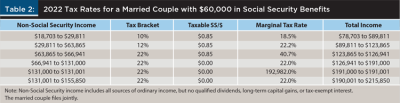
At non-SS income of $18,703, their PI is $48,703 [$18,703 + 0.5($60,000)]. So, $9,997 of their Social Security benefits is included in AGI. Thus, their AGI is $28,700. If both spouses are at least 65 at the end of 2022, then this AGI is offset by their standard deduction. Thus, their tax bracket and MTR are 0 percent, despite their PI already exceeding the second PI income threshold level of $44,000.
For each dollar of non-SS income between $18,703 and $29,811, an extra $0.85 of Social Security benefits is taxed. Since they are in the 10 percent tax bracket, their MTR is 18.5 percent [10 percent bracket × 1.85].
At non-SS income of $29,811, they reach the top of the 10 percent tax bracket. Each dollar of non-SS income between $29,811 and $63,865 causes an extra $0.85 of Social Security benefits to be taxed. Since they are in the 12 percent tax bracket, their MTR is 22.2 percent [12 percent bracket × 1.85].
At non-SS income of $63,865, they reach the top of the 12 percent tax bracket. Each dollar of non-SS income between $63,865 and $66,941 causes an extra $0.85 of Social Security benefits to be taxed. Since they are in the 22 percent tax bracket, their MTR is 40.7 percent [22 percent bracket × 1.85].
At non-SS income of $66,941, they reach the end of the tax torpedo, where 85 percent of Security benefits is taxable. At this level of non-SS income, their MTR drops from 185 percent of their tax bracket to their tax bracket.
In short, due to the taxation of Social Security benefits, this couple’s MTR is 185 percent of their tax bracket for non-SS income between $18,703 and $66,941, which is an income range of $48,238. Their total income at the end of the tax torpedo is $126,941. Thus, the tax torpedo affects many married clients of financial advisers who have already begun their Social Security benefits. For additional discussion related to the tax torpedo, see Reichenstein (2021a, 2019) and Reichenstein and Meyer (2021a, 2020b).
The remaining rows of Table 2 will be explained later.
Income-based Increases in Medicare Parts B and D Premiums
The Affordable Care Act instituted higher Medicare premiums for retirees as their income level increases. The term denoting the portion of premiums that increases with income is called the income-related monthly adjustment amount (IRMAA). The key point is as follows: Each time a retiree’s income surpasses one of five income threshold levels, their annual Medicare premiums (two years hence) rise substantially. These income-related increases in Medicare premiums are effectively increases in their federal income taxes. Thus, these IRMAAs represent huge increases in Medicare premiums and, therefore, huge increases in their MTRs when income exceeds any one of the five income threshold levels.
In general, Medicare premiums for one year are based on modified adjusted gross income levels from two years earlier.2 As noted earlier, the term modified adjusted gross income is used in various places in the tax code, but its definition varies with each use. Consequently, we use MAGImed to denote the definition of modified adjusted gross income as used to determine the level of Medicare premiums. MAGImed is defined as AGI plus tax-exempt interest.
Table 3 shows how monthly 2022 Medicare premium levels increase when 2020 MAGImed levels breach the 2022 income threshold levels. The 2022 income threshold levels for MAGImed are $91,000, $114,000, $142,000, $170,000, and $500,000 for single taxpayers and, except for the last income threshold level, these threshold levels are twice as high at $182,000, $228,000, $284,0000, $340,000, and $750,000 for married couples. To repeat, Medicare premiums for 2022 are generally determined by the MAGImed level from two years earlier, in this case from 2020. In this study, we assume this two-year lag occurs.
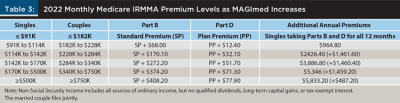
We explain how the 2020 MAGImed income level affects monthly Medicare premium in 2022 for a single taxpayer, but the same logic applies to married couples. For 2020 MAGImed of $91,000 or lower, the standard premium for Part B applies and, when applicable, the plan premium for Part D (drugs) applies. However, the dollar of 2020 income that causes MAGImed to exceed $91,000 will increase her 2021 Part B premium by $68 per month and increase her Part D premium, if applicable, by $12.40 per month. Assuming this single taxpayer is covered by Parts B and D for all 12 months of 2022, her annual premium will rise by $964.80 [{$68 + $12.40} × 12 months], plus she will owe an additional $0.22 of income taxes in 2020 on this last dollar of income. Thus, this dollar of 2020 income will cause her to pay $965.02 more to the federal government. This represents an MTR of 96,502 percent.
The spikes in MTRs get worse. The dollars of income that cause her 2020 MAGImed to exceed $114,000, $142,000, or $170,000 cause her 2022 annual Parts B and D premiums to increase by more than $1,459. Thus, each of these MTRs exceeds 145,900 percent. Finally, for a married couple filing jointly when both partners are on Medicare Parts B and D for all 12 months of 2022, the dollars of income that cause their 2020 MAGImed to exceed $228,000, $284,000, or $340,000 increase their 2022 annual Parts B and D premiums by more than $2,910. So, each of these MTRs exceeds 291,000 percent.
Returning to Table 1, at non-SS income of approximately $62,440, her income reaches the first MAGImed income threshold level.3 Thus, her MTR spikes to 96,502 percent at approximately this level of income. In Table 2, at non-SS income of approximately $131,000, the married couple’s income reaches the first MAGImed income threshold level. So, their MTR exceeds 192,000 percent. For simplicity, we did not include the other four IRMAA-induced spikes in MTRs in Tables 1 and 2. However, these other spikes in MTRs also need to be considered when retirees select their withdrawal strategy. For other literature related to income-based Medicare premiums, see Reichenstein (2020b, 2019) and Reichenstein and Meyer (2021a, 2021b, 2020a, 2020b).
Table 1 illustrates the substantial difference between tax brackets and MTRs for this retired single retiree who has begun Social Security benefits and will be on Medicare two-years hence. Although the 2022 tax brackets rise smoothly for this typical retired single individual, her MTR rises from her current tax bracket to 150 percent of her tax bracket, then 185 percent, before falling sharply back to her tax bracket at the income level when 85 percent of her Social Security benefits are taxable. Furthermore, due to IRMAAs, as her income continues to rise, there would be up to five huge spikes in her MTR with three of these MTRs exceeding 145,900 percent.
Table 2 for a married couple tells much of the same story. In particular, the MTR for a typical married couple is 185 percent of their tax bracket for a wide range of income, before it falls back to their tax bracket when 85 percent of their Social Security benefits are taxable. Furthermore, due to IRMAAs, as their income continues to rise, there would be up to five huge spikes in their MTR with three of these MTRs exceeding 291,000 percent.
A key lesson is that MTRs for most retired clients of financial advisers are substantially higher than their tax brackets. Retirees should factor in their MTRs, and not their tax brackets, when deciding how to tax-efficiently withdraw funds in retirement, where withdrawals are interpreted broadly to include Roth conversions.
Tax-Efficient Withdrawal Strategies for Five Groups
In this section, we present general tax-efficient withdrawal strategies that four groups of retirees can use to minimize their lifetime income taxes and often lower their lifetime Medicare premiums. It then discusses tax-efficient withdrawal strategies for households that are younger than their retirement years. The first group is what we call moderately wealthy clients, which include single individuals with financial portfolios between about $347,000 and $2 million and married couples with financial portfolios between about $530,000 and $2 million.4
Group 1
Reichenstein and Meyer (2021a) presents several cases that demonstrate the substantial value that financial advisers can add to moderately wealthy clients’ accounts by using the following general withdrawal strategy. First, delay the start of Social Security benefits until age 70 and make Roth conversions in the first few retirement years before Social Security benefits begin. In these first few years, retirees’ MTRs are generally the same as their tax brackets. Second, in later retirement years after Social Security benefits have begun, withdraw from their tax-deferred accounts (TDAs, such as 401(k)s and traditional IRAs) the larger of (1) required minimum distributions (RMDs); or (2) withdrawals to fill a low tax bracket or withdrawals below a MAGImed income threshold. Then, make tax-free withdrawals from Roth accounts to meet the rest of their spending needs. As we shall see, for many households, the ability to withdraw tax-free funds from their Roth accounts will allow them to avoid, or at least minimize, TDA withdrawals that would have been taxed at MTRs of 185 percent of their tax bracket due to the taxation of Social Security benefits.
Reichenstein and Meyer (2021a) presents several cases where a single or married household uses some variation of this same general withdrawal strategy. In each case, this general withdrawal strategy adds substantial value to these moderately wealthy households compared to the conventional wisdom (CW) withdrawal strategy, which is a widely recommended withdrawal strategy. We now summarize the results from one of these cases.
This case begins in February 2021, the month these cases were run in www.incomesolver.com. Tom is single. He retired in December 2020 in the month he turned 66. His life expectancy is 89 years. He lives in a tax-free state. He has $1 million in financial assets including $700,000 in a TDA and $300,000 in a taxable account with a cost basis of $270,000. He will spend $9,494 per month in real terms beginning in February 2021 and continuing for the rest of his life. Tom’s lifetime portfolio results depend upon (1) his choice of Social Security claiming strategy and (2) his choice of withdrawal strategy. In both strategies examined, we assume Tom has a primary insurance amount of $2,400 and delays claiming his Social Security benefits until age 70. Thus, differences in the two strategies are due entirely to differences in the tax-efficiency of their withdrawal strategies. Table 4 summarizes the results from two of his withdrawal strategies.
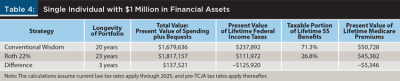
In the Conventional Wisdom (CW) Strategy, Tom withdraws funds from his taxable account until it is exhausted and then withdraws funds from his TDA. Tom realizes the $30,000 long-term capital gain in 2021. But in the CW Strategy, other 2021 withdrawals come from his taxable account and are tax-free withdrawals of principal. In 2021–2024, Tom is in the 0 percent tax bracket, meaning his AGI is less than his standard deduction. His taxable account is exhausted late in 2024, but he remains in the 0 percent tax bracket that year. In 2025, Tom withdraws all funds to meet his spending needs from his TDA and is in the 22 percent tax bracket. From 2026, when the higher tax rates are scheduled to return according to the TCJA, through 2040, he makes all withdrawals to meet his spending needs from his TDA, which puts him in the 25 percent tax bracket. His TDA is exhausted in 2041. So, he is in the 10 percent tax bracket in 2041 and the 0 percent bracket in 2042–2043. Since this withdrawal strategy fails to meet his spending needs in his last three years of life, its longevity is 20 years.
In the Roth 22 Percent Strategy, from 2021–2025 Tom withdraws funds to meet his spending needs following the CW withdrawal strategy. He also makes Roth conversions to fill the 22 percent and lower tax brackets. From 2026–2041, he withdraws funds from his TDA to fill the top of the 10 percent tax bracket, which satisfies his RMDs. He then makes tax-free withdrawals from his Roth account to meet the rest of his spending needs. His Roth account is exhausted in 2042. So, he is in the 15 percent tax bracket in 2042 and the 25 percent tax bracket in 2043. Since this withdrawal strategy meets his spending needs for his entire life, its longevity is 23 years. At his death, Tom is projected to have $19,444 of TDA funds remaining for his heirs.
The Total Value column presents the sum of the present value of after-tax spending amounts in his remaining lifetime plus the present value of the after-tax value of his portfolio that is left for his heirs; this case assumes his heirs lose 20 percent of the pretax value of inherited TDA balances to taxes. The discount rate for all present value calculations is the assumed inflation rate of 1 percent per year. The Taxable Portion of Lifetime SS Benefits column indicates the percent of lifetime Social Security benefits that are included in AGI.
The total value of the Roth 22 Percent Strategy is $137,521 higher than the total value of the CW Strategy. This additional total value is primarily due to two factors. The first and larger factor is the tax savings from this more tax-efficient withdrawal strategy. In 2021–2023, after withdrawing funds to meet his spending needs following the CW Strategy, Tom makes Roth conversions of about $296,000 to fill the 0 percent through 22 percent tax brackets. In 2024–2025, withdrawals to meet his spending needs come from his TDA, so his Roth conversions are much lower these years and total about $36,000. From 2026–2041, Tom withdraws funds from his TDA to fill the 10 percent tax bracket, which satisfies his RMDs in these years. He then makes tax-free withdrawals from his Roth account to meet the rest of his spending needs. From 2026–2041, Tom has to make much larger TDA withdrawals in the CW Strategy than in the Roth 22 Percent Strategy. Some of these larger TDA withdrawals in the CW Strategy are taxed at MTRs of 27.75 percent [15 percent bracket × 1.85], but lots of these withdrawals are taxed at MTRs of 46.25 percent [25 percent bracket × 1.85]. With a few exceptions to be noted later, the MTRs Tom pays on the early-year Roth conversions are 0 percent, 10 percent, 12 percent, or 22 percent. These funds provide the ammunition—that is, Roth account balances—that allows him to avoid making much larger TDA withdrawals from 2026–2041 in the CW Strategy that would be taxed at MTRs of 27.75 percent and 46.25 percent. In short, it is better for Tom to make Roth conversions from 2021–2025 and generally pay MTRs of 0 percent to 22 percent on these conversion amounts than to not make these Roth conversions and have to pay MTRs of 27.75 percent and 46.25 percent on the much larger TDA withdrawals in the CW Strategy during the majority of his retirement years.
In this Roth 22 Percent Strategy, the ability to make tax-free withdrawals from his Roth account greatly reduces the taxable amount of Tom’s Social Security benefits each year from 2026–2041; unlike withdrawals from a TDA, withdrawals from a Roth account do not increase provisional income, the measure of income used to calculate the taxable portion of Social Security benefits. In contrast, in the CW Strategy, Tom pays taxes on 85 percent of Social Security benefits from 2025–2040, that is, in every year before his financial portfolio is exhausted. With the Roth 22 Percent Strategy, Tom pays taxes on 26.8 percent of his lifetime Social Security benefits. Altogether, the present value of lifetime taxes is $125,920 lower with this Roth 22 Percent Strategy than with the CW Strategy.
A second factor explaining this Roth 22 Percent Strategy’s higher total value is the present value of lifetime Medicare premiums paid with each strategy. With the Roth 22 Percent Strategy, Tom pays higher Medicare premiums in 2023–2027 due to the Roth conversions in 2021–2025. However, the ability to make tax-free withdrawals from his Roth account allows Tom to pay lower Medicare premiums in 2029–2042 with this Roth 22 Percent Strategy than with the CW Strategy. Unlike withdrawals from a TDA, withdrawals from a Roth account do not affect MAGImed, and thus can reduce his Medicare premiums. Altogether, the present value of lifetime Medicare premiums is $5,346 lower with this Roth 22 Percent Strategy than with the CW Strategy. Notice that the recommended withdrawal strategy considers higher MTRs, due to both the taxation of Social Security benefits and IRMAAs. For additional examples related to the value that can be added by this general withdrawal strategy, see Reichenstein and Meyer (2022).
Group 2
A second group of households for which we can provide general tax-efficient withdrawal strategies consists of households that have already begun their Social Security benefits, but they now wish they had not. Consider a moderately wealthy individual who began her Social Security benefits less than 12 months ago. Since less than 12 months have passed, she can withdraw her application for retirement benefits. She would have to pay back her prior benefits based on her earnings record, including those her husband and children may have received based on her earnings record. However, this withdrawal of application would completely undo her prior claiming decision.
Next, suppose this individual was single and began her Social Security retirement benefits in December 2019 at age 62. Since more than 12 months have passed since she began her benefits, she cannot withdraw her application for retirement benefits. However, at her FRA of 66 and six months, she could suspend her benefits until age 70 and earn delayed retirement credits. She can then follow the general recommended withdrawal strategy for moderately wealthy households. She would have three calendar years to make Roth conversions that would be taxed at MTRs that are the same as her tax brackets because she will not be receiving Social Security benefits these years. When she turns 70, suppose her RMDs would put her in the low end of the 25 percent tax bracket. She could then make tax-free withdrawals from her Roth account to meet the rest of her spending needs. This would allow her to avoid making additional TDA withdrawals that would have been taxed at an MTR of 46.25 percent. If she has an unusually short life expectancy, then this strategy would not be appropriate. However, if her life expectancy is at least 78 years, then by suspending her Social Security benefits at her FRA, she would not only increase her expected real lifetime Social Security benefits, but this would also allow her to take advantage of the general tax-efficient withdrawal strategy that was described for the first group of households.5 For additional information about redo strategies, see Reichenstein (2022).
Group 3
A third group consists of retired households whose spending takes their income beyond the end of the tax torpedo. Recall that at the end of the tax torpedo, the MTR drops sharply from 185 percent of their tax bracket to their tax bracket. Consider Betty, the single retiree in Table 1. Her 2022 Social Security benefits total $33,600. At non-SS income of $46,366, which may be all TDA withdrawals, she could pay her federal income taxes and still meet her 2022 spending goal of $71,000. But this level of non-SS income will take her income to beyond the end of the tax torpedo. If her real spending remains constant in future years then, assuming modest returns and that she follows this same withdrawal strategy, then her TDA withdrawals will likely keep her income slightly beyond the end of the tax torpedo for many more years. In this case, she will pay an MTR of 40.7 percent (or 46.25 percent beginning in 2026) on some of her TDA withdrawals each year. Instead, she could make a 2022 Roth conversion of $16,000, which would be taxed at a relatively low MTR of 22 percent, which would also be her tax bracket. This conversion would keep her income below the first MAGImed income threshold level. One or more years of making Roth conversions to exploit this relatively low MTR income range would reduce her TDA balances and, therefore, reduce her TDA withdrawals in future years. This strategy would likely allow her to eliminate the range of income in future years that would be taxed at an MTR of 46.25 percent beginning in 2026 and minimize the income range that is taxed at an MTR of 27.75 percent. Furthermore, since these early-year Roth conversions would lower her MAGImed in later years, this strategy may allow her to avoid paying the first Medicare premium spike (aka IRMAA) in later years.
If her income places her near the end of the tax torpedo, she should still consider a Roth conversion. Suppose the first $1,000 of Roth conversions in 2022 would be taxed at an MTR of 40.7 percent in 2022, but the next $16,900 would be taxed at an MTR of 22 percent. She should consider making this $17,900 Roth conversion, despite the high MTR on the first few dollars of this Roth conversion.
Separately, consider a single individual whose MAGImed already exceeds the first, second, third, or fourth MAGImed income thresholds. She may be able to make a Roth conversion that would keep her MAGImed comfortably below the next MAGImed income threshold level. She should consider making a Roth conversion to exploit the relatively low MTRs on this range of income, which would also be her tax brackets.
These same ideas apply to married couples with incomes near or beyond the end of the tax torpedo. However, as shown in Table 2, for a married couple, the range of income between the end of the tax torpedo to the first MAGImed income threshold level exceeds $64,000, which is much wider than the corresponding range of income for singles. Similarly, the ranges of income between the first, second, third, and fourth MAGImed income threshold levels for married couples and their next MAGImed income threshold level are much wider than the similar ranges for single individuals. These married couples should consider Roth conversions to exploit the relatively low MTRs on these ranges of income. See Reichenstein and Meyer (2020a, 2021a) for additional discussion of the tax savings available to households with incomes that place them near or beyond the end of the tax torpedo.
Group 4
A fourth group consists of married couples when one spouse dies at least one calendar year before the other spouse. In other words, it consists of most married couples. Suppose one spouse (assumed male for clarity) of a married couple dies in 2030. Beginning in 2031, the surviving widow will face tax brackets for singles instead of those for married couples filing jointly. So, her tax bracket (and MTR) will likely be higher than the couple’s tax bracket (and MTR) was when both spouses were alive. In 2033, she will face Medicare premium income threshold levels for singles that are generally half as high as the threshold levels for married couples. So, she may face multiple IRMAA spikes in her Medicare premiums each year beginning in 2033. In fact, beginning in 2033 and continuing for the rest of her life, her annual Medicare premiums due to these IRMAAs could exceed their joint annual premiums when both partners were alive. The lesson is that married couples should consider making Roth conversions while both partners are alive to reduce both the size of their joint lifetime income taxes and the size of their joint lifetime Medicare premiums. See Reichenstein and Meyer (2021b) for additional discussion for this group.
Group 5
The fifth group consists of taxpayers—singles and married couples—who are younger than their retirement years. Most pre-retirees think they should contribute to TDAs instead of Roth accounts because they expect to be in a lower tax bracket during their retirement years than during their working years. Most of these pre-retirees do not know about (or have not thought about) how the taxation of Social Security benefits and income-based Medicare premiums will likely cause their MTRs on TDA withdrawals in retirement to be substantially larger than their tax brackets in those years. These pre-retirement households should consider (1) making contributions in their preretirement years to Roth accounts instead of to TDAs, and (2) making Roth conversions in years before Social Security benefits begin and, for wealthier clients, two years before they begin Medicare. In these preretirement years, their MTRs will be the same as their tax brackets until their incomes exceeds $200,000 for single taxpayers or $250,000 for married couples filing jointly. Due to the taxation of Social Security benefits, taxpayers who save more than a relatively small amount in their preretirement years should consider (1) making future contributions to Roth accounts instead of to TDAs and (2) converting TDA funds to Roth accounts while their MTRs are also their tax brackets. For additional articles related to this group, see Reichenstein (2021b, 2020a, 2020b).
Endnotes
- See Internal Revenue Service Publication 915, www.irs.gov/pub/irs-pdf/p915.pdf.
- When there is a life changing event (LCE) that would lower a household’s MAGImed sufficiently to lower its IRMAA premiums for a specific year, they can file Form SSA-44 to report this LCE. See the Social Security Administration publication at www.ssa.gov/forms/ssa-44-ext.pdf.
- This single individual’s 2022 MAGImed will likely determine her 2024 level of Medicare premiums, but she will not know the precise MAGImed income threshold levels for 2024 until October 2023, and these income levels may be higher than the 2022 threshold levels. In Reichenstein (2019) and other publications, we encourage households to leave a comfortable margin for error when trying to manage their level of MAGImed for 2022 because if this income measure exceeds any of the MAGImed income threshold levels for 2024, then this household’s Medicare premiums two years hence will rise substantially. For example, if the 2022 MAGImed exceeds the first MAGImed income threshold level for 2024, then the increase in 2024 Medicare premiums could exceed $964.80 for a single retiree and could exceed $1,929.60 for a married couple, where these amounts are based on 2020 IRMAA levels. Thus, to leave a comfortable margin for error, in Table 1 we calculated the MAGIpi that would produce a 2022 MAGImed of $91,000 [i.e., $91,000 = $62,440 + (0.85 × $33,600), since 85 percent of SS benefits would be included in AGI], even though this MAGImed income threshold level for 2024 may be higher. Furthermore, since the IRMAAs in 2024 may be higher than their 2022 levels, this first IRMAA-induced spike in MTRs may exceed 96,502 percent for a single retiree, which is the estimated MTR in Table 1.
- For Betty, the single retiree in Table 1, if her end-of-year TDA balance at age 71 exceeds $343,404, then her RMD at age 72 would exceed $18,701 [$343,404 / 27.4]. Even if her only source of non-SS income was her RMDs, this would put her income inside the tax torpedo, where her MTR is 150 percent of her tax bracket. If she has other sources of retirement income such as a pension, taxable interest, or capital gains, then the end-of-age-71 TDA balance to put her income within the tax torpedo would be lower. Since most taxpayers have other sources of retirement income, we estimate the lower end at $340,000 for singles and $500,000 for married couples filing jointly. The upper end of these TDA balance limits are based on research in Reichenstein and Meyer (2021a), and they assume the only source of non-SS income is RMDs.
- Suppose her age-62 benefit was $1,000 per month. Her real lifetime benefits would be ($1,000 × 12 months × X years). If she suspends her benefit at FRA, then her age-70 real benefit would be ($1,280 × 12 months × (X – 3.5) years). Setting these amounts to be equal, the breakeven age is 16 years from her age-62 beginning date. Thus, it is 78 years.
References
Reichenstein, William. 2022. “Social Security Redo Strategies for 2022.” Journal of Financial Planning 35 (3): 58–63.
Reichenstein, William. 2021a. “Minimizing the Damage of the Tax Torpedo.” Journal of Financial Planning 34 (9): 62–65.
Reichenstein, William. 2021b. “Tax Considerations for Relatively-Wealthy Households.” Journal of Financial Planning 34 (12): 61–66.
Reichenstein, William. 2020a. “How to Add Tax Alpha in Today’s Environment.” Journal of Financial Planning 33 (10): 27–29.
Reichenstein, William. 2020b. “Savings in Roth Accounts and Making Roth Conversions before Retirement in Today’s Low Tax Rates.” Journal of Financial Planning 33 (7): 40–43.
Reichenstein, William. 2020b. “Saving in Roth Accounts and Making Roth Conversions in Today’s Low Tax Rates.” Journal of Financial Planning 33 (7): 40–43.
Reichenstein, William. 2019. Income Strategies—How to Create a Tax-Efficient Withdrawal Strategy to Generate Retirement Income. Available through Amazon.
Reichenstein, William, and William Meyer. 2022. “Social Security Coordination to Create a Tax-Efficient Withdrawal Strategy.” Journal of Financial Service Professionals March: 38–48.
Reichenstein, William, and William Meyer. 2021a. “How Social Security Coordination Can Add Value to a Tax-Efficient Withdrawal Strategy.” Journal of Retirement 9 (2): 37–57.
Reichenstein, William, and William Meyer. 2021b. “Advice for Married Couples When One Spouse Will Die Year(s) Before the Other Spouse.” Journal of Financial Planning 34 (1): 43–45.
Reichenstein, William, and William Meyer. 2020a. “Using Roth Conversions to Add Value to Higher-Income Retirees’ Financial Portfolios.” Journal of Financial Planning 33 (2): 46–55.
Reichenstein, William, and William Meyer. 2020b. “Investment Implications of the Rising and Falling Pattern of Marginal Tax Rates for Retirees.” Journal of Retirement 7 (3): 53–64.