Journal of Financial Planning: December 2022
Ivory Johnson, CFP®, ChFC, is the founder of Delancey Wealth Management, LLC. Mr. Johnson has a B.S. in finance from Penn State University, has been certified by the Digital Asset Council for Financial Professionals, and is a member of the CNBC Financial Advisor Council.
NOTE: Click images below for PDF versions.
JOIN THE DISCUSSION: Discuss this article with fellow FPA Members through FPA's Knowledge Circles.
FEEDBACK: If you have any questions or comments on this article, please contact the editor HERE.
Digital assets have captured the imagination of Wall Street luminaries and bitcoin bros alike, each wrapping their arms around something that is as elusive as it is intangible, a virtual currency masquerading as an asset class. To fit this square peg into a hole made round by decades of risk management tools and central banking shenanigans, one might find it helpful to view something new with the instruments available to us in the present.
The purpose of asset allocation is to mitigate risk with a basket of securities that have different reactions to the same set of circumstances and match said portfolio with the stated risk profile of an investor. As the saying goes, the umbrella salesman will sell 40 units when it rains and nothing when it’s sunny, while the sunglasses salesman would have the opposite outcome. In a perfect world, an investor would own 50 percent of each business and sell 20 units daily regardless of the weather.
Morningstar reports that mid- and small-cap growth stocks have correlations of 0.896 and 0.856 with large-cap growth. During extreme bouts of volatility, however, the correlation of equities increases even further, dispelling the notion that a conventional allocation of equities decouples. It seems that a traditional portfolio offers little solace during extreme market declines as the zigs are more likely to resemble the zags.
The problem is real markets are wild, and, like turbulence, the risk can happen in clusters. Experience tells us that prices do not follow the proportions of a bell curve. In fact, most changes are small and an extreme few are large and unpredictable. Additionally, prices are not independent, being influenced by yesterday’s activity and human emotion, something not captured by the math-based assumptions.
Mathematician Benoit Mandelbrot studied daily index movements of the Dow Jones Industrial Average from 1916 to 2003. He describes in his book The Misbehavior of Markets that financial orthodoxy would have us believe there should have been 58 days when the index moved more than 3.4 percent, when in fact there were 1,001 such days. The index should have swings of more than 7 percent once every 300,000 years, even as the 20th century saw 48 such occurrences.
There is now an ancillary concern that risk has been obscured by financial engineering, the Federal Reserve offering shelter for what would have otherwise swept away celebrated returns. How do our models account for stock buybacks that as late as April 2020 accounted for 100 percent of net new purchases of stocks since 20081 and now find themselves at record highs2 in a rising interest-rate environment?
These inefficiencies explain in part why new asset classes have always found their way into portfolios, whether it was the first emerging market fund in 1987 or the initial small-cap retail opportunity in 1993. Time and again investors seek to normalize returns with holdings that if they were to stand alone would be imprudent, but in collaboration with the generally accepted asset classes provide increasing alpha.
Digital assets should fall under the category of an alternative asset class. They have been defined as anything digital that has value, established ownership, and is discoverable. They can include art, a business model, or currencies. The term “crypto” is short for cryptography, the practice of encoding and decoding data that may include one’s identity. Instead of being known as John Doe, you are a string of 32 characters referred to as a hash. Cryptocurrencies, therefore, are digital value traded as coins by investors on a blockchain and identified in such a manner.
It’s important to note that digital assets are an investment and blockchain is another name for a database used as a business tool. Digital assets are traded on a blockchain that has no intermediaries and is immutable. When you buy bitcoin, the transaction is recorded and executed on the blockchain without third-party participation.
The same process one would apply to the current menu of asset classes when building a portfolio should be applied to digital assets. For the sake of this discussion, we will use bitcoin because it is the most widely owned, has been adapted by both institutional and retail investors, and has the most data given its lifespan of 13 years.
According to the Digital Asset Council for Financial Professionals, bitcoin has been eight times more volatile than the S&P 500, and it stands to reason that a client’s risk tolerance would dictate the appropriate allocation. A traditionalist would certainly underweight high-beta securities for a risk-averse investor; bitcoin should be subject to the same considerations.
It may come as quite the surprise to learn that including bitcoin in a portfolio increases the Sharpe ratio with little to no impact on max drawdowns or standard deviation (see Table 1). For instance, from 2014 through 2020 a 60–40 portfolio has a Sharpe ratio of 0.64, a standard deviation of 10.5 percent and a max drawdown of –21.9 percent. Research shows that adding 1 percent to bitcoin increases the Sharpe ratio to 0.71 while the standard deviation remains at 10.5 percent and the max drawdown increases modestly to –22.1 percent. A more aggressive investor with a 5 percent allocation to bitcoin would have experienced a 0.96 Sharpe ratio, a standard deviation of 11 percent and a max drawdown of –22.8 percent.
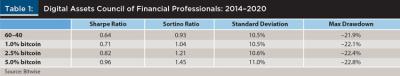
It’s worth pointing out that the period of note includes an 84 percent decline from December 2017 through December 2018—this was not a time frame cherry picked for its lack of volatility. More importantly, those who subscribed to a buy-and-hold strategy, the precious few who did not adjust their risk tolerance once they experienced intolerable risk, were well rewarded for their patience as were those who did the same with their equity allocations.
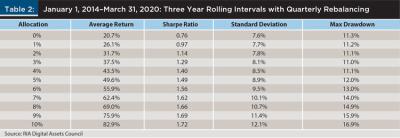
The same can be said for quarterly rebalancing (see Table 2). A 60–40 portfolio from January 2014 through March 2020 experienced a 20.7 percent return, a 0.76 Sharpe ratio, a 7.6 percent standard deviation, and a max drawdown of 11.13 percent. Had you added a 2 percent allocation to bitcoin, the returns would be 31.7 percent, the Sharpe ratio 1.14, the standard deviation would increase to 7.8 percent, and the max drawdown would be 12 percent. Similarly, a 4 percent allocation to bitcoin would return 43.5 percent, deliver a 1.4 Sharpe ratio, an 8.5 percent standard deviation, and a max drawdown of 11.1 percent.
These findings should come as no surprise. Bitcoin appears to be a non-correlated asset class that offers diversification in an investment environment that is increasingly correlated. A report from CoinDesk showed that for almost all of 2021, bitcoin remained within a range of –0.2 to 0.2 when compared to the S&P 500, gold, the U.S. dollar, and bonds. Per Onramp Academy, bitcoin’s correlation to the S&P 500, gold, emerging markets, oil, and the Russell 2000 was 0.35, –0.10, 0.35, 0.2, and 0.42 respectively from September 30, 2015, through August 31, 2022. According to the IMF, bitcoin’s correlation to the S&P 500 was just 0.01 from 2017 to 2019. That changed in 2020–2021, as central banks flooded markets with liquidity and correlation jumped to 0.36, indicating the asset classes were moving closer together.
The increasing correlation can best be explained by the value statement. There is a supply cap of 21 million bitcoins that will ever be mined, which makes it a store of value. In that sense, an investor who buys bitcoin with dollars exchanges something in abundance for something that is scarce. Bitcoin benefitted when 40 percent of the money supply was created in a 24-month period,3 the consequence of loose monetary policy and indiscriminate government spending.
That dynamic has now shifted as the transition from extraordinary bouts of random government stimulus programs to a hawkish Federal Reserve has made the store of value argument less salient. Lo and behold, per Hedgeye Research, the 120-day correlation with the S&P 500 is 0.68 as of this writing, significantly higher than previous time frames, even if the likelihood that correlations will remain this elevated are debatable.
When the Fed increases the money supply, that’s good for bitcoin. When it reduces liquidity, that of course is bad for bitcoin. If you believe the Fed will stop creating money out of thin air long-term with a $30 trillion national debt and 70 million retiring baby boomers, you should be bearish on bitcoin long-term. If something that drops 50 percent is too volatile, you should know that 40 percent of Nasdaq stocks were down over 50 percent from their all-time highs in January 20224 and conditions have deteriorated even further as the year has progressed.
Digital assets are volatile, but they have plenty of company and a decade of performance history. They resemble any other risk asset where reckless weighting leads to outcomes that may be inconsistent with the investor’s risk tolerance. These obstacles are not a new phenomenon. The arguments made against bitcoin are all too familiar to small caps and emerging markets securities.
Advisers are taught to rebalance portfolios, diversify asset classes, and subscribe to the risk tolerance of the client. We also have a fiduciary obligation to do what’s right for the client regardless of personal inclinations that may or may not conflict with available data. Digital assets are not for everyone. Instead, they’re one of the many available tools to consider when helping our clients meet their long-term objectives.
Endnotes
- Vigna, Paul. 2020, April 5. “If Companies Aren’t Buying Their Own Stock, Who Is?” Wall Street Journal. www.wsj.com/articles/if-companies-arent-buying-their-own-stock-who-is-11586079000.
- Pisani, Bob. 2022, August 30. “Corporate Stock Buybacks Are Saving This Market from an Even Bigger Rout.” CNBC. www.cnbc.com/2022/08/30/corporate-stock-buybacks-are-saving-this-market-from-an-even-bigger-rout.html.
- Hanke, Steve, and Nicholas Hanlon. 2022, February 23. “Jerome Powell Is Wrong. Printing Money Causes Inflation.” Wall Street Journal. www.wsj.com/articles/powell-printing-money-supply-m2-raises-prices-level-inflation-demand-prediction-wage-stagnation-stagflation-federal-reserve-monetary-policy-11645630424.
- Hajric, Vildana. 2022, January 6. “Number of Nasdaq Stocks Down 50% or More Is Almost at a Record.” Bloomberg. www.bloomberg.com/news/articles/2022-01-06/number-of-nasdaq-stocks-down-50-or-more-is-almost-at-a-record.
Delancey Wealth Management and Vanderbilt Financial Group are separate and unaffiliated entities. Vanderbilt Financial Group is the marketing name for Vanderbilt Securities, LLC and its affiliates. Securities offered through Vanderbilt Securities, LLC. Member FINRA, SIPC. Registered with MSRB. Clearing agent: Fidelity Clearing & Custody Solutions. Advisory Services offered through Consolidated Portfolio Review Clearing agents: Fidelity Clearing & Custody Solutions, Charles Schwab & TD Ameritrade Insurance Services offered through Vanderbilt Insurance and other agencies. Supervising Office: 125 Froehlich Farm Blvd, Woodbury, NY 11797. 631-845-5100. For additional information on services, disclosures, fees, and conflicts of interest, please visit www.vanderbiltfg.com/disclosures.
The opinions voiced in this material are for general information only and are not intended to provide specific advice or recommendations for any individual. Past performance is no guarantee of future results. All investments involve risk and may lose value. There is no assurance that the objectives of any strategy will be achieved. No strategy can guarantee a profit or fully eliminate the risk of loss.