Journal of Financial Planning: March 2019
Lukas R. Dean, Ph.D., CRC®, is an associate professor of financial planning in the Woodbury School of Business at Utah Valley University. He is a member of the CFP Board’s Workforce Development Advisory Group and was named to the InvestmentNews inaugural 40 under 40 list.
Nathan Harness, Ph.D., CFP®, is the director of financial planning at Texas A&M University, where he teaches investments, intermediary financial planning, and comprehensive financial planning. He has lectured nationally and internationally on global financial risk, international investing, gender-based asset preferences, and next generation planning.
Jared Pickens, EdD., CFP®, AFC®, is an assistant professor of finance and the director of personal financial planning at Texas A&M University—Commerce. He teaches introduction to financial planning, retirement planning, and financial planning capstone at the undergraduate and graduate levels.
Executive Summary
- This study examined changes in assets held in U.S. registered investment adviser (RIA) firms following the Great Recession.
- The researchers hypothesized that the recession forced consumers to reevaluate investment advice by paying more attention to their agency relationship (professional adviser equals agent), as well as the agency costs that possibly exist in terms of fees and potential conflicts of interest.
- This analysis showed firms that charged fees in a less transparent method experienced a 9 percent to 17 percent decrease in total AUM; firms that charged fees more visible to the client experienced a 6 percent to 23 percent increase in total AUM.
- Understanding the flow of funds during economic retractions can help financial planners understand consumer preferences across time.
- This research exemplified the idea that after a shock, consumers are more likely to focus on fees and perceived conflicts of interest.
The financial crisis of 2008 can be compared to an economic wildfire that burned out of control for many months, changing global market behaviors and preferences for years after. But just as wildfires in nature play an important role in rejuvenating forests, major economic events can also be change agents, bringing about new growth and consumer policy.
Since the last severe economic recession in 2008–2009, the U.S. economy has experienced an unprecedented period of growth. The Dow Jones and S&P 500 have more than quadrupled in value since 2009 lows, leading to the longest period of continuous market growth in U.S. history.1 Is positive market growth indefinitely sustainable? History would tell us that what goes up, must eventually come down. As economic projections2 start to increase the possibility of a new recession, advisers and firms may want to inquire about trends observed from the previous recession.
The broader question to the financial advisory profession is what happens to consumer preferences and the flow of funds when markets retract? Although consumers tend to prefer the status quo (Jones, Mothersbaugh, and Beatty 2000; Samuelson and Zeckhauser 1988), they will reevaluate their financial service providers when there is a sufficient shock introduced into the system, which is what happened during and after the Great Recession.
Review of Literature
The investment/financial adviser profession is unique because it has limited barriers to entry compared to professions like medicine, law, and accounting (Ciccotello, Grant, and Dickie 2003; Black, Ciccotello, and Skipper 2002). Bonding costs incurred by agents—education, professional designations or credentials, etc.—vary dramatically from one financial institution to another (Hung et al. 2008). Consumers perceive services to be characterized by higher prices and greater variation in performance (Mitchell and Greatorex 1993). Economic theory suggests that consumers would take more time looking for an adviser if there was greater variation in cost and quality (Maynes and Assum 1982). However, evidence suggests that consumers engage in considerably less due diligence than predicted by the economics of information theory (Stigler 1961; Grewal and Marmorstein 1994).
When clients delegate their investment management needs to an adviser for compensation, an agency relationship is established under the common law of agency (Sitkoff 2014). Clients engage in this type of relationship seeking the benefit of professional assistance with investment management performance, financial planning, and limited costs. While this relationship can mutually benefit both the adviser and the client, an agency problem can occur causing a less-than-optimal outcome for the client. An agency problem, in the context of the adviser and client relationship, refers to any situation where a financial adviser acts in a manner that is more favorable for the adviser and less favorable for the client. Potential conflicts of interest can generate agency costs for the client, including situations where the client cannot clearly monitor the investment fees charged, investment performance, or whether the advice given is for the benefit of the adviser or the client (Jensen and Meckling 1976).
The financial services literature suggests that customers are likely to be loyal to their financial service provider if they are generally satisfied by the service they are receiving and if they are satisfied with their professional relationship with the adviser (Barnes 1997; Beckett, Hewer, and Howcroft 2000). This loyalty is greater when there are fewer perceived attractive alternatives and when barriers to switching are high (Jones, Mothersbaugh, and Beatty 2000).
There appeared to be some gender differences (Palmer and Bejou 1995), but in general customers of repeat purchase goods like financial services tended to be “sticky” and had a strong preference for the status quo until a shock or sufficient evidence caused them to reevaluate their service provider (Inman and Zeelenberg 2002; Kahneman, Knetsch, and Thaler 1991). Samuelson and Zeckhauser (1988) referred to this as the status quo bias.
It’s possible that consumers remain with a financial service provider because the inconvenience of terminating the relationship is greater than the advantages associated with hiring new representation. It took either an economic shock, turbulent times (Palmer and Bejou 1995), or sufficient evidence to switch (Inman and Zeelenberg 2002).
The economic downturn in 2008, coupled with several high-profile cases of financial institutions failing and fraud committed by investment advisers, alarmed investors enough to start examining their financial service providers more thoroughly. The mainstream press suggested consumers should ask about their adviser’s compensation and encouraged the public to seek out advisers with a fiduciary duty, a clean background check, no potential conflicts of interest, and proper professional credentials and certifications.3
Although all RIAs are regulated under the Investment Advisers Act of 1940, which requires a fiduciary standard of care, a number of RIAs are dually registered as broker-dealers that operate under a suitability standard of care as long as they disclose to clients when they are operating as an RIA and when they are operating as a broker. Additionally, investment advisers must file Form ADV to register with the SEC and state securities authorities. Information on the form, which must be disclosed to clients, includes any previous ethical violations, associations with other professionals that might create a conflict of interest, how they are compensated, and when they or a related person have a stake or interest in the clients’ transactions.
In the aftermath of the financial crisis and several high-profile convictions of Bernie Madoff, Allen Stanford, and Marcus Schrenker for fraud and other crimes, consumers began to pay more attention to fees4, agency costs (Finke, Huston, and Waller 2009), and potential conflicts of interest (Dean and Finke 2012; Dean 2010) with their financial advisers.
Purpose of Study
The purpose of this study was to determine if clients shifted assets under management in the aftermath of the 2008 economic downturn. Specifically, this study investigated whether clients and assets migrated to advisers with no previous record of ethical violations, away from advisers who were dually registered as both an RIA and a broker-dealer, and away from certain forms of compensation such as commissions that could likely to be opaque to consumers. Understanding the flow of funds during economic retractions can help financial planners and policymakers understand consumer preferences across time.
Hypotheses
It was expected that after a sufficient shock, U.S. consumers reexamining their financial service providers would shift away from financial advisers with agency costs and potential conflicts of interest (Dimmock and Gerken 2011).
While evidence suggested a trend of attrition amongst brokers and growth in the RIA channel (Hung et al. 2008), an opportunity exists for RIA firms to become fee-only or a “hybrid,” which is registered as a broker-dealer with FINRA and as an RIA with the SEC. At a hybrid firm the financial adviser can choose client-by-client how much to charge in fees and how much to charge in commissions, providing flexibility to select when to act as an RIA with a fiduciary obligation to clients, and when to act as a broker with a suitability standard. That potentially opens up a broader universe of products, investments, and services for the adviser to use on behalf of his or her clients. However, it also requires the consumer to more closely monitor costs to discern when their adviser is acting as a fiduciary under the Investment Advisers Act of 1940 and when they are operating under the suitability standard created by the Securities and Exchange Act of 1934.
Data
This study examined changes in U.S. RIA firm Form ADV data from July 2008 to July 2010, a period of economic shock. Excluding RIA firms without any individual clients resulted in a study population of 8,239 RIA firms in July 2008; 8,443 in July 2009; and 8,824 in July 2010. At the time of data collection, firms with more than $25 million in assets under management were required to register with the SEC as an RIA with a Form ADV.
The Form ADV asks firms to report the number of accounts they provide investment advisory service to on a Likert-type scale: 0, 1–10, 11–25, 26–100, 101–250, 251–500, and over 500. The wide range within each response meant firms could lose up to 50 percent of their clients and stay within the same designation. But the number of total accounts is reported as a specific number. Because it’s common for a client to have more than one account, using the number of total accounts as a proxy more precisely tracked shifts by firm type.
Method
Changes in key variables—total number of RIA firms, total AUM, total number of accounts, total AUM per firm, total number of accounts per firm, and total assets per account—were used to identify whether different forms of compensation or specific agency costs were associated with changes in assets or clients during and after the recession from July 2008 to July 2010.
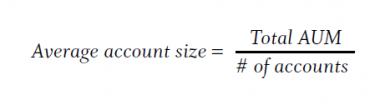
To determine average assets per account at each type of RIA firm, the total assets under management was divided by the number of accounts reported by each firm:
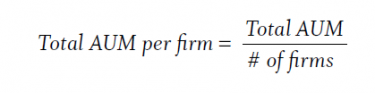
To determine the total AUM per firm, the total AUM was divided by the number of firms:
To determine the total number of accounts per firm, the total number of accounts was divided by the number of firms:

Results
Variable 1: Total number of RIA firms within each firm type. AUM is the total market value of assets that an investment company or financial institution manages on behalf of its clients. Almost all investment advisers charge their clients based on a percentage of AUM, and more than three-fourths of RIA firms during the targeted period received additional compensation as well. Fixed fees—for retainers, private consulting fees, and financial plan development—were found in about half of RIA firms with individual clients, while 11 percent to 12 percent charged commissions. Twenty-one percent of RIA firms accepted only AUM fees and no other forms of compensation. This group is referred to in this study as AUM-only firms.
Table 1 shows the number of RIA firms with individual clients from July 2008 to July 2010 and includes a breakdown by compensation type across the three time periods.
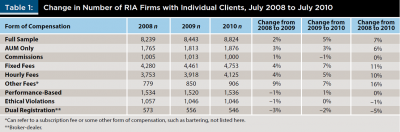
Table 1 suggests that the number of RIA firms with individual clients increased slightly from July 2008 to July 2009, and then experienced 5 percent growth from July 2009 to July 2010. Consistent with the findings of Hung et al. (2008), it appears that the RIA business model as a whole grew, even during periods of market retraction. Within this RIA population, the largest and most consistent decreases were found in RIA firms dually-registered as broker-dealers.
RIA firms with commissions, past ethical violations penalties, and those that were performance-based experienced near flat growth over the target years. In contrast, RIAs using the fee-only or fee-based platform showed the greatest growth during the market decline. This finding could be a function of discontented clients shifting from a commission-based platform to a fee-based platform5 where the compensation was more transparent or where the investment adviser had income more closely tied to market performance. It’s also possible that investment advisers—who almost all received compensation as a percentage of AUM—began to explore new ways to offer service to non-traditional clients or charge additional fees to increase their income at a time when their AUM had significantly decreased in value.
Whether the changes were due to client demand or the necessity for RIA firms to increase their income, Table 1 shows that AUM-only firms and firms offering fixed fees, hourly fees, or other fees grew in number from July 2008 to July 2010. Whereas firms that had specific agency costs and opaque forms of compensation experienced no growth or small decreases in numbers from July 2008 to July 2010.
Variable 2: Total assets under management within each firm type. A number of RIA firms open, close, or merge with another firm in any given year. To examine the changes in AUM without any survivorship bias, a total AUM variable was created that accounted for the total dollar amount of AUM according to compensation type or agency cost.
Table 2 examines these changes by compensation type and agency cost relative to the overall population of RIA firms.
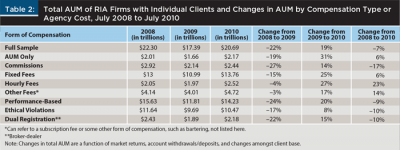
Although all forms of compensation lost total AUM from July 2008 to July 2009, the most significant decreases by percentage were experienced by firms that charged commissions. The smallest decreases in total AUM were experienced by firms charging hourly and other fees. During the first year, firms with specific agency costs, such as previous ethical violations and dual-registration as a broker-dealer, experienced decreases in total AUM, but the decreases for dually registered firms were similar to those of the general RIA population.
When examining the shifts in AUM from July 2008 to July 2010, the largest decreases in total AUM were in firms that charge commissions (–17 percent); dual registered firms (–10 percent); and firms with previous ethical violations (–10 percent). Firms that charged fees or AUM only reported increases in AUM over the same time period.
Table 2 also shows that RIA firms with individual clients experienced a 19 percent increase in total AUM from July 2009 to July 2010. All forms of compensation, including the RIA firms with agency costs, experienced increases in AUM during this time. The smallest increases in AUM were amongst RIA firms with previous ethical violations (8 percent), firms that charged commissions (14 percent), and firms dual registered as a broker-dealer (15 percent). The most significant increases in AUM were experienced by AUM-only firms (31 percent) and firms charging hourly fees (27 percent) and fixed fees (25 percent).
Variable 3: Number of accounts within each firm type. Computing a total number of accounts allows examination of specific shifts at certain types of RIA firms without the results being confounded by survivorship bias. Table 3 presents the total number of accounts in RIA firms.

From July 2008 to July 2009, the number of total accounts reported by RIA firms that accept other fees increased sharply. Taken in conjunction with Table 2, it appears that there was not a large increase in AUM at these firms; possibly a result of lower-net-worth clients coming in for professional advice without enough assets to meet AUM minimums and preferring to barter with other fees, and firms perhaps exploring ways to offer service to clients they might not have previously taken. The large influx of accounts disappeared in the second year, dropping 10 percent, but still resulted in the largest overall increase (53 percent) in the total number of accounts.
Table 3 also shows that from July 2009 to July 2010, the total number of accounts decreased for firms that charged commissions (–8 percent); were dual registered as a broker-dealer (–6 percent); had previous ethical violations (–4 percent); used performance-based compensation (–4 percent); or charged other fees (–10 percent). The largest increases over that year in total number of accounts were experienced by firms that charged hourly fees (17 percent), or firms that charged AUM only (9 percent).
Variable 4: Average AUM per firm within each firm type. Table 4 combines the results from Table 1 and Table 2 to compare how total AUM per firm shifted across the designated time periods.
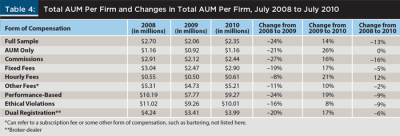
Table 4 shows that between 2008 and 2009, RIA firms of all compensation types and agency costs experienced a decrease in total AUM, with commissions experiencing the most dramatic decrease (–27 percent). Hourly fees experienced the least dramatic decrease (–8 percent). Then, over the next 12 months, from July 2009 to July 2010, AUM-only firms experienced the most dramatic increase (26 percent), and firms that had previous ethical violations experienced the smallest increase in total AUM (8 percent).
Variable 5: Total accounts per firm within each firm type. Table 5 provides evidence for how the number of total accounts per firm shifted across these same time periods.
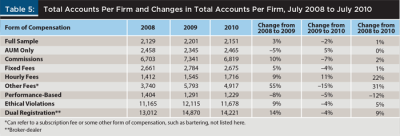
RIA firms with individual clients had approximately 2,000 accounts per firm in 2008. In general, firms that were dually registered as a broker-dealer, and firms that had previous ethical violations had more than five times as many accounts as the average RIA firm. Firms that charge commissions had over three times as many accounts as average RIA firms.
From July 2008 to July 2009, RIA firms, in general, experienced an increase of 3 percent in total accounts. Firms that charged other fees experienced the most dramatic increase in total accounts per firm (55 percent). Dually registered firms gained 14 percent, and commission firms gained 10 percent. Only performance-based compensation (–8 percent) and AUM-only (–5 percent) experienced a decrease in total accounts per firm.
RIA firms generally experienced a small decrease of 2 percent in total accounts per firm from July 2009 to July 2010. Hourly fee (11 percent) and AUM-only (5 percent) firms experienced the greatest increases, while firms that charged other fees experienced the steepest decrease (–15 percent), after having a tremendous increase during the prior year.
For the two-year window of this study, RIA firms experienced a small increase of 1 percent in total accounts per firm. The biggest gainers were firms that charged other fees (31 percent) and hourly fees (22 percent). Only firms with performance-based compensation experienced a decrease in total accounts per firm (–12 percent) over that time period.
Only firms charging hourly fees experienced increases in total accounts per firm year-to-year, and only performance-based firms experienced decreases year-to-year.
Variable 6: Total AUM per account per firm within each firm type. Table 6 provides evidence for how the number of total assets per account shifted across these same time periods. The average RIA firm’s AUM per account declined at a rate much larger than the overall market retraction.
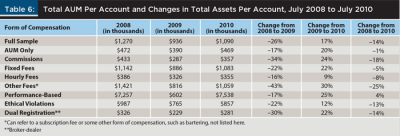
In July 2008, RIA firms with individual clients had assets per account of about $1.3 million, which decreased 26 percent to $935,873 by July 2009. All types of firms experienced a decrease in assets per account during that year; however, this marks a decrease in the average account size at a rate much greater than the market loss. Firms that charged other fees experienced the greatest decrease in assets per account (–43 percent), likely due to the large influx of new accounts per firm experienced between 2008 and 2009, as shown in Table 5, and perhaps due to firms taking in clients that previously would not have met their account minimums.
Significant decreases in assets per account were also experienced by firms that charge commissions (–34 percent) and those dually registered as a broker-dealer (–30 percent). Smaller decreases in assets per account were experienced by firms charging hourly fees (–16 percent), AUM-only (–17 percent), and performance-based compensation (–17 percent).
From July 2009 to July 2010, RIA firms overall experienced a 17 percent increase in assets per account, with each specific type seeing an increase in assets per account. Firms that charged other fees (30 percent), performance-based compensation (25 percent), and commissions (24 percent) experienced the largest increases. The smallest increases were seen in firms that charged hourly fees (9 percent) and firms that had previous ethical violations (12 percent).
For the two years starting July 2008, RIA firms overall experienced a decrease of 14 percent in assets per account. All firms experienced a decrease in assets per account except for those offering performance-based compensation, which saw a 4 percent increase. The largest decreases in assets per account were in firms that charged other fees (–25 percent), firms that charged commissions (–18 percent), firms that were dually registered (–14 percent), and firms with previous ethical violations (–13 percent).
Limitations
The dataset used for this research was comprised of U.S. RIA firm Form ADV data from July 2008 to July 2010 for all firms with more than $25 million in AUM. The data on the Form ADV provides total assets, number of accounts, clients, ethical violations, etc. But the Form ADV does not account for how much of the asset growth (or loss), was due to market returns (losses), client contributions (distributions), additional clients acquired (lost), or due to firm mergers and acquisitions or the creation of new firms.
Although the current findings point to macro-level discoveries about how clients and assets shifted after the recession, further research is necessary to examine the precise causes and consequences of these shifts, and whether there are meaningful differences in the types of clients at various types of financial planning firms. The present findings indicate some shifts in client preference after a financial shock. However, because the dataset is only for July 2008 to July 2010, it is possible that some of these shifts could be part of a broader trend. Further research is necessary to explore more deeply how clients and firms alike shift in response to a bear market or a financial shock.
Conclusions and Implications
As mentioned earlier in the literature review, consumers have a tendency to prefer the status quo due to behavioral biases (Landman 1987; Kahneman and Tversky 1984; Thaler 1980) and the sheer inconvenience associated with firing a financial adviser. It takes a shock or clear evidence of more attractive alternatives to effectively reduce perceived barriers for switching service providers.
The economic downturn that began in 2008 shocked consumers who likely started focusing more attention on the costs, fees, and compensation structure of their financial service providers. High-profile fraud cases may have scared some investors away; however, it appears that some consumers became more reliant on professional investment advisers after the recession.6 The data in this study supports that notion by indicating an increase in firms and accounts per firm from 2008 to 2010 and an increase in AUM for firms that were AUM-only or those that charged fixed fees, hourly fees, or other fees.
Despite the increased reliance on investment advisers, there was also evidence that consumers increased monitoring those same advisers. Dimmock and Gerken (2011) discovered that 5 percent of the RIA firms with the highest fraud risk accounted for 29 percent of investment frauds and 40 percent of the total dollar losses from fraud. The data in this study demonstrated that firms requiring more monitoring costs (commissions, dual registration, previous ethical violations) on the part of consumers showed a decrease in AUM and a slight decrease in total number of firms.
Recall that the purpose of this study was to examine the aftermath of a shock to the financial system and determine which alternatives subsequently appeared the most attractive to clients. When financial markets experience shocks, financial planners and advisers need to be prepared for changing consumer preferences. As shown in the analysis, RIA firms as a whole were able to grow in number during a time of economic recession, but not all firm types were insulated from the market shock. The data suggests that consumers preferred AUM-only firms and largely avoided RIA firms with past ethical violations, dual registration, or that charged commissions.
Total AUM painted an even more dramatic separation. Firms charging fees experienced an increase between 6 percent and 23 percent in total AUM during the two years after July 2008. In contrast, firms with specific agency costs (dual registration, commissions, previous ethical violations) experienced a decrease between 9 percent and 17 percent in total AUM.
After further analyzing changes in the total AUM per firm, total accounts per firm, and total AUM per account in different types of firms between July 2008 and July 2010, it became clear that total AUM per firm recovered differently based on firm type. AUM-only firms recovered very quickly from the economic shock of 2008 to 2009, while commission and dually registered firms did not recover those losses in the next year. Also, firms with previous ethical violations seem to recover much more slowly than other firm types, perhaps because past behavior becomes more salient to prospective clients when markets are shocked.
RIA firm owners, clients, and regulators should be aware of client response to firm models after an economic shock. The financial cost of a consumer moving money from one adviser to the next can be great, but there appears to be a preference for more transparent fees and firm models that are not dually registered under a fiduciary and suitability standard, and also a preference for firms with no ethical violations during market retractions. The downturn created anxiety, fear, and trepidation amongst U.S. consumers, and also prompted them to take a closer look at their investment advisers.
When the next recession or downturn happens, the findings from this research can help financial planning professionals and planning firms to position themselves to be most salient to consumers who will be searching for refuge and shelter from the economic wildfire. Using this analysis, planners and firms can demonstrate they are the financial first responders that can be called on and trusted in a crisis.
Endnotes
- See Federal Reserve Bank of St. Louis data (accessed Sept. 8, 2018) at fred.stlouisfed.org/series/DJIA.
- See “United States Economic Forecast: 3rd Quarter 2018,” by Daniel Bachman and Rumki Majumdar in Deloitte Insights (www2.deloitte.com/insights/us/en/economy/us-economic-forecast/united-states-outlook-analysis.html).
- See “When Your Adviser Can’t Be Trusted” by Karen Blumenthal in the Wall Street Journal (online.wsj.com) and “Can You Trust Your Financial Adviser?” by Liz P. Weston on MSN Money (moneycentral.msn.com).
- See “The Incredible Shrinking Fee” by Jonathan Burton in the Wall Street Journal (online.wsj.com) and “ETF Investors Win as Fund Firms Fight to Cut Fees” by Jonathan Burton at marketwatch.com.
- See TD Ameritrade’s “Advisor Index Survey” available at amtd.com.
- See TD Ameritrade’s “Lessons Learned in the Aftermath of the 2008–2009 Economic Recession Survey” available at amtd.com.
References
Barnes, James G. 1997. “Closeness, Strength, and Satisfaction: Examining the Nature of Relationships Between Providers of Financial Services and Their Retail Customers.” Psychology and Marketing 14 (8): 765–790.
Beckett, Antony, Paul Hewer, and Barry Howcroft. 2000. “An Exposition of Consumer Behavior in the Financial Services Industry.” International Journal of Bank Marketing 18 (1): 15–26.
Black, Kenneth Jr., Conrad S. Ciccotello, and Harold D. Skipper Jr. 2002. “Issues in Comprehensive Personal Financial Planning.” Financial Services Review 11 (1): 1–9.
Ciccotello, Conrad, C. Terry Grant, and Mark Dickie. 2003. “Will Consult for Food! Rethinking Barriers to Professional Entry in the Information Age.” American Business Law Journal 40 (4): 905–940.
Dean, Lukas R. 2010. “Clients, Commissions, and Potential Conflicts of Interest: Registered Investment Advisers in the U.S.” Academy of Financial Services Proceedings.
Dean, Lukas R., and Michael S. Finke. 2012. “Compensation and Client Wealth among U.S. Investment Advisors.” Financial Services Review 21 (2): 81–94.
Dimmock, Stephen G., and William Christopher Gerken. 2011. “Finding Bernie Madoff: Detecting Fraud by Investment Managers.” SSRN.
Finke, Michael S., Sandra Huston, and William Waller. 2009. “Do Contracts Impact Comprehensive Financial Advice?” Financial Services Review 18 (2): 177–193.
Grewal, Dhruv, and Howard Marmorstein. 1994. “Market Price Variation, Perceived Price Variation, and Consumers’ Price Search Decisions for Durable Goods.” Journal of Consumer Research 21 (3): 453–460.
Hung, Angela., Noreen Clancy, Jeff Dominitz, Eric Talley, Clause Berrebi, and Farrukh Suvankulov. 2008. “Investor and Industry Perspectives on Investment Advisers and Broker-Dealers.” RAND Institute for Civil Justice, sponsored by the SEC. Available at sec.gov/news/press/2008/2008-1_randiabdreport.pdf.
Inman, J. Jeffrey, and Marcel Zeelenberg. 2002. “Regret in Repeat Purchase versus Switching Decisions: The Attenuating Role of Decision Justifiability.” Journal of Consumer Research 29 (1): 116–128.
Jensen, Michael C., and William H. Meckling. 1976. “Theory of the Firm: Managerial Behavior, Agency Costs, and Ownership Structure.” Journal of Financial Economics 3 (4): 305–360.
Jones, Michael, David L. Mothersbaugh, and Sharon Beatty. 2000. “Switching Barriers and Repurchase Intentions in Services.” Journal of Retailing 76 (2): 259–274.
Kahneman, Daniel, Jack L. Knetsch, and Richard H. Thaler. 1991. “The Endowment Effect, Loss Aversion, and Status Quo Effect: Anomalies.” Journal of Economic Perspectives 5: 193–206.
Kahneman, Daniel, and Amos Tversky. 1984. “Choices, Values, and Frames.” American Psychologist 39 (4): 341–350.
Landman, Janet. 1987. “Regret and Elation Following Action and Inaction.” Personality and Social Psychology Bulletin 13 (4): 524–536.
Maynes, E. Scott, and Terje Assum. 1982. “Informationally Imperfect Consumer Markets: Empirical Findings and Policy Implications.” Journal of Consumer Affairs 16 (1): 62–87.
Mitchell, Vincent-Wayne, and Mitchell Greatorex. 1993. “Risk Perception and Reduction in the Purchase of Consumer Services.” Service Industries Journal 13 (4): 179–200.
Palmer, Adrian, and David Bejou. 1995. “The Effects of Gender on the Development of Relationships Between Clients and Financial Advisers.” International Journal of Bank Marketing 13 (3): 18–27.
Samuelson, William, and Richard Zeckhauser. 1988. “Status Quo Bias in Decision Making.” Journal of Risk and Uncertainty 1: 7–59.
Sitkoff, Robert. 2014. “The Fiduciary Obligations of Financial Advisers under the Law of Agency.” Journal of Financial Planning 27 (2): 42–49.
Stigler, George J. 1961. “The Economics of Information.” Journal of Political Economy 69 (3): 213–225.
Thaler, Richard. 1980. “Toward a Positive Theory of Consumer Choice.” Journal of Economic Behavior & Organization 1 (1): 39–60.
Citation
Dean, Lukas R., Nathan Harness, and Jared Pickens. 2019. “Examining Asset Flows and Type of Adviser Compensation After an Economic Downturn.” Journal of Financial Planning 32 (3): 48–56.