Journal of Financial Planning: March 2016
Robert Dubil, Ph.D., is an associate professor and lecturer of finance at the University of Utah. He is the author of Financial Engineering and Arbitrage in the Financial Markets and has written articles on the use of callable bonds, ETFs, and protective collars in personal investing.
Executive Summary
- The diminished liquidity in corporate and municipal bond markets since 2008 does not hurt but rather presents opportunities for individual investors.
- The corporate bond market has become more volatile, as dealers hold less inventory and more issues are concentrated in long-term portfolios of large asset managers. However, the bid-ask spreads have not increased.
- The wild swings in prices cause bonds of the same issuers with the same credit ratings to trade at different prices. Individual investors have frequent chances to lock in yields well above the mid-trend line. Yield-to-maturity differentials between the best offers and the worst offers of 83 basis points and price differentials of up to 11 percent are documented for GE bonds in August 2015. The differentials are equally large in Verizon and Bank of America bonds.
- Bargains are ubiquitous. Their preponderance is unrelated to the maturity or the liquidity of the bonds (bid-ask, ask quantity) and is weakly correlated with the coupon level and the use of discontinued issuer names (Bell South for Verizon, or Merrill Lynch for Bank of America, for example).
Many upper-income investors buy individual corporate and municipal bonds rather than bond funds or ETFs. Post-2008, the bond markets have become more transparent, but much less liquid. This has created a transparent but strangely fragmented market that resembles that for consumer products. Bargains abound, sometimes in small quantities, bonds go “on sale,” and close substitutes trade at different prices.
The analysis in this paper shows that bargains truly exist. The yield-to-maturity pickups and price discounts in markets for the same corporate bonds were measured, and some causes explored. The analysis shows that, at any given time, an investor could be paying up to 5 percent more or 5 percent less than the fair value of the bond. The analysis also shows that the deals tend to be in premium bonds and in discontinued corporate names.
Liquidity Erosion in Corporate Bond Markets 2009–2015
A fixed-income allocation belongs in every investor’s portfolio. Lower net worth investors typically hold bond funds or ETFs. Higher net worth investors are more likely to hold bonds individually. The advantages to owning individual bonds include precise cash need date targeting, as well as reinvestment risk management through laddering and reallocation. Bond funds and ETFs, while offering instant diversification and low cost, do not have fixed maturities and are managed to an approximate duration target. Bond funds can suffer from excessive inflows and outflows that engender tax and performance consequences on buy-and-hold investors.
Individual bonds have become much cheaper to trade in recent years. Commissions have dropped to $2 per bond. Many brokers have no fees for Treasuries, new issues, or for accounts with larger balances. The price setting in the bond markets has become more transparent. All bond trades (prices and quantities) are reported on the Trade Reporting and Compliance Engine (TRACE), and trades are marked as dealer- or customer-initiated, allowing small investors to observe the depth of the market and the markups over the wholesale prices. Brokers offer clients easy access to the TRACE data and to deal documentation.
In the post Dodd-Frank era, corporate bond markets have become extremely thin. This has happened just as many investors, scared by the stock market crash of 2008, have jumped into bonds with both feet. Barley (2015) reports that according to Bank for International Settlements (BIS) statistics, in Q4 2014 only $11 billion of corporate bonds were available to trade in dealers’ inventory on an average day, out of the total $7.84 trillion of U.S. corporate debt outstanding at the end of Q4 2014, according to 2015 SIFMA statistics (www.sifma.org/research/statistics.aspx). The percentage of issues with more than 50 percent of the total outstanding available to trade dropped to only 5 percent from 20 percent a decade earlier. Also according to 2015 SIFMA statistics, the daily trading volume of corporate bonds stood at $24 billion in Q1 2015, versus $535 billion for U.S. Treasuries. The total U.S. bond market is at $39 trillion as of Q4 2014. New issuance of corporate debt is running at $121 billion a month, versus $27 billion in equities as of Q1 2015.
Two factors are generally attributed to the diminished willingness of bond dealers to carry large trading inventories. First, Dodd-Frank prohibits proprietary trading, and this has caused many banks and broker-dealers to exit the business. Second, Comprehensive Capital Analysis and Review (CCAR) and Liquidity Coverage Ratio (LCAR) tests of regulatory capital give banks strong disincentives to dedicate capital to support trading operations in general. The new LCAR regulations are widely quoted as making banks refuse corporate cash deposits as they have to be supported 100 percent by cash or T-bills on the balance sheet. Carney (2015) shows large declines in for-sale inventory held by dealers starting in Q1 2009.
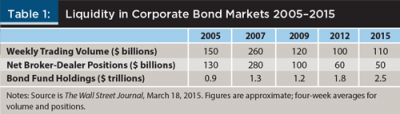
The result of long-term investors’ increased interest in corporate bonds and the banks’ unwillingness to support trading is shown in Table 1, based on Whittall and Samuel (2015). Bond ETFs and mutual funds have trapped more and more bonds, from $0.9 trillion in 2005 up to $2.5 trillion in 2015 (while the share of ETFs is growing, 90 percent are mutual funds). Trading volumes grew from $150 billion in 2005 to $260 billion in 2007, but then dropped to $120 billion in 2009 and stayed roughly level through 2015. Dealer inventories have plummeted from $280 billion in 2007 to $50 billion in 2015.
Interestingly, the drop in trading volumes has led to a more level playing field between bond dealers and individual investors. Dealers used to oppose price transparency in order to charge retail markups. Nowadays, they need funds and individuals in the wholesale market if they are to manage their inventory.
Research has been slow to keep up with the changing liquidity of the markets. Cai, Han, and Li (2012) show that hedge fund strategies exhibit significant herding behavior both on the buy and sell side. Herding appears to be strong in illiquid bonds. Buy-and-sell herding leads to significant price reversals over months and quarters. The effect in bond markets is much stronger than in the equity markets.
Edwards, Harris, and Piwowar (2007) document that the majority of the bond trading volume comes from institutions and funds. As of 2010, 75 percent of all outstanding bonds were held by institutions. Odd lots trade alongside larger quantities, and bond issues come in to trade at random times. The availability of many issues is being driven by the rebalancing of buy-and-hold institutional and retail customers. A thin order book and herding by large price-setting players inevitably lead to a higher realized volatility of the market.
Apart from a few empirical studies, there are no specific theoretical models of the bond market microstructure. In financial economics, the standard model for thin, decentralized markets is one with informed rent-seeking and uninformed traders that goes back to Kyle (1985). There is one fundamental difference between that model and the corporate bond market. Instead of one traded security—the stock—we often have multiple substitutable securities—bonds of the same issuer with similar maturity. The noise traders, while they are on the wrong side of the information asymmetry, can price shop, choose cheaper substitutes, and reduce the information rents.
There is no agreement in the literature on how to measure liquidity in bond trading. Empirical studies are largely limited to (deep) U.S. Treasury markets. Longstaff (2004) studies the spread between Resolution Funding Corp. (RefCorp) bonds and Treasuries, both guaranteed by the U.S. government. He finds a significant flight-to-safety spread premium for Treasuries.
Adrian, Fleming, Stackman, and Vogt (2015) examine the two-, five- and 10-year U.S. Treasury market over the 2005–2015 period, which includes the financial crisis, taper tantrum, and flash rally episodes. They used four measures of liquidity in high-frequency data.
According to the first measure, bid-ask spreads are narrow and stable. The bid-ask spread on the two-, five- and 10-year Treasuries, respectively, held at 2/256ths, 2/256ths, and 4/256ths, for most of 2005 to 2008, spiked to 2.5/256ths, 4/256ths, and 8/256ths at the end of 2008, then quickly dropped down to the pre-crisis levels of 2/256ths, 2/256ths, and 4/256ths in 2009–2015.
However, the second measure of liquidity, the (order book) depth that recovered after the 2008–2009 crisis declined markedly in 2013–2014. The third measure, the price impact per $100 million net order flow, increased during the crisis and during subsequent liquidity events.
The last measure, the trade size, has definitely declined over time. The trade size of the five- and 10-year Treasuries was in the $5 million to $7 million range in 2005–2007, then dropped to the $2 million to $3 million range in 2009–2015. The trade size of the two-year Treasury fluctuated more, but also declined from the $15 million to $25 million range in 2005–2007 to the $5 million to $15 million range in 2009–2015.
Hu, Pan, and Wang (2013) studied how the shortage of arbitrage capital allows Treasury yields to deviate freely from the curve, resulting in noise in prices. They fit yield curves over four-year intervals of 1987–2011 and proposed a noise measure of liquidity defined as the average of squared deviations of the actual yields from the Svensson (1994) model yields. This approach is similar to the exercise conducted in this paper of computing positive and negative deviations from a polynomial curve fit.
There is even less agreement in the literature on how to measure liquidity in thinner corporate bond markets.
The Study Group of the Bank for International Settlements chaired by Beau (2014) identifies seven liquidity trends in bond trading: (1) sovereign bonds are liquid while corporates are not; (2) dealers’ capacity and willingness for risk-taking has declined; (3) market makers focus only on core clients when absorbing larger quantities; (4) proprietary trading by banks has gone away or shifted to other entities; (5) increased concentration in asset managers requiring more immediacy services; (6) stress on execution platforms from trade execution strategies by portfolio managers; and (7) market fragmentation between electronic platforms capturing smaller sizes and dealer networks for larger size. The study documents the rise in net dealer positions in U.S. Treasuries from –$150 billion to $50 billion, and a decline in corporates from $190 billion to $50 billion over 2007–2014. The study also documents the rise in ETF and mutual bond fund holdings from $3.1 trillion in 2008 to $7.3 trillion in 2014, with the 20 largest asset managers accounting for $4 trillion. More bonds are trapped in funds, and the funds are larger and more concentrated, while the trading and market making has declined.
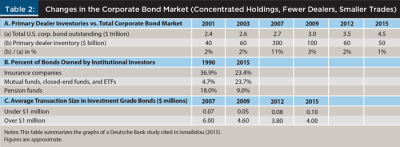
Ismailidou (2015) cites a Deutsche Bank study on how the Volcker Rule harmed the bond market. The study’s graphs are summarized in Table 2. The table shows that although the total corporate bond market grew from $2.4 trillion in 2001 to $4.5 trillion in 2015, primary dealer inventories first grew from $40 billion in 2001 to $300 billion in 2007, and then plummeted to $60 billion in 2012 and $50 billion in 2015. Meanwhile, the percentage of bonds owned by passive funds, active funds, and ETFs exploded from 4.7 percent in 1990 to 23.7 percent in 2015, surpassing insurance companies and pension funds. Also, the average transaction size increased in small trades (under $1 million), but decreased in larger trades (over $1 million). The outcome is a market more concentrated in the hands of buy-and-hold funds, with fewer wholesale dealers supporting trading, and smaller transaction sizes.
Mather, Kiesel, and Worah (2015) state that transactional liquidity remains intact: new corporate issuance of very large size is getting placed without disturbing the market. The market gets irrational and moves more than it should—both on the upside and on the downside. These authors see this increase in “jumpy” pricing as presenting opportunities for investors, able to buy on declines and sell on sharp rises, without incurring spikes in the bid-ask spread.
Data and Methodology
Bid and ask prices on investment-grade corporate bonds were collected on several days during the first three quarters of 2015. The source is Bloomberg’s BondDesk software that underlies many brokerage platforms, including Vanguard and Zions Direct. The application shows the entire limit-order book for each bond issue. On most days, one can find more than 8,000 corporate bonds rated Baa3/BBB– or above with maturities of one to 30 years available to trade. The limit-order book is indicative not firm, yet the vast majority of prices are actionable.
Data was collected for 19 S&P 100 corporations that had multiple bond issues outstanding at the same time. Floating-rate, near call, and bid-only issues were discarded. The offer-side yield to maturity on each bond was computed, and the yields against maturities for each issuer were graphed. A few issuers had tens or hundreds of issues and multiple bonds of almost the same maturity. A cubic polynomial was fitted through all the yields to come up with the issuer’s mid-yield curve. The equations are shown in subsequent figures (the precise mid-curve locus is unimportant; relative differences of nearby points are shown). Then, the yield difference from the fitted curve was computed. Finally, based on the modified duration (percentage price sensitivity to unit change in yield) of each bond, the price premium (discount) relative to the fitted fair value was determined.
In the absence of bargains, you would expect the yield differences from the mid-curve to be negligible. You would not expect any percentage price differences either. What this analysis found is quite surprising, and the results are similar across issuers and days in the dataset. To bring out the main points, results for just three issuers for one date (August 4, 2015) are shown.
Yield/Price Bargains in the Corporate Bond Market: General Electric
On August 4, 2015, there were 417 General Electric bonds bid/offered. After deletion, the dataset contained offer prices for 300 fixed-coupon bonds issued either by the parent, General Electric, or the subsidiary, General Electric Capital Corp. Because GE Capital represented 40 percent of GE, both legal entities were rated the same A1/AA+. Figure 1 shows the individual bonds and the fitted yield curve for GE.
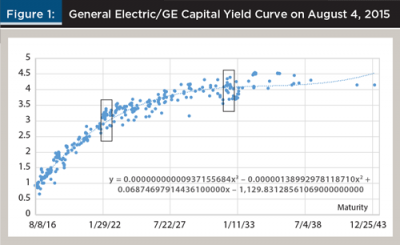
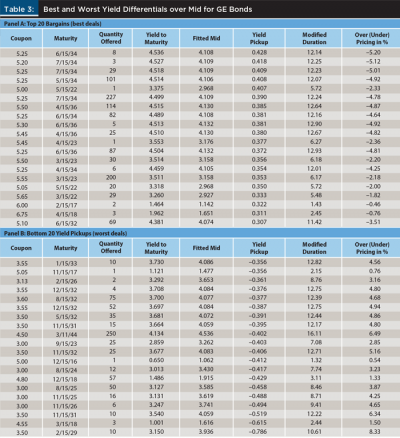
There is a wide range of offer yields around the fair yield. For a 2032 maturity, highlighted in Figure 1, an investor could lock in a yield close to 4.5 percent, or as little as 3.5 percent. Table 3 shows the top 20 (best deals) and bottom 20 (worst deals) yield differentials relative to the fitted yield curve. Table 3 displays the coupon and the maturity of each bond, the quantity offered, the yield to maturity, the fitted curve point for that maturity, the difference between the offered yield to maturity and the fit, the modified duration, and the percent price difference between the actual offer and the fit.
The interpretation of Table 3 is simple. An investor could purchase a 5.1 percent coupon of 6/15/2032 (last bond in Panel A) to lock in a yield to maturity of 4.381 percent and a 3.51 percent price discount relative to mid-trend. Or, the investor could purchase a 3.6 percent coupon of 8/15/2032 (fifth in Panel B) to lock in a yield to maturity of 3.700 percent and a 4.68 percent price premium relative to mid-trend. The two bonds have almost the same maturity and duration (the better one has actually lower modified duration risk), and are issued by the same legal entity. The total price difference is more than 8 percent.
Market Factors Affecting the Yield Differentials in the Corporate Bond Market
What can explain such incredible price differences? First, we examine the characteristics of the bonds themselves. Panels A and B of Figure 2 show scatter plots and two single-variate ordinary least squares regression lines of the yield pickup percentage (dependent variable) versus the coupon rate and the maturity of the bond (independent variables).
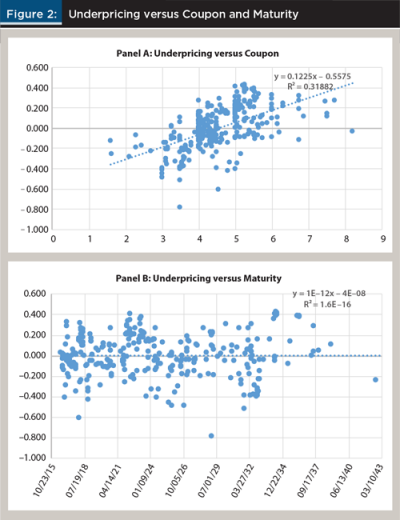
Panel A shows a weak but significant and positive relationship between coupon rate and the yield difference. Panel B shows no relation of the yield difference to the maturity of the bond. A high coupon rate relative to the yield to maturity translates into price premium.
The analysis seems to suggest that investors willing to buy premium bonds (trade more credit but less interest rate risk, taxable capital loss rather than gain) enjoy a slight yield advantage, on average.
Next, we turn to the liquidity conditions. Panels A and B of Figure 3 show the scatter plots and single-variate ordinary least squares regression fits of the yield deviations from the yield curve fit (dependent variable) versus the bid-ask spread (in yield), and the ask quantity of bonds available for sale (independent variables). Both relationships are very weak with insignificant R2s.
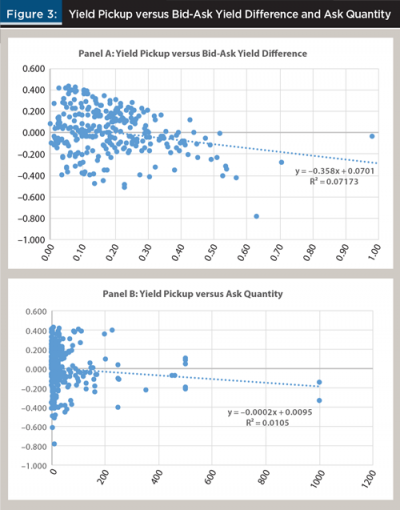
What is important to observe in Figure 3 is that a lot of both good and bad deals correspond to the same level of the bid-ask spread and depth of the offer side. What this suggests is that whether we observe good or bad deals has no relation to the security’s liquidity. In fact, in Figure 3, extremely low liquidity (outliers to the right) correspond to bad deals (negative yield pickups). This gives further evidence to the view of Mather et al. (2015) that thin markets present opportunities rather than hurt investors, and individual bond prices (both bid and ask) fluctuate more than the fundamentals would dictate.
Bargains in Bank of America and Verizon Bonds: Premium for Discontinued Corporate Names
On August 4, 2015, 61 bonds were guaranteed by Verizon Corp., and 256 bonds were guaranteed by Bank of America Corp. (BofA). After deletions, the dataset had 53 Verizon and 138 BofA bonds. All but two Verizon bonds were Baa1/BBB+ rated. Almost half of BofA bonds were Baa1/BBB+ and another half were Baa1/A– rated. Verizon Corp. had bonds that had been issued under the names of Verizon, GTE Florida, GTE California, GTE Corp., or state Bell companies. All of those entities became Verizon in 2000 when Bell Atlantic merged with GTE. Verizon also formed a 55/45 joint venture named Verizon Wireless with Vodafone. Vodafone was paid off in 2013 and the venture was dissolved. There were no Verizon Wireless bonds in the dataset.
Bank of America had bonds under the names Bank of America, NationsBank, Merrill Lynch, Fleet Bank (only two bonds), and Countrywide (bid-side only, deleted from data).
Figure 4 shows Verizon bonds. Panel A has all the bonds guaranteed by Verizon. Panel B excludes bonds issued by GTE or Bell (or individual state Verizon) entities.
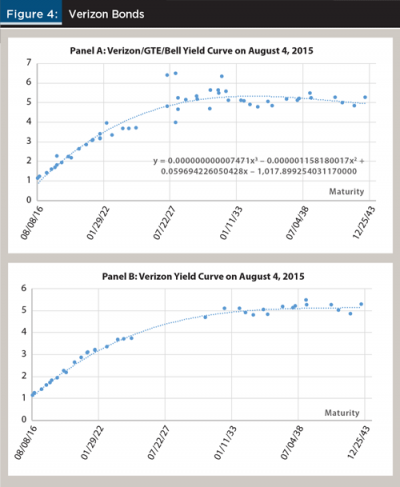
Panel B shows much less yield variation relative to the full yield curve of all obligors. One important observation is that not only the best but also the worst bonds are missing in the mid part of the curve.
To further investigate this “name effect,” the analysis was repeated with Bank of America bonds. Figure 5 combines pure Bank of America name bonds with Merrill Lynch and NationsBank bonds. Unlike with Verizon, here the discontinued names are all bargains with yields above the fitted trend line.
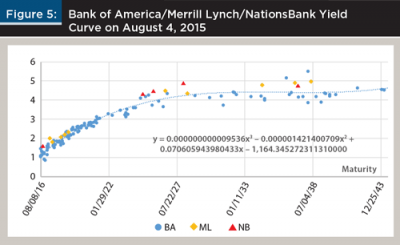
Figure 5 suggests that there may be a name preference effect to bond pricing. As Merrill Lynch was bought by Bank of America in the heat of the financial crisis of 2008, there may be a perceived demerger risk associated with that name. NationsBank is clearly a fully integrated legacy name following the takeover of Bank of America of San Francisco by NationsBank of Charlotte.
Similar small yield effects, not reported here, can be observed for other companies on the rare dates when both the new corporate and the disused names trade (for example, Target and Dayton Hudson; AT&T and Pacific Bell; or Century Link, Qwest, and U.S. West).
Summary: How to Shop for Corporate Bonds
This analysis demonstrates that when buying corporate bonds, investors should hunt for bargains the same way they shop for computers, kitchen equipment, or real estate; otherwise they may leave money on the table. In consumer goods, item descriptions and prices for similar products can be easily compared online. Those prices fluctuate over time and relative to each other.
This analysis shows that prices for bonds with very similar characteristics (same credit, close duration) can also trade at very different prices. The top-minus-bottom yield to maturity difference can be almost 1 percent, and the price differential can exceed 10 percent. Because most individuals are buy-and-hold investors, 1 percent extra compounded return is economically very significant. Long-term investors should carefully examine the entire yield curve of an issuer before buying. They should pick those bonds whose yields place above the mid-offer line.
Once the bonds are sold out, they often disappear from the market as they are held by institutional buy-and-hold participants: bond funds, ETFs, pensions, and insurance companies. For larger issuers, the exit risk—if bonds have to be sold prior to maturity—appears to be low. The bid-ask spread does not seem to be related to the terms of the bond or whether the bond is traded at a discount.
The larger price discounts from mid are not confined to, but tend to be related to, a higher coupon rate, which tends to favor premium bonds. The price and yield differentials from the mid are unrelated to the maturity or the liquidity (bid-ask, depth measured by the quantity offered) of the bond. They are not limited to, but appear to be correlated with the use of discontinued corporate names.
References
Adrian, Tobias, Michael Fleming, Daniel Stackman, and Erik Vogt. 2015. “Has U.S. Treasury Market Liquidity Deteriorated?” Liberty Street Economics, a blog of the Federal Reserve Bank of New York. LibertyStreetEconomics.NewYorkFED.org (August 17).
Barley, Richard. 2015. “Liquidity Specter Haunts Corporate-Bond Markets.” The Wall Street Journal (January 11).
Beau, Denis (Chair). 2014. “Market-Making and Proprietary Trading: Industry Trends, Drivers and Policy Implications.” Bank for International Settlements Committee on the Global Financial System (CGFS) Paper No. 52 (November).
Cai, Fang, Song Han, and Dan Li. 2012. “Institutional Herding in the Corporate Bond Market.” Board of Governors of the Federal Reserve System, International Finance Discussion Papers No. 1071 (December).
Carney, John. 2015. “Bond Markets Left High and Dry.” The Wall Street Journal (March 18).
Edwards, Amy K., Lawrence E. Harris, and Michael S. Piwowar. 2007. “Corporate Bond Market Transaction Costs and Transparency.” The Journal of Finance 62 (3): 1421–1451
Hu, Grace Xing, Jun Pan, and Jiang Wang. 2013. “Noise as Information for Illiquidity.” The Journal of Finance 68 (6): 2341–2382.
Ismailidou, Ellie. 2015. “Did the Volcker Rule Really Harm the Bond Market?” MarketWatch.com (August 18).
Kyle, Albert. 1985. “Continuous Auctions and Insider Trading.” Econometrica 53 (6): 1315–1335.
Longstaff, Francis A. 2004. “The Flight-to-Liquidity Premium in U.S. Treasury Bond Prices.” Journal of Business 77 (3): 511–526.
Mather, Scott, Mark Kiesel, and Mihir Worah. 2015. “A Look at Bond Market Liquidity.” Barrons.com sponsored content by PIMCO (August 24).
Svensson, Lars E.O. 1994. “Estimating and Interpreting Forward Interest Rates: Sweden 1992–1994.” National Bureau of Economic Research Working Paper No. 4871.
Whittall, Christopher, and Juliet Samuel. 2015. “Investors Raise Alarm over Liquidity Shortage.” The Wall Street Journal (March 18).
Citation
Dubil, Robert. 2016. “Investment Bargains in Corporate Bond Markets?” Journal of Financial Planning 29 (3): 52–59.