Journal of Financial Planning: June 2019
Jesse B. Mackey is chief investment officer of 4Thought Financial Group Inc., an RIA and money manager that uses multi-method investing as the theoretical basis of client portfolio management.
Financial market history has traditionally been defined as an alternating progression of bull and bear markets. This is a convenient way for financial planners to describe the investing experience to clients, and it’s partially responsible for the belief that the best way to diversify an investment portfolio is to use an allocation split between stocks and bonds (as stocks do well in a stock bull market, and bonds may do comparatively better in a stock bear market).
However, labeling markets as either bull or bear may be an oversimplification of financial market realities. The addition of two other categories of market environment—wolf markets and eagle markets—reveals a greater complexity in market history and may have implications for the management of investment portfolios.
Throughout market history, investors have experienced an array of environments that did not fit neatly into the conventional categories of bull or bear. Although such environments have probably always existed, in the eyes of many professionals, they seemed increasingly prevalent since the 2008–2009 global financial crisis.
This was exemplified in an August 2010 Wall Street Journal article by Kristina Peterson in which Michael Purves, who was then chief market strategist at BGC Financial, used the term “wolf market” to describe an environment “characterized by a tight trading range, increased volatility, high stock correlations, and quick reversals.”1 While the definition of a wolf market I use in this column is slightly different from Purves’, the basic concept of increased volatility is the same. Additionally, since 2008, another environment has repeatedly reappeared; one that I call an eagle market, characterized by soaring asset prices with low volatility.
If we can go deeper in our understanding of market cycles by developing a four-environment perspective and communicate this knowledge effectively to clients, it may lead to greater client understanding of the performance of their portfolios, and thus higher client acquisition and retention rates during times of market stress or temporary periods of portfolio underperformance.
Markets Redefined
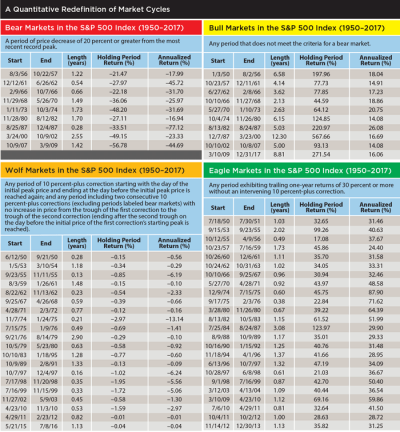
In this column, four post-crisis market environment definitions were applied to earlier market history data to understand their historical prevalence. Here are the strict quantitative definitions used for each market:
Bear market (declining stock prices): a period of cumulative price decrease of 20 percent or greater from the most recent record peak price.
Bull market (rising stock prices): any period that does not meet the criteria for a bear market (bull and bear markets are mutually exclusive by definition).
Wolf market (volatile/sideways stock prices): any period of 10 percent or greater downward price correction, starting with the day of the initial peak price and ending at the day before the initial peak price is reached again. Also, any period with two consecutive 10 percent-plus downward corrections (excluding periods defined as bear markets) with no increase in price from the trough of the first correction to the trough of the second correction (ending after the second trough on the day before the initial price of the first correction’s starting peak is reached).
Eagle market (rapidly rising stock prices with low volatility): any period exhibiting trailing one-year returns of 30 percent or greater without an intervening 10 percent or greater downward price correction.
Based on these definitions, the four market types can overlap with each other. With the exception of bear markets, the other three can occur simultaneously. Using this overlapping set of definitions, the wolf and eagle markets are subsets of the traditional bull market.
Market History Reexamined
The definitions above were applied to the price history of the S&P 500 Index from January 1950 to December 2017 (using the S&P 500 Price Return Index)2 in the tables above. Observations include:
There were nine bear markets in the S&P 500 in the 68 years from 1950 to 2017. These accounted for 11.57 years in total (17.01 percent of the history of the S&P 500 Index). The average length of a bear market was 1.29 years. The shortest was 0.28 years, and the longest was 2.55 years. The average cumulative drawdown (loss) per bear market was –35.83 percent, with the largest at –56.78 percent and the smallest at –21.47 percent. The average rate of loss during a bear market was –35.02 percent per year, with the steepest at –77.12 percent per year, and the shallowest at –16.94 percent per year.
There were 10 bull markets in the S&P 500 from 1950 to 2017. These accounted for 56.40 years in total (82.94 percent of the history of the S&P 500 Index). The average length of a bull market was 5.64 years. The shortest was 2.13 years, and the longest was 12.30 years. The average cumulative gain per bull market was 174.04 percent, with the largest at 567.66 percent, and the smallest at 44.59 percent. The average rate of gain during a bull market was 17.68 percent per year, with the steepest at 26.08 percent per year, and the shallowest at 14.08 percent per year.
There were 20 wolf markets in the S&P 500 from 1950 to 2017. These accounted for 15.27 years in total (22.46 percent of the history of the S&P 500 Index). The average length of a wolf market was 0.76 years. The shortest was 0.13 years, and the longest was 2.90 years. The average cumulative return per wolf market was –0.74 percent, with the highest at –0.01 percent, and the lowest at –2.97 percent. The average rate of return during a wolf market was –2.39 percent per year, with the steepest at –13.14 percent per year, and the shallowest at –0.01 percent per year.
There were 24 eagle markets in the S&P 500 from 1950 to 2017. These accounted for 26.89 years in total (39.54 percent of the history of the S&P 500 Index). The average length of an eagle market was 1.12 years. The shortest was 0.38 years, and the longest was 3.08 years. The average cumulative gain per eagle market was 44.49 percent, with the largest at 123.97 percent, and the smallest at 17.08 percent. The average rate of gain during an eagle market was 41.45 percent per year, with the steepest at 87.90 percent per year, and the shallowest at 24.40 percent per year.
When examining the data in the tables, consider that the traditional two-environment approach to market history analysis results in bear markets accounting for 17.01 percent of the history of the S&P 500 Index, and bull markets accounting for the remaining 82.99 percent of market history. But if we segment wolf and eagle markets as subcomponents of the bull market, we find that bear markets account for 17.01 percent, bull markets account for 82.99 percent, wolf markets account for 22.46 percent, and eagle markets account for 39.54 percent. The total exceeds 100 percent because we are double-counting the portion of the broader bull markets that overlap with eagle and wolf markets.
Under a mutually exclusive definition, in which only one of the four environments can occur at a time, bear markets account for 17 percent of market history, bull markets 24 percent, wolf markets 22 percent, and eagle markets 34 percent (3 percent is inconclusive). With this lens, wolf and eagle markets account for much of market history, regardless of whether the mutually exclusive or overlapping definitions are used.
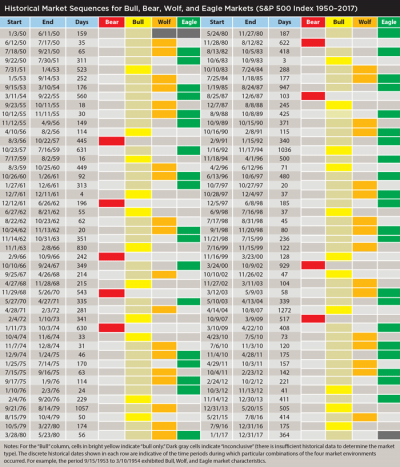
Market Sequences and Unpredictability
Knowing that the four market types can overlap with each other, their sequences through time were mapped, as shown in the second table above.
The sequence of the traditional two-market definition of market cycles is always the same based on the two environments’ mutual exclusivity (they always alternate bull, bear, bull, bear, etc.). However, the length of each bull and bear market is always different, making effective market timing extremely difficult.
If using the four-market redefinition, the sequence of bear, bull, wolf, and eagle markets has not always followed the same pattern, and they can overlap in a variety of combinations. This reveals greater complexity in market history and adds yet more unpredictability to timing market cycles.
The final time period listed in the tables (from Jan. 1, 2017 to Dec. 31, 2017) is “inconclusive” for eagle markets, demonstrating that we never know which type(s) of market environment we’re experiencing at any given time. We must wait until after the quantitative definition has been met before it becomes clear what type of environment we were in, and it’s unclear whether knowledge of the most recent environment type holds any predictive power. We should not expect to be able to consistently and accurately time a shift from one market environment to another.
Conclusion
Dividing market history into bear, bull, wolf, and eagle environments is useful as a step toward revealing the complexity and unpredictability of the financial markets, both for planners and their clients. When viewing market history as we have here, wolf and eagle markets account for much of the history. It follows, then, that if investments can be found that could be expected to perform well in these two additional environments, they should be utilized as components of an overall investment portfolio. Planners and portfolio managers might consider seeking out assets and/or methods of investing that have the potential to perform well in wolf and eagle markets.
Furthermore, if planning professionals can go deeper on their understanding of market cycles by developing a four-environment perspective and can communicate this knowledge effectively to clients, it may lead to greater understanding of the performance of their portfolios, less fear of the unknown, and therefore perhaps higher client retention rates during times of market stress or any periods of portfolio underperformance.
Endnotes
- See, “Not Bull, Not Bear: Meet the Wolf Market,” posted August 23, 2010. Available at wsj.com.
- Data source: Yahoo Finance for S&P 500 Price Return Index historical daily price data.
Author's note: For more information on this topic,visit www.4tfg.com/bear-bull-wolf-eagle-markets.