Journal of Financial Planning; June 2014
Michael Guillemette, Ph.D., is an assistant professor in the Department of Personal Financial Planning at the University of Missouri. Email author.
Michael Finke, Ph.D., CFP®, is professor and director of retirement planning and living in the Department of Personal Financial Planning at Texas Tech University. He is a contributing editor to Research Magazine. Email author.
Executive Summary
- Changes in average FinaMetrica monthly risk tolerance scores were evaluated during the January 2007 to May 2012 time period that spanned the global financial crisis.
- The research objective was to test whether fluctuations in equity returns influence average risk tolerance scores over time.
- A strong positive correlation (0.70) between average monthly risk tolerance scores and the S&P 500 was noted.
- The standard deviation for average monthly risk tolerance scores was relatively low (1.86 percent) compared to monthly S&P 500 values (17.27 percent).
- Average monthly risk tolerance scores increased as price/earnings ratios increased and decreased as dividend yields increased. Respondents became less risk tolerant as equity valuations became more attractive.
- Average risk tolerance scores demonstrated little monthly variation despite large swings in equity values during this time period. This suggests that individual risk tolerance scores are determined more by individual preference than external market forces.
Acknowledgement: The authors thank FinaMetrica for supporting the advancement of risk tolerance research. We are also grateful for contributions from Geoff Davey, Wade Pfau, Michael Kitces, and practitioners at the 2013 FPA Experience conference.
Assessing client risk tolerance is an essential part of the initial data gathering stage of the financial planning process. Accurate risk tolerance assessments can help financial planners make portfolio recommendations that clients are comfortable with during times of economic expansion and, perhaps more importantly, during economic downturns.
Few attempts have been made to investigate whether scores on proxy risk tolerance instruments used by planners are influenced by U.S. market returns. Large changes in magnitude can have important implications for planners if clients are assumed to be conservative because their risk tolerance is measured during a bear market, or aggressive if measured in a bull market.
The global financial crisis of 2008–2009 tested many investors’ willingness to own equities after experiencing a significant financial loss. In 2010, the portfolio allocation to risky assets declined to its lowest level in the history of the Survey of Consumer Finances for people under the age of 35 (Glumov 2013).
Individual investors lose, on average, 1.56 percent annually in dollar-weighted returns, because they tend to pull money out of equity mutual funds following a significant market decline when equity valuations are most favorable. Conversely, investors increase equity allocation following recent price increases when valuations are less favorable (Friesen and Sapp 2007).
The economic concept of risk aversion (the inverse of risk tolerance and the term more commonly used in economics) used in modern portfolio theory (MPT) is based on utility theory. More risk tolerant investors have a utility function that represents a greater willingness to accept investment risk for the same level of expected return. An investor who is risk averse is less willing to accept investment risk. According to MPT, risk aversion determines the optimal investor portfolio allocation between risky and risk-free assets (Markowitz 1952). A risk tolerance assessment instrument can provide an objective assessment of client risk tolerance and can be used to gauge market risk sensitivity when creating client portfolio recommendations.
Recent research provides evidence that risk tolerance can vary over time. Yao and Curl (2011) found evidence that risk aversion increased (decreased) when stock market returns decreased (increased) from 1992 to 2006. Sahm (2012) found that risk tolerance decreased with age and increased with an improvement in macroeconomic conditions from 1992 to 2002. Risk tolerance decreased substantially following the 2008 financial crisis in a sample of 1,686 Italian bank clients (Guiso, Sapienza, and Zingales 2013). Although risk tolerance decreased after the global financial crisis, it did not decline nearly as much as Dutch stock market returns (Hoffmann, Post, and Pennings 2013).
This study investigates the variation in average assessed risk tolerance scores during a unique period when equities experienced a historically wide swing in valuation. The research goal was to answer two questions about time-varying risk aversion. First, does measured risk tolerance of United States and Canadian individuals vary enough to impact portfolio recommendations during a bear market? This can provide planners with insight into whether assessed client risk tolerance is generally a stable preference, or if risk tolerance needs to be re-assessed over time. Second, do changes in measured risk tolerance correlate with market movements? If investors become more or less conservative in response to market valuations, planners can anticipate changes in client appetite for risk, and perceptions of the tradeoff between risk and return. These insights may also explain sentiment-driven equity demand that results in individual investor underperformance.
Literature Review
One explanation for variation in risk tolerance over time is excessive sensitivity to loss, explained in behavioral finance through prospect theory. According to prospect theory, individuals evaluate gains and losses from a reference point, such as an existing balance in an investment account. People are more sensitive to losses from this reference point than they are to gains to a degree that is inconsistent with neoclassical economic theory (Kahneman and Tversky 1979).
Benartzi and Thaler (1995) found that the large size of the historical equity premium can be explained if investors are loss averse and myopic by focusing too much on recent returns.
Thaler and Johnson (1990) found that individuals experience less dissatisfaction from losses after a prior gain and greater dissatisfaction after a prior loss. Their empirical finding implies that risk aversion is time varying. After stock prices rise, individuals should become less loss averse because prior gains will provide a cushion from subsequent losses. This is similar to a gambler who feels she can take greater risks after hitting the jackpot, because she is playing with “house money.” After stock prices fall below the reference point, further price declines should make individuals more loss averse.
Evidence suggests that investor sentiment and changes in risk tolerance are closely related. Closed-end fund discounts are one proxy for investor sentiment (Baker and Wurgler 2006, 2007; Lee, Shleifer, and Thaler 1991). When closed-end funds are discounted less, or are priced above net asset value (NAV), investors may be optimistic about future returns. Investors appear to exhibit positive sentiment after high recent stock returns, driving prices beyond fundamental values.
Conversely, negative sentiment resulting from recent price declines can have an even stronger impact on risk aversion, because investors are more sensitive to losses. Changing sentiment is a likely explanation for mean reversion observed in global equity markets. Poterba and Summers (1988) found evidence of mean reversion in stock returns. They stated that one possible explanation was “price fads” that caused stock prices to deviate from fundamental values. Investor sentiment, therefore, may drive changes in risk tolerance.
Another explanation for time varying risk aversion is that the perception of market risk changes over time, but that general investment risk tolerance is a static preference (Davies and Brooks 2014).
Weber, Weber, and Nosic (2013) found that risk attitudes of non-myopic investors seemed to be fairly stable between September 2008 and June 2009 when measured through a Likert scale response to the following question: “It is likely I would invest a significant sum in a high risk investment.” If investors perceive that the market is more risky during periods of turbulence, this may impact their willingness to accept market risk.
There is evidence that risk tolerance and risk perception move together. Gibson, Michayluk, and Van de Venter (2013) analyzed risk tolerance scores of 2,327 individuals immediately following the recent global financial crisis. They found lower risk tolerance among respondents who perceived the stock market to be riskier than it was two years ago. They also found a positive relation between risk tolerance and positive stock market expectations.
Greenwood and Shleifer (2014) documented the strong negative correlation between investor expectations of stock returns and recent returns for the S&P 500. Investors appear to change their expectations of the reward from taking risk based on recent changes in stock market returns. This time-varying change in perception of the risk/return tradeoff will reduce demand for investment risk following periods of recent negative performance. In other words, investors may be just as willing to invest in risky assets, but they may no longer be confident that the risk premium from owning stock is large enough to make equity investment attractive.
If risk tolerance is a generally stable preference, client risk tolerance assessment scores should not vary widely during periods of market turbulence. It is also possible that the perception of market risk will affect subjective client estimates of the risk/return tradeoff from equity investments. These changes in perceptions of market risks can directly impact demand for risky assets, particularly if investors are more sensitive to market losses.
Methodology
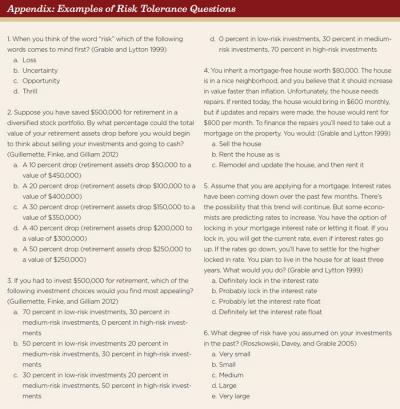
Average monthly risk tolerance scores (MRTS) that span the global financial crisis (January 2007 to May 2012) were provided by FinaMetrica, which creates and distributes a risk tolerance questionnaire that is widely used by financial planners. The risk tolerance survey includes 25 risk tolerance questions and has been psychometrically tested for validity and reliability. Examples of risk tolerance questions that are similar to the ones included in the survey are found in the appendix.
Scores from the risk tolerance questionnaire range from 0 to 100, with 0 being least risk tolerant and 100 being most risk tolerant. A total of 341,782 individuals were surveyed over the time period. The mean, median, and standard deviation of the number of people surveyed per month was 5,258, 4,853, and 1,337, respectively. The mean score was provided each month from individuals surveyed in the U.S. and Canada. The mean, median, and standard deviation of the scores over the time period was 52.96, 52.79, and 0.98, respectively. The monthly scores are normally distributed. No demographic or socioeconomic data were provided.
The monthly starting values of the S&P 500 were inflation adjusted using constant July 2013 dollars. Investor sentiment was measured using the University of Michigan’s monthly Consumer Sentiment Index (CSI). The CSI is based on approximately 26 questions that are asked to 500 participants in the continental U.S. The questions attempt to capture respondents’ present and future outlook for the U.S. economy. The index is normalized to have a value of 100 as of December 1964.
How Much Does Risk Tolerance Change?
The MRTS were separated into quintiles and compared to CSI levels from January 2007 to May 2012. Figure 1 illustrates the risk tolerance quintiles in relation to consumer sentiment. The correlation between MRTS and consumer sentiment was 0.67 over the time period. When consumer sentiment was most negative, respondents were the most risk averse. When consumer sentiment was the most positive, respondents were far more risk tolerant. When investors were more optimistic about the general economic climate, they were more willing to take investment risk.
Figure 2 displays the relation between MRTS and monthly S&P 500 prices from January 2007 to May 2012. There was a positive correlation of 0.70 between the S&P 500 and MRTS during the time span.
Figure 3 shows the relation between MRTS and the S&P 500 from January 2007 to the market bottom in March 2009. The correlation during the bear market was 0.90. Figure 4 illustrates the relation between MRTS and the S&P 500 from April 2009 to May 2012. The correlation during the recovery period was 0.01. Figures 3 and 4 are on a standardized scale with a mean of zero and a standard deviation of one.
It is important to emphasize that during the time period that spanned the global financial crisis, the change in magnitude was much greater for the S&P 500 compared to MRTS. The S&P 500 fell 51.70 percent from its high-to-low value, compared to 7.14 percent for MRTS.
Table 1 presents the standard deviations for the monthly starting values of the S&P 500 and MRTS from January 2007 to December 2011. The standard deviations for the S&P 500 ranged from a low of 2.20 percent in 2007 to a high of 15.86 percent a year later. The standard deviations for MRTS ranged from a low of 0.97 percent in 2007 to a high of 1.80 percent in 2009. The standard deviation for MRTS was 1.86 percent compared to 17.27 percent for the S&P 500 values from January 2007 to May 2012. Therefore, the relative dispersion around the mean for MRTS was relatively low compared to the S&P 500 over the time period.
Risk Tolerance, Equity Valuations, and Investor Underperformance
The loss of money, combined with loss aversion, may contribute to an increase in measured risk aversion during a market decline. Similarly, gains in a risky asset portfolio during a bull market can lead to the “house money” effect. After a few years of positive investment performance, accumulated gains increase an investor’s appetite for risk.
According to the capital asset pricing model, stock returns consist of the risk free rate and a risk premium. This risk premium is determined by the risk tolerance of investors. In periods where risk tolerance is higher, the premium required to induce investors to buy risky assets declines and asset prices rise. One would expect an increase in market risk tolerance to drive demand for risky assets, increase measures of valuation such as the cyclically adjusted price/earnings (P/E) ratio, and drive down the real dividend yield. Conversely, when investors become more risk averse, the risk premium may rise, reducing the demand for risky assets.
Figure 5 displays the relation between MRTS and P/E ratios from January 2007 to May 2012. Figure 6 shows the relation between MRTS and the dividend yield of the S&P 500 over the same time period. The mean is more sensitive to single observations than the median. The stock market crash occurred in MRTS quintiles one and two. Dividend yields spiked during a few of those months. This explains the disparity between the mean and median dividend yield values in Figure 6. The correlations between MRTS and the P/E ratios, and MRTS, and the S&P 500 dividend yield are 0.73 and –0.55, respectively. During the global financial crisis, individuals became more willing to take investment risk as equity valuations became less favorable.
The dividend yield has been found to predict excess future stock returns (Campbell and Shiller 1988; Fama and French 1988). Periods of higher P/E ratios (and lower dividend yields) in the equity market have been followed by lower future returns (Basu 1977).
Unfortunately, retail investors typically increase their equity allocations when P/E ratios are high. Mitchell and Utkus (2003) studied 2.3 million 401(k) plan participants at the Vanguard Group after a prolonged rise in equity prices in 1999 and after a three-year fall in equity prices in 2003. They found that participants who enrolled near the peak of the bull market in 1999 allocated approximately 70 percent of new contributions to equities in June of 2003. At the end of 1999, the P/E ratio of the S&P 500 was 43.77. Participants who enrolled during the first six months of 2003 only allocated 48 percent of new contributions to equities in June of 2003. The P/E ratio at the end of June 2003 was 24.86.
Implications for Financial Planners
This study was designed to answer two important questions about risk tolerance. First, are estimates of client risk tolerance biased by current market conditions? Second, is there evidence that observed changes in client risk tolerance are related to recent market movements? Results show that client risk tolerance estimates are relatively stable. The distance between the highest and lowest risk tolerance scores was 7.1 percent from January 2007 through May 2012. In comparison, the difference between the maximum and minimum S&P 500 values was 51.7 percent. Average monthly risk tolerance scores demonstrated modest variation despite large swings in equity values during this time period.
Even so, results indicate that risk tolerance scores are consistently lower (suggesting lower risk tolerance) immediately after a recent market decline. Average monthly risk tolerance scores were strongly correlated with changes in stock market conditions when equity prices fell between 2007 and 2009. Average monthly risk tolerance was also highly correlated with equity market P/E valuations. Planners should expect a client’s willingness to accept investment risk to be greatest when stock prices have recently risen, and fall when clients experience a loss. This suggests that clients exhibit time varying risk aversion, which is a phenomenon that can explain short-run volatility and long-run mean reversion in equity prices.
Evidence was found that risk tolerance increases when equity valuations are high (and the risk premium is low), and that individuals are most risk averse when equity valuations are most attractive. The implication is that clients may resist rebalancing into equities during market downturns. The relation between the appetite for risk and equity valuations may help explain both the decline in risky asset prices during a recession and the dollar-weighted underperformance of investors. Individual investors lose more than 150 basis points per year because they tend to buy equities during economic expansions and sell equities during recessions (Friesen and Sapp 2007).
Finally, evidence was found that individual risk tolerance is particularly sensitive to losses, especially when those losses occur in succession. This may be because a portfolio balance falls below a reference point—for example, last quarter’s balance. When the stock market is falling, average monthly investor risk tolerance scores are strongly correlated with changes in the S&P 500. However, when stock prices start to rise, changes in average risk tolerance seem to be largely uncorrelated with the market. Although data on the standard deviation of individual scores was not available, it is possible that a rising market is seen by some as a buying opportunity, while others remain more risk averse after recent losses. Additionally, when prices fall temporarily during a bull market, risk tolerance scores appear unaffected. This may occur if the account value is still well above a much lower reference point that was set during the early 2009 market nadir.
Results show that market movements are not likely to bias client risk tolerance scores. However, it is still important for financial planners to realize that a client’s appetite for risk may change in reaction to stock prices. Financial planners should be aware that clients will find equity investments less attractive during a bear market, particularly during a period of successive market declines.
The strong correlation between monthly returns and average risk tolerance can help explain why investors may be tempted to shift portfolios toward safety during a bear market. Employing a long-run strategy that reduces the temptation to buy high and sell low can be a significant source of value provided by a financial planner.
References
Baker, Malcolm, and Jeffrey Wurgler. 2006. “Investor Sentiment and the Cross Section of Stock Returns.” Journal of Finance 61 (4): 1645–1680.
Baker, Malcolm, and Jeffrey Wurgler. 2007. “Investor Sentiment in the Stock Market.” Journal of Economic Perspectives 21 (2): 129–151.
Basu, Sanjoy. 1977. “Investment Performance of Common Stocks in Relation to their Price Earnings Ratios: A Test of the Efficient Market Hypothesis” Journal of Finance 32 (3): 663–682.
Benartzi, Shlomo, and Richard H. Thaler. 1995. “Myopic Loss Aversion and the Equity Premium Puzzle.” Quarterly Journal of Economics 110 (1): 73–92.
Campbell, John Y., and Robert J. Shiller. 1988. “Stock Prices, Earnings, and Expected Dividends.” Journal of Finance 43 (3): 661–676.
Davies, Greg B., and Peter Brooks. 2014. “Risk Tolerance: Essential, Behavioural and Misunderstood.” Journal of Risk Management in Financial Institutions. April.
Fama, Eugene F., and Kenneth R. French. 1988. “Dividend Yields and Expected Stock Returns.” Journal of Financial Economics 22 (1): 3–25.
Friesen, Geoffrey C., and Travis R. Sapp. 2007. “Mutual Fund Flows and Investor Returns: An Empirical Examination of Fund Investor Timing Ability.” Journal of Banking & Finance 31 (9): 2796–2816.
Gibson, Ryan, David Michayluk, and Gerhard Van de Venter. 2013. “Financial Risk Tolerance: An Analysis of Unexplored Factors.” Financial Services Review 22 (1): 23–50.
Glumov, Dmitriy. 2013. “How Did the Great Financial Crisis Affect Portfolio Allocations and Attitudes towards Risk? Evidence from the Survey of Consumer Finances.” Social Science Research Network.
Grable, John, and Ruth H. Lytton. 1999. “Financial Risk Tolerance Revisited: The Development of a Risk Assessment Instrument.” Financial Services Review 8: 163–181.
Greenwood, Robin, and Andrei Shleifer. 2014. “Expectations of Returns and Expected Returns.” The Review of Financial Studies. Published online January 11.
Guillemette, Michael, Michael S. Finke, and John E. Gilliam. 2012. “Risk Tolerance Questions to Best Determine Client Portfolio Allocation Preferences.” Journal of Financial Planning 25 (5): 36–44.
Guiso, Luigi, Paola Sapienza, and Luigi Zingales. 2013. “Time Varying Risk Aversion.” NBER Working Paper No. 19284.
Hoffmann, Arvid O.I., Thomas Post, and Joost M.E. Pennings. 2013. “Individual Investor Perceptions and Behavior During the Financial Crisis.” Journal of Banking & Finance 37 (1): 60–74.
Kahneman, Daniel, and Amos Tversky. 1979. “Prospect Theory: An Analysis of Decision Under Risk.” Econometrica 47 (2): 263–291.
Lee, Charles, M. C., Andrei Shleifer, and Richard H. Thaler. 1991. “Investor Sentiment and the Close-end Fund Puzzle.” Journal of Finance 46 (1): 75–109.
Markowitz, Harry. 1952. “Portfolio Selection.” Journal of Finance 7 (1): 77–91.
Mitchell, Olivia, and Stephen Utkus. 2003. “Lessons from Behavioral Finance for Retirement Plan Design.” Social Science Research Network.
Poterba, James M., and Lawrence H. Summers. 1988. “Mean Reversion in Stock Prices: Evidence and Implications.” Journal of Financial Economics 22 (1): 27–59.
Roszkowski, Michael J., Geoff Davey, and John E. Grable. 2005. “Questioning the Questionnaire Method: Insights on Measuring Risk Tolerance from Psychology and Psychometrics.” Journal of Financial Planning 18 (4): 68–76.
Sahm, Claudia R. 2012. “How Much Does Risk Tolerance Change?” The Quarterly Journal of Finance 2 (4).
Thaler, Richard H., and Eric J. Johnson. 1990. “Gambling with the House Money and Trying to Breakeven: The Effects of Prior Outcomes on Risky Choice.” Management Science 36 (6): 643–660.
Weber, Martin, Elke U. Weber, and Alen Nosic. 2013. “Who Takes Risks When and Why: Determinants of Changes in Investor Risk Taking.” Review of Finance 17 (3): 847–883.
Yao, Rui, and Angela L. Curl. 2011. “Do Market Returns Influence Risk Tolerance? Evidence From Panel Data.” Journal of Family and Economic Issues 32 (3): 532–544.
Citation
Guillemette, Michael and Michael Finke. 2014. “Do Large Swings in Equity Values Change Risk Tolerance?” Journal of Financial Planning 27 (6): 44–50.