Journal of Financial Planning: July 2016
Gaobo Pang, Ph.D., CFA, is a senior vice president at Northern Trust Asset Management. He leads advanced analytics, develops and evaluates optimal strategies in the life cycle framework, and has a special focus on behavioral finance. He speaks at academic and practitioner meetings and has published extensively in leading peer-reviewed journals.
Executive Summary
- Discussions are often anchored at fees when investment offerings, such as target date funds, are being vetted for defined contribution plans.
- A decomposition of wealth accumulation over the life cycle demonstrates the foremost role of persistent savings and, on this foundation, the power of long-term investing.
- Mandating a fee cut can make plan participants better off, other things being equal, but the gain is diminishing once the fee is compressed to a fairly low level.
- Selecting or dismissing investment strategies based on fees in isolation, absent a holistic view, is likely a biased effort in helping workers prepare for retirement.
Fees are a major theme when investment offerings, such as target date funds (TDFs), are being vetted for defined contribution (DC) plans. Discussions are often anchored there, once fees come into play, and the subsequent bargaining may overshadow other important considerations.
Among its tips for ERISA plan fiduciaries, the U.S. Department of Labor suggests costs as the fourth factor to review, after understanding the fund’s investments.1 For plan sponsors, however, fee consideration is often singled out as the most critical step to improve their fiduciary positioning. The fear may well have been heightened by the recent “excessive-fee” suits, including the Supreme Court’s ruling in Tibble v. Edison International.2
Regarding retirement outcomes, how do fees measure up in connection with the contributions of saving and investing? This analysis ran simulations using historical data and decomposed account balances into these three factors. Considering representative earnings and savings profiles, the “market-neutral” S&P TDF Index, and a 25 basis points fee, the analysis showed that, on average, 68 percent of the worker’s wealth accumulation upon retirement can be attributable to savings, 38 percent to investing, and 6 percent negatively to fees.
Individual investment experiences vary, but this ordering of attributions held for the majority of cases, across various savings patterns, glide paths in TDFs, and levels of fees observable in the market. The results clarify that to get ready financially for retirement, the foremost force is rigorous savings on a persistent basis, and that the power of long-term investing (namely, compounding returns) builds on this foundation.
Plan participants benefit from a fee cut, other things being equal. For instance, sequentially cutting fees by 20, 10, 5, and 2 basis points would make the participant better off by 5.1 percent, 2.4 percent, 1.2 percent, and 0.5 percent of the account balance, respectively. The gain is diminishing once the fee is compressed to a fairly low level. Many acknowledge the unpredictability of market forces but perceive that they can control fees. Workers, however, cannot sail to retirement primarily by cutting fees, absent commitment to a long-term savings and investment plan.
A Brief Critique of the Literature
The literature emphasizes the significance of fees in reducing the account balance that would otherwise be available to plan participants. Munnell (2015) assumed additional fees totaling 100 basis points and stated that the fees reduced assets at retirement by about 20 percent over a 40-year period. Sharpe (2013) showed “dramatic” reductions for various time horizons by contrasting a high cost of 112 basis points to a low cost of 6 basis points. Bogle (2014) considered “all-in” expenses and assumed higher management expense ratios, transaction costs, sales loads, cash drag, and tax inefficiency on actively managed funds by a total of 221 to 266 basis points. Bogle concluded that low-cost index funds created extra wealth of 65 percent to 175 percent for retirement plan investors. These studies made the premises that the higher-cost option delivered no better investment returns. Other analyses, such as Ellis (2012), also delivered an acute stab at fees. According to Deloitte and the Investment Company Institute (2009), all-in fees averaged 93 basis points in defined contribution plans (172 basis points as the 90th percentile).
To demonstrate a payoff from a lower fee, many illustrations assumed a fee cut of 100 basis points or more and correspondingly assumed a sure boost of annual investment return by the equivalent size, without sacrifice in investment depth or services. A cut of 100 basis points or more, however, may be dramatic in institutional fee negotiations. Many analyses would nonetheless extrapolate this as a common size to expect.
The known literature is mute on where the fee level should settle as reasonable and how the fee effect evolves when fees are reduced, which is one of the highlights in this analysis. If mimicking a benchmark index by passively holding all the constituents is the best way to invest, shouldn’t fund managers race to the bottom of fees and charge no more than for just administrative services? Doellman and Sardarli (2016) struck the importance of avoiding excessive administrative fees.
Most studies looked at the fee effect by assuming a one-time savings (e.g., $10,000) and a constant investment return over a long horizon (e.g., 7 percent per annum), which is not a close approximation of typical savings and investment patterns over the life cycle. Retirement savings are often deposited into the plan regularly, dollar amounts differ, and their contributions to the final balance vary with the time duration and investment outcomes.
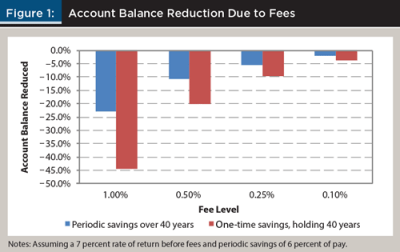
Factoring periodic savings into the fee assessments makes a difference. A 1 percent fee, for instance, reduces the account balance by nearly 45 percent if only a one-time savings is assumed over 40 years—a stark overestimate of fee erosion—in comparison with about 23 percent when periodic savings are considered in the calculations (see Figure 1). The discrepancy varies with fee levels.
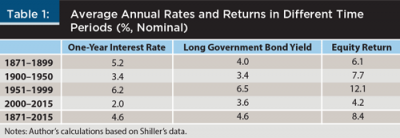
The aforesaid convenience of a 7 percent return, however, may not be easy to achieve and thus likely adds to the overestimation of the fee effect. Rates and returns were elevated particularly in the second half of the 20th century and were much reduced in the latest 15 years (see Table 1). It is a high-stake discussion whether the previous U.S. equity boon will repeat in the future and whether low yields since the 2008 Great Recession will well be the norm. This analysis was not positioned to make such predictions. Rather, without assuming a single secure return, it gave due reflection of uncertainties and incorporated actual, yet stochastic, historical realizations of returns. The analysis also examined various TDFs and dispersions of outcomes, and reoriented the fee discussion in the holistic context of saving and investing for retirement.
Analysis
This analysis ranked drivers for retirement outcomes by attributing account balances to saving, investing, and fees. The analysis was not intended to address whether the worker had saved adequately, which deserves a separate study.
Earnings profile. Consider a hypothetical yet representative worker profile based on the “medium” scaled factors, as used in the 2015 Social Security Trustees Report (Clingman and Burkhalter 2015). This “medium” worker has earnings similar to the national average wage in the recent 40 years and saves from age 25 until she retires at age 65. This earnings profile is applied to all simulations below. Only the rates of return experienced by this hypothetical worker vary.
Attribution to saving. At minimum, the worker can put her savings in a bank and accrue interest. Money market funds were often the default option for DC plans prior to the 2006 Pension Protection Act (PPA). This is a lower-risk approach, but it is probably not an effective way to grow assets for the long-term retirement purpose. Interest accrual here was assumed to be commensurate with the variable one-year certificate of deposit, which can be viewed as the lower bound to gauge the role of savings. The worker was assumed to save 6 percent of her salary each year.
Attribution to investing. The worker can alternatively invest her savings in a diversified portfolio, such as a TDF, which is the most popular default DC investment post PPA.3 The increment of wealth accumulation, on top of the above estimated role of savings, can be attributed to investing. TDFs seek higher returns by taking greater risk when workers are younger, because they have earnings as a cushion and they have a longer investment horizon to weather short-term volatilities. As the worker gets older, the risky proportion in the TDF gradually decreases so as to mitigate potential loss.
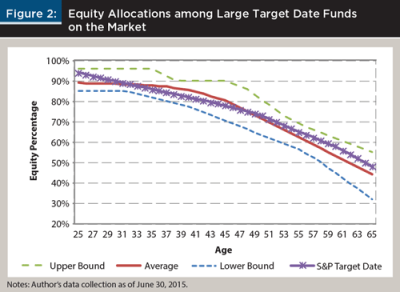
The worker was assumed to follow the S&P TDF Index glide path (see Figure 2), which largely reflects the market gravity, as indicated by its similarity to the average of eight large TDFs as of June 30, 2015. The upper bound (more aggressive) and lower bound (more conservative) of these glide paths will be considered later. Modelling TDFs in finer asset classes than the equity-bond simplification here would not overturn the general findings but would obfuscate the analysis.
Equity and fixed-income asset classes were proxied, respectively, by the S&P Composite Stock Price Index (500 large companies) and long-term government bonds, which were computed in Shiller (1990 and 2005) and updated until 2013. This analysis updated the data for 2014–2015, following Shiller’s methodology. The advantage of using these widely cited time series lies in their lengths (from 1871 till now), and reflections of many actual ups and downs in the history. It allows 106 draws of rolling 40-year experiences in stocks, bonds, and money market investments for this exercise.
Attribution to fees. Management expenses were a subtraction from plan participants’ wealth accumulation. Sponsors aim to select investment strategies that add value and more than offset the cost. Plan sponsors have the fiduciary duty to be conscious of fees. Let’s start with a 25 basis points management fee, which reflects common market practice, and consider higher and lower fees later on. The estimated detrimental effect of fees was compared with the effects of saving and investing.
Historical simulations. Wealth accumulations are impacted by market situations. A large number of simulations were run, using historical asset rates and returns, to estimate the possible outcomes. Figure 3 breaks down account balances upon retirement into each component, and Table 2 summarizes the range of attributions. Each observation is the outcome of a 40-year accumulation, with rolling draws from the 1871–2015 historical data (stochastic returns).
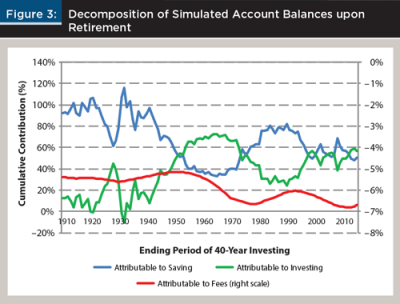
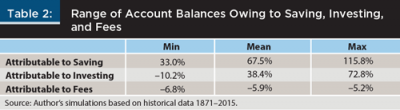
Over the simulations, savings accounted for 33 percent of the ending balance at the minimum, and 116 percent at the maximum. The former (low) number implicitly indicated great investment outcomes. Figures greater than 100 percent, to the opposite, indicated that investments turned out losing money—the worker would have been better off if all savings had been kept in interest-bearing bank deposits.
Correspondingly, the role of investing ranged from a negative 10 percent (ending in 1932) to a positive 73 percent (ending in 1965) of retirement wealth. Traveling back through time, the benefit of equity investing would be quite modest in the early 20th century, magnificent in the 1950s and 1960s, and lagging behind in the 1980s (one-year interest rates averaged 8.9 percent over 1970 to 1990).
For each simulated path of the participant’s career (not displayed individually here), savings was the backbone for wealth accumulation, predominately in the earlier years, and maintained its importance throughout the course. The impact of investing (i.e., the power of compounding returns) was more visible over the long run and started to exceed the contribution of savings in the worker’s 40s or later. The investment factor gathered momentum in later years, and it was also volatile. In fact, the few years leading up to retirement were critical for comparing the roles of saving versus investing. The role of investing was more likely to win out during an equity boom (e.g., by year 2000) and ceded to savings during a bust (e.g., 2008). This highlights the particular sequencing risk (or path dependence) of investment outcomes for near retirees.
On average, 67.5 percent of wealth accumulation was attributable to persistent savings, 38.4 percent to the diversified investing, and –5.9 percent to fees. In the order of importance for achieving retirement readiness, these statistics suggest that plan sponsors and participants should appreciate the fundamental role of saving and stick to it. Some pre-commitment mechanisms, such as the auto-escalation of savings rate, can likely help. Investment has risk, but its likelihood of accelerating wealth accumulation is overall greater than dragging it. That is in the spirit of the PPA authorizing TDFs as one of the qualified default investment alternatives (QDIAs). Despite market fluctuations, the effect of fees fell within a fairly narrow range, around 5 percent to 7 percent of the ending balance.
Alternative Scenarios
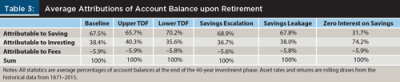
For robustness, alternative scenarios were analyzed. Following the upper bound of the glide paths available on the market (as plotted in Figure 2) would attribute a larger part of the pie to investing, and correspondingly a smaller portion to saving. Following the lower bound of TDFs would have the opposite effect. On average, the difference was only 2 to 3 percentage points from the baseline. Switching to a different TDF would barely change the size of the fee effect (see Table 3).
What did change was the dispersion of account balances across TDFs. With the more aggressive TDF, the biggest annual loss during the final five years before retirement would be $70,300, in contrast to $57,600 for the S&P TDF Index and $34,500 for the more conservative TDF (see Table 4). On the flip side, the higher equity exposure had a bigger upside potential. Workers at this career stage, however, are more likely concerned about the downside protection.

Alternatively, consider a case of escalating the savings rate gradually, by 0.5 percent a year, from 6 percent to 12 percent of salary and staying on that level until retirement. Also consider a highly simplified case of savings leakage where the worker is assumed to save zero dollars every five years apart. The results were not sensitive to these changes (see Table 3). The predominance of saving, followed by investing, was therefore not an artifact.
Gauging the role of savings, a one-year interest has thus far been assumed on it. One could assume zero interest on savings (such as in the extreme case of money under the mattress). This would measure the principal only, which is 32 percent of the account balance on average (see Table 3), and understates the role of savings. Savings can, at a minimum, be placed in some interest-earning bank accounts. The annualized one-year interest rates averaged 4.6 percent over 1871 to 2015.4 The U.S. three-month constant-maturity Treasury bills had an average interest rate of 4.2 percent over 1982 to 2015, according to the Federal Reserve. Stripping such interest off savings, thus attributing it to investing, overstates the role of investing (74 percent).
Effects of Incremental Fee Cuts
Consider a management fee of 78 basis points, an average among mutual funds.5 That would take away 19 percent of the account balance from participants, compared to a no-fee world (see Table 5). Plans can lower the expense by taking advantage of lower-cost investing vehicles such as collective investment trusts, which are exclusively for qualified retirement plans and generally have lower overhead.
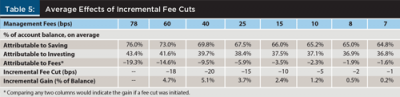
Lower fees would leave a bigger nest egg with the participant. Compared with the above, the effect of fees would be tamed by 4.7 percent of the account balance if the fee was 60 basis points. The participant would gain another 5 percent of the balance if the fee was 40 basis points. Plan situations and market competition dictate the feasibility of such significant fee cuts. Contrasting the attributions in any two columns of Table 5 indicates the potential gain if a suitable fee cut was initiated.
Management fees have declined significantly over time among actively and especially passively managed funds. The passive approach mimics a benchmark index by holding the same basket of securities and does not expect to outperform the benchmark by construction. Exploring the economies of scale and compressing managing fees is one way to yield a bigger share of the value to investors. Should plan sponsors demand further cuts? Sequentially cutting fees by 15, 10, 5, 2, and 1 basis point would benefit the participant by 3.7 percent, 2.4 percent, 1.2 percent, 0.5 percent, and 0.2 percent of ending balance, respectively. The gain of incremental fee cuts is diminishing.
These comparisons assume differences only in fees, all other things being equal. In practice, financial products and services differ. Ruling out potentially value-added products (including those actively managed) based on fees in isolation is a biased exercise of the fiduciary prudence. If an investment strategy is sound and has a great likelihood of offsetting the fees and generating excess returns (true “alpha”), disregarding it would not be in the best interest of plan participants. A better scrutiny of an investment strategy is whether it can deliver superior outcomes net of fees.
Conclusions
DC-type plans have become the dominant platform in the U.S. retirement landscape. 401(k)s, 403(b)s, IRAs, and the like held $14.2 trillion assets at year-end 2014, far exceeding the assets of any other types of plans.6 This aggregate number, although not telling of individual savings adequacy, highlights the increasing reliance upon DC plans to deliver retirement security.
This analysis revealed that such security hinges on savings levels and investment outcomes, plus a containment of the effect of management fees. Fees nonetheless have received what may be outsized fiduciary focus these days. Recent regulations have fixated much of plan sponsors’ attention to fees and media frenzy has fueled fear of litigation. Fee negotiations sometimes de facto serve to filibuster a holistic view of success factors for a retirement plan.
Lower fees are beneficial to plan participants, other things being equal. Fiduciaries are obligated to assess and negotiate fees. Yet, racing to the bottom of fees may detract fiduciary oversight of investment selections. A lower-cost mandate tends to entail easier-to-implement asset classes with less professional expertise and services necessary, and thus may forgo return opportunities if such route has insufficient exposures and diversifications among key areas and markets.
Sponsors may wish to zoom out at some point and defy the behavioral “familiarity bias” with fee bargaining, stress the fundamental role of savings to participants, and ensure uncompromised integrity in investment philosophy, portfolio construction, and execution. A holistic approach is likely the best way for sponsors to achieve their ultimate goal: helping their employees financially prepare for retirement and have an orderly workforce exit.
As the Department of Labor states in its August 2013 document “A Look At 401(k) Plan Fees:”
“… higher investment management fees do not necessarily mean better performance. Nor is cheaper necessarily better ... And, finally, don’t consider fees in a vacuum. They are only one part of the bigger picture including investment risk and returns and the extent and quality of services provided.” 7
Endnotes
- See the February 2013 DOL document “Target Date Retirement Funds—Tips for ERISA Plan Fiduciaries” at www.dol.gov/ebsa/pdf/fsTDF.pdf.
- Read more about the Tibble v. Edison International case on the SCOTUS blog at www.scotusblog.com/case-files/cases/tibble-v-edison-international.
- See Callan’s 2016 Defined Contribution Trends Survey at www.callan.com/research/files/1188.pdf.
- According to Shiller’s data based on six-month commercial papers and certificates of deposit.
- See Morningstar’s “2015 Target-Date Fund Landscape” by Janet Yang, Leo Acheson, Jeff Holt, Gretchen Rupp, and Kathryn Spica.
- According to the Investment Company Institute’s 2015 Investment Company Fact Book.
- View the full DOL document at www.dol.gov/ebsa/pdf/401kFeesEmployee.pdf.
References
Bogle, John C. 2014. “The Arithmetic of ‘All-In’ Investment Expenses.” Financial Analysts Journal 70 (1): 13–21.
Clingman, Michael, and Kyle Burkhalter. 2015. “Scaled Factors for Hypothetical Earnings Examples under the 2015 Trustees Report Assumptions.” Social Security Administration Actuarial Note No. 2015.3, available at www.ssa.gov/oact/NOTES/ran3/an2015-3.pdf.
Deloitte and Investment Company Institute. 2009. “Defined Contribution/401(k) Fee Study,” available at www.ici.org/pdf/rpt_09_dc_401k_fee_study.pdf.
Doellman, Thomas W., and Sabuhi H. Sardarli. 2016. “An Investigation of Administrative Fees in Defined Contribution Plans.” Financial Analysts Journal 72 (2): 41–51.
Ellis, Charles D. 2012. “Investment Management Fees Are (Much) Higher Than You Think.” Financial Analysts Journal, 68 (3): 4–6.
Munnell, Alicia H. 2015. “Falling Short: The Coming Retirement Crisis and What to Do About It.” Center for Retirement Research Issue Brief No. 15–7.
Sharpe, William F. 2013. “The Arithmetic of Investment Expenses.” Financial Analysts Journal, 69 (2): 34–41.
Shiller, Robert J. 1990. Market Volatility. Cambridge, Mass.: MIT Press.
Shiller, Robert J. 2005. Irrational Exuberance, 2nd edition, Princeton, N.J.: Princeton University Press.
Citation
Pang, Gaobo. 2016. “Fear of Fees in Defined Contribution Plans.” Journal of Financial Planning 29 (7): 46–51.