Journal of Financial Planning: January 2013
Executive Summary
- Previous studies have evaluated portfolio withdrawal rates assuming a fixed initial withdrawal rate with inflation-adjusted increases thereafter. This study evaluates withdrawal increases zero or greater but not more than inflation. Future increases are contingent upon portfolio performance. A much higher initial withdrawal rate than previously thought possible can be achieved without increasing the probability of failure as long as the retiree reduces or eliminates the inflation increase for years indicated by the Target Percentage™.
- The Target Percentage is developed and used to determine whether the portfolio is ahead of or behind target at any point during retirement. If the portfolio is ahead of target, the full inflation increase is taken in that year. If the portfolio is behind target, the inflation increase for that year is reduced or eliminated. Reductions of 1 percent, 2 percent, 3 percent, 4 percent, and the full inflation increase were studied.
- Various adaptive withdrawal techniques that reduce or eliminate inflation increases based on portfolio metrics have been previously described by other researchers. The Target Percentage Adjustment™ is simpler, more flexible, more precise, and more efficient than these techniques.
- Initial withdrawal rate increases of 49 percent to 53 percent can be achieved without any reduction in the 95 percent confidence of success over 30 to 40 years as long as the retiree agrees not to take the inflation increase in years in which the Target Percentage is exceeded. This Target Percentage Adjustment results in an expected decrease in purchasing power of only 12 percent to 17 percent over 30 years.
David M. Zolt, CFP®, EA, is a comprehensive, fee-only financial planner and president of Westlake Advisors, a registered investment adviser in Westlake, Ohio. He is a NAPFA-Registered Financial Advisor and a member of the Alliance of Cambridge Advisors (ACA). He can be reached at davidzolt@westlakeadv.com.
The most important question posed by clients to their financial planner is: “How much can I withdraw from my retirement portfolio each year and still be sure, or at least very confident, that I will not outlive my money?”
In his landmark 1994 article, Bill Bengen presented his answer to this question. He argued that a well-allocated portfolio subjected to an initial 4 percent withdrawal and adjusted for annual inflation thereafter would survive at least 30 years in almost all scenarios. Since then, the “4 Percent Rule” has been so widely accepted that financial planners regularly present this recommendation to their clients. The Consumer Price Index (CPI) as published by the U.S. government is widely used as the benchmark for inflation.
There have been many challenges to the 4 Percent Rule. Some argue 4 percent is too low while others argue it is too high. For example, see Athavale and Goebel (2011); Bengen (2006); Cooley, Hubbard, and Walz (2011); Finke, Pfau, and Williams (2012); and Kitces (2008). Nonetheless, the 4 Percent Rule has generally withstood these challenges as the gold standard in financial planning.
Scope of Article
In my experience, retirees are willing to forgo some or all of the annual CPI increases but do not want their withdrawal amount to decrease from the prior year. Also, my observation is that retirees are not looking to increase their withdrawals more than the CPI each year, especially if such increases would boost their probability of failure in subsequent years, which is almost always the case. Failure is defined as running out of money during your lifetime. Conversely, success is defined as making it through to the end of your life with at least $1 left over.
For these reasons, I have limited the scope of this article to techniques that reduce or eliminate the annual increase on the withdrawal amount due to the CPI increase. Techniques that decrease the annual withdrawal from the prior year or increase the annual withdrawal beyond the CPI increase are outside the scope of this article. The only exception is a decrease in the annual withdrawal amount resulting from deflation in the prior year. The last calendar year for which the United States experienced deflation was 1954. The closest we have come to deflation since then was in 2008 when the CPI increase was only 0.09 percent.
Also, comparing the techniques presented in this article to the Internal Revenue Service’s required minimum distribution rules would be interesting, but outside the scope of this article. This analysis could be the topic of another article.
Methodology and Assumptions
The test portfolio assumes 35 percent large-cap stocks, 15 percent small-cap stocks, and 50 percent intermediate-term government bonds with annual rebalancing. Historical 1926 to 2011 data were taken from the Ibbotson® SBBI® Classic Yearbook. Monte Carlo simulations of 50,000 iterations each with normal distributions were performed using @RISK, an Excel add-in. A 95 percent confidence level was targeted and deemed to define a “safe” withdrawal rate throughout this article.
The Monte Carlo method simulates a wide spectrum of economic scenarios (returns and inflation), from the best of times to the worst of times. Today’s low returns are well within this spectrum. The 1926 to 2011 Ibbotson database includes significant periods of very low returns including the eight-year period from 1934 to 1941 in which the annual return on 30-day Treasury bills averaged 0.1 percent. However, controversy exists regarding the reliability of Monte Carlo simulations. Some argue that the distribution tails are too slim. Others point out that Monte Carlo simulations are only as good as the assumptions employed. Such arguments are valid, but they don’t apply here. The vast majority of articles that use Monte Carlo simulation rely on the assumptions to predict the future. This study compares various techniques that strategically reduce the annual withdrawal inflation increase to boost the initial withdrawal rate without increasing the probability of failure. The assumptions and methods are used to create a level playing field to evaluate the different techniques. Any inaccuracy in these assumptions or methods would presumably affect all techniques under consideration in a similar manner, and thus not materially alter the results.
Inflation
Bengen assumed an annual withdrawal in the first year of 4 percent of the portfolio and this dollar amount, increased or decreased by the change in the CPI during the prior year, would be withdrawn from the portfolio each year thereafter. The vast majority of studies prepared since then has followed this approach—a fixed initial withdrawal rate followed by inflation-adjusted annual withdrawals. The premise is that inflation increases are required each year for the retiree to maintain his or her living standard over time. However, studies of retiree spending patterns indicate that expenditures tend to decrease on an inflation-adjusted basis as people age through their retirement years (Bernicke 2005; Pfau 2012).
Table 1 illustrates the impact of reducing or eliminating the CPI increase for all years unconditionally. The initial withdrawal rate is the highest possible withdrawal rate with a 95 percent probability of success (that is, failure is only 5 percent likely). The first row of Table 1 illustrates that for an expected 30-year period of retirement a retiree can take an initial 3.9 percent withdrawal with full CPI inflation-adjusted withdrawals thereafter throughout retirement and be 95 percent confident the retiree will not outlive the portfolio. Because withdrawals are increased by the full CPI increase each year, the retiree retains 100 percent of his or her purchasing power throughout retirement.
Subsequent rows in Table 1 illustrate the impact of taking less than the full CPI increase. For example, CPI minus 1 percent means that the withdrawal is 1 percent less than it would have been if the retiree had taken the full CPI increase. If the prior year’s withdrawal was $10,000 and the CPI increase was 5 percent, for a total withdrawal of $10,500, then the current year’s withdrawal would be $10,395 (99 percent of $10,500). As long as the prior year’s CPI increase is positive, the current year withdrawal would not be less than the prior year withdrawal. For example, if the prior year CPI increase was 0.6 percent, under the CPI minus 1 percent scenario the current year withdrawal would be equal to the prior year amount, rather than being reduced by the full 1 percent. To be consistent with the vast majority of prior studies, when the CPI goes down during the prior year (deflation), the withdrawal amount under this scenario, as well as other scenarios presented in this article, decreases by the CPI decrease.
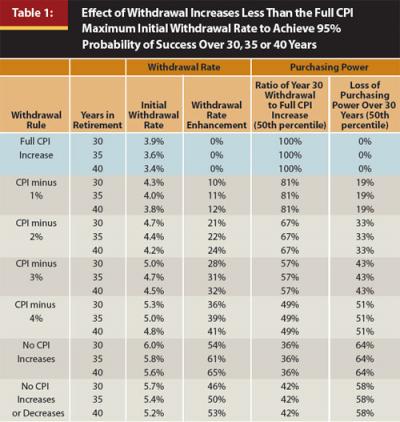
Reducing annual withdrawals by 1 percent each year allows the retiree to have a larger initial withdrawal of 4.3 percent (rather than 3.9 percent) and yet remain 95 percent confident of success over 30 years. This represents a 10 percent enhancement of the initial withdrawal rate for agreeing to reduce inflation-adjusted withdrawals by 1 percent each year throughout retirement. However, if 1 percent less than the full CPI-increased withdrawal is taken each year, withdrawals will lose purchasing power over time. At the end of 30 years, the annual withdrawal will buy only 81 percent of what the initial enhanced withdrawal amount would buy, representing a 19 percent loss of purchasing power. Compared with the full CPI increase scenario, the retiree under the CPI minus 1 percent scenario begins retirement with a 10 percent higher withdrawal amount and 30 years later their withdrawal amount is 11 percent lower (100 percent minus the product of 81 percent times 110 percent).
Similarly, if no CPI increases are taken in retirement, an initial 6 percent withdrawal will result in 95 percent confidence of success over 30 years. However, 64 percent of the purchasing power would be lost over that period, though again the retiree is beginning retirement with a significantly larger withdrawal amount. Because withdrawals decrease when the CPI decreases from the prior year, withdrawals under this scenario may decrease but will not increase.
For contrast, Table 1 also shows a scenario titled “No CPI Increases or Decreases.” Under this scenario the withdrawal dollar amount remains constant throughout the 30-, 35-, or 40-year retirement period.
What initial percentage could safely be withdrawn if some, but not all, of the CPI increase were taken each year based on some measure of portfolio performance along the way? Let’s look first at what previous studies have shown.
Literature Review
Guyton (2004) and Guyton and Klinger (2006) developed the following “decision rules” to preserve retirement portfolio longevity while increasing the initial withdrawal rate without reducing the confidence level of making it through a 30- or 40-year period of retirement.
Guyton’s Inflation Rule—CPI increases are capped at 6 percent a year.
Guyton’s Rule—No CPI increase in the year following a negative portfolio return.
Guyton’s Modified Rule—Same as Guyton’s Rule except it is not applied in years that the current withdrawal rate is less than the initial withdrawal rate. (The current withdrawal rate is defined as the current year withdrawal dollar amount divided by the portfolio market value at the beginning of that year.)
Guyton’s Rule All—Guyton’s Inflation Rule combined with Guyton’s Modified Rule.
Capital Preservation Rule—Withdrawals are reduced by 10 percent in years in which the current withdrawal rate would otherwise exceed 120 percent of the initial withdrawal rate.
Prosperity Rule—Withdrawals are increased by 10 percent in years in which the current withdrawal rate would otherwise be less than 80 percent of the initial withdrawal rate.
Table 2 illustrates the withdrawal enhancements using the first four of Guyton’s six rules. (The last two rules, capital preservation and prosperity, are not addressed in this article because they are outside the scope stated at the beginning of the article.) Guyton’s Modified Rule is by far the most efficient of these rules. In my judgment, efficiency is defined as achieving the largest withdrawal enhancement with the lowest expected decrease in purchasing power. As you can see, Guyton’s Rule and Guyton’s Modified Rule achieve the same withdrawal rate enhancements; however, Guyton’s Modified Rule does so with far less loss in purchasing power.
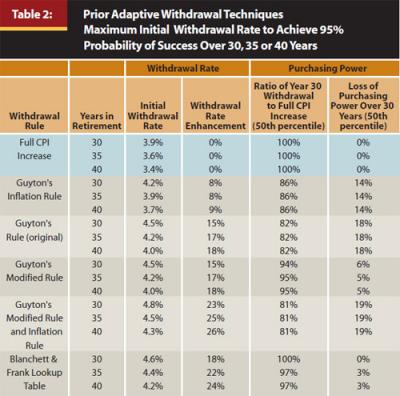
Table 2 also incorporates results of a modified lookup table technique from Blanchett and Frank (2009). This is an elaborate adaptive withdrawal technique whereby the probability of portfolio failure is recalculated each year based on the current withdrawal rate and the remaining period. If the probability of failure for any year exceeds the threshold shown below, the withdrawal amount is reduced by 3 percent for that year.
Remaining period Probability of failure
10 years or less >5%
11 to 19 years >10%
20 years of more >20%
A lookup table consisting of 5,000 Monte Carlo simulations is created to administer this technique. The table has 50 rows, one for each number of possible years remaining in retirement from 1 to 50, and 100 columns, one for each withdrawal rate from 1 percent to 100 percent. Each entry on the table represents the probability of failure for a given withdrawal rate and the number of remaining years. The probability of failure is determined each year by looking up the probability on this table.
The Blanchett and Frank Lookup Table (B&FLT) technique was modified slightly to bring it within the scope of this article. The modification is to limit the 3 percent reduction so it does not reduce the current year withdrawal below the prior year amount. For example, if the prior year withdrawal and CPI increase are $10,000 and 2 percent, respectively, and a 3 percent reduction applies, the current year withdrawal would be reduced to $10,000, rather than $9,894 (97 percent of $10,200).
The B&FLT technique requires the selection of a fixed period of retirement. Table 2 illustrates Monte Carlo simulation results for the B&FLT technique based on 30-, 35-, and 40-year retirement periods.
The Target Percentage
What if the full CPI increase is taken in the good years but reduced or eliminated in bad years to preserve long-term portfolio health and increase the probability of successfully completing retirement? The Target Percentage¹ was developed to accomplish this objective.
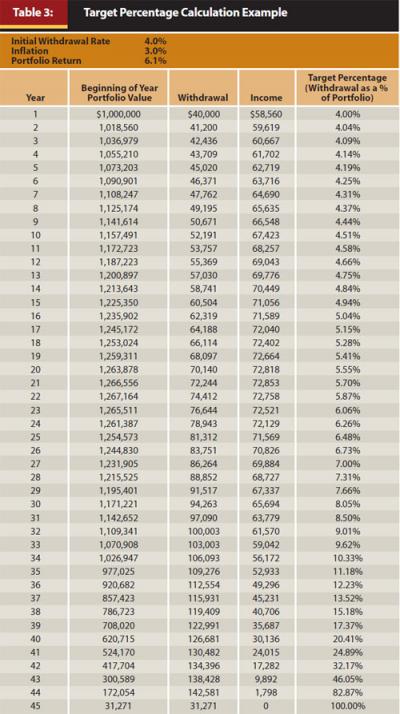
There are an infinite number of possible Target Percentages. Table 3 illustrates an example of the calculation of Target Percentages assuming an initial withdrawal rate of 4 percent, annual CPI increases of 3 percent, and portfolio returns of 6.1 percent. The 6.1 percent rate of return was selected to sustain the portfolio over 45 years.
The Target Percentages represent a schedule of the increasing withdrawal rates expected during the period of retirement if the assumptions are realized over time. If the actual withdrawal rate exceeds the Target Percentage at any point during retirement, the portfolio is considered to be in distress and the annual CPI increase should be reduced or eliminated. Curtailing the CPI increase preserves and strengthens the portfolio, thereby reducing the probability the portfolio will be exhausted during retirement. A withdrawal rate less than the Target Percentage indicates a portfolio that is healthy or ahead of schedule. In this case, the retiree may take the full CPI increase because the risk of failure is generally at or below the selected level of risk.
Gradually reducing an elevated withdrawal rate over time serves to bring the withdrawal rate down to the Target Percentage, which puts the portfolio back on its original path to success. Regardless of the reason for the elevation (such as poor asset performance, excess withdrawals, etc.), success is likely as long as the portfolio is put back on the original trajectory.
The Target Percentage Adjustment
The Target Percentage Adjustment is the reduction applied in any year in which the preliminary withdrawal rate exceeds the Target Percentage. The reduction is applied to the preliminary withdrawal rate, which is the withdrawal amount from the prior year increased by the prior year CPI increase divided by the portfolio at the beginning of the year. Target Percentage Adjustments of 1 percent, 2 percent, 3 percent, and 4 percent, and the full CPI increase were studied.
Table 4 illustrates the initial withdrawal rate enhancements that can be achieved using the Target Percentage Adjustment. The table shows that if a retiree commits to portfolio withdrawals of just 1 percent less than the full CPI increase for years in which the withdrawal rate exceeds the Target Percentage, the retiree can increase the initial withdrawal rate by 8 percent to 10 percent and still maintain a 95 percent confidence level that their portfolio will not be exhausted in 30 to 40 years. Also, the median (50th percentile) expectation is that the retiree will lose only 1 percent or 2 percent of his or her purchasing power over the first 30 years of retirement.
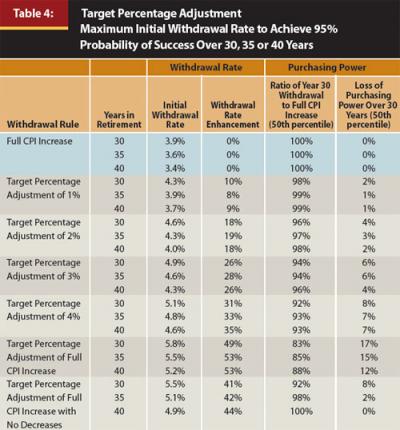
Similarly, if the retiree takes no CPI increase in years in which the withdrawal rate exceeds the Target Percentage, he or she can increase their initial withdrawal rate by 49 percent to 53 percent and still maintain a 95 percent confidence level. The median expectation would be a 12 percent to 17 percent loss of purchasing power over 30 years compared with the enhanced initial withdrawal rate. Even with an expected 12 percent to 17 percent reduction in purchasing power, the withdrawal amount at the end of 30 years probably would still be higher than the retiree would have received had he or she started with the unenhanced initial withdrawal amount and taken full inflation-adjusted withdrawals for 30 years. This comparison is explored at the end of the article.
Table 4 also shows a method titled “Target Percentage Adjustment of Full CPI Increase with No Decreases.” Under this method, the withdrawal amount never decreases, even when the CPI decreases from the prior year.
For each scenario in Table 4, the Target Percentages were determined by starting with the initial withdrawal rate in the first year and assuming withdrawals increase annually by 3 percent inflation. The portfolio return rate was selected to sustain the portfolio over 45 years.
Comparison with Literature Review
Guyton’s Modified Rule (GMR) results in a slightly lower withdrawal enhancement than the Target Percentage Adjustment of 2 percent (TPA 2 percent). However, TPA 2 percent is more efficient than the GMR in that it achieves a larger enhancement with less loss of purchasing power over 30 years. Another advantage of TPA 2 percent over GMR is that under TPA 2 percent the largest reduction the retiree can incur in any one year is 2 percent compared with the full CPI increase under GMR.2
The Blanchett and Frank Lookup Table (B&FLT) technique compares logically with TPA 3 percent because both techniques trigger a 3 percent reduction. While B&FLT does not achieve nearly as large withdrawal enhancements as TPA 3 percent, B&FLT has less expected loss of purchasing power at the 50th percentile. This mixed result is not sufficient to determine which technique is more efficient but implies a tradeoff between a higher initial withdrawal rate and a risk of loss of purchasing power later (that is, more 3 percent reductions). Stated differently, the tradeoff is between a higher withdrawal now and the risk of reductions later.
Each triad of results shown in Tables 1, 2, and 4 represents a single method, with the exception of the B&FLT triad, which represents three different methods. Under B&FLT, the financial planner must select the number of years over which to measure the probability of failure. If the planner selects a 30-year period, the probability of failure is measured over the remaining period. For example, if the retiree has been retired for 12 years and a 30-year retirement was planned, the remaining period is 18 years. However, if a 40-year retirement was planned, the remaining period is 28 years. This difference in the remaining period yields a different probability of failure as well as a different threshold for triggering the 3 percent reduction under the B&FLT method.
This focus on the remaining period renders B&FLT less flexible than the other methods studied. For example, if a retiree originally planned for a 30-year retirement, but lives longer, the strategy needs to be reset. However, it may be too late if the withdrawal rate has already elevated too high to rescue the portfolio over a longer remaining period of retirement.
Based on the results shown in Tables 2 and 4, the B&FLT results are closer to TPA 2 percent than to TPA 3 percent. The results indicate that B&FLT is slightly more efficient than TPA 2 percent. However, this advantage is very small and may be offset by the flexibility issue discussed above. In contrast, the TPA percentages presented in this article target a 45-year retirement period. If a shorter period had been targeted, the TPA 3 percent results would have been closer to B&FLT. The four Guyton rules studied in this article do not target a specific retirement period.
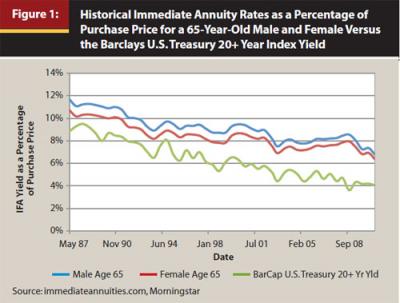
Further analysis reveals that the B&FLT technique is simply one instance of the Target Percentage Adjustment technique with a different set of targets. In fact, in this article, three different instances were studied: 30, 35, and 40 years. Table 5 shows the reverse-engineered B&FLT target percentages compared with the Target Percentage example shown earlier in Table 3. Figure 1 illustrates these targets graphically. To demonstrate the validity of the reverse engineered B&FLT targets, Monte Carlo simulations using the Target Percentage Adjustment technique with these targets were prepared. The simulations produced identical results to the B&FLT technique.
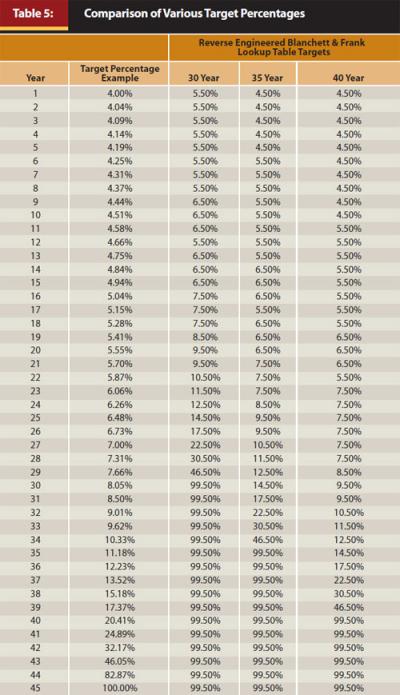
A review of the Target Percentages in Table 5 and Figure 1 provides further insight into the tradeoff discussed above. The B&FLT targets are higher than the TPA targets. These higher targets allow withdrawal rates under the B&FLT technique to drift higher before reductions are triggered to rescue the portfolio survival. The advantage is less likelihood of experiencing a reduction in the withdrawal rate during retirement. The disadvantage is a lower initial withdrawal rate is required to achieve the same confidence of success.
The B&F Lookup Table technique can now be seen as one implementation, among an infinite number of possible implementations, of the Target Percentage Adjustment. Different patterns of Target Percentages will yield different tradeoffs. Further research will be required to determine the optimal targets for each situation given the tradeoffs involved.
Purchasing Power Loss Risk
The Target Percentage Adjustment with full CPI reduction allows retirees to increase their initial withdrawal by about half without increasing the risk of outliving their money. How is this possible? The answer is that if portfolio performance is less than expected over an extended period, the retiree will experience many skipped inflation increases, significantly reducing purchasing power over time.
Table 6 shows the potential loss of purchasing power by percentile under the various Target Percentage Adjustments. The 50th percentile amounts are the same as shown in Table 4. The other percentile amounts illustrate the risk of purchasing power loss under each variation of the TPA technique. For example, TPA 1 percent for a 30-year retirement horizon results in a 20 percent probability that the retiree will lose at least 8 percent purchasing power over 30 years.
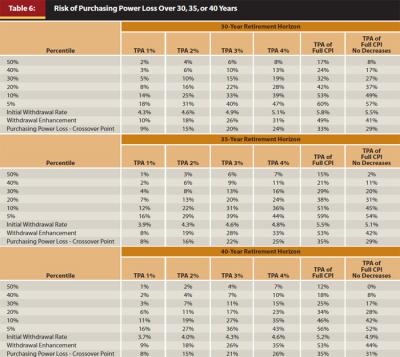
The crossover point represents the amount of purchasing power loss that would bring the withdrawal amount down to the amount the retiree would have been receiving if he or she had started with the unenhanced initial withdrawal amount (in this case, 3.9 percent of the initial portfolio) and taken full CPI increases every year. Because the purchasing power loss of 8 percent cited in the prior paragraph is less than the 9 percent crossover point for TPA 1 percent over 30 years, there is a less than 20 percent risk over 30 years of ever having the retiree’s withdrawal amount decrease below what would have been received if the unenhanced initial withdrawal amount with full CPI increases had been taken. Note that the probability that all withdrawals during the first 30 years of retirement will be higher under the TPA technique than under the unenhanced approach is greater than 70 percent for all scenarios shown in Table 6 and greater than 80 percent for most scenarios.
Conclusion
By agreeing to forgo annual inflation increases on withdrawals when cumulative portfolio performance is less than expected, retirees can achieve substantially higher initial withdrawal rates than previously thought possible without increasing the risk of outliving their money. Using the Target Percentage Adjustment technique, initial withdrawal rates can be increased 49 percent to 53 percent over amounts previously considered safe. Retirees can expect their purchasing power to decrease by only 12 percent to 17 percent over 30 years while their confidence of successfully completing retirement remains at 95 percent.
The Target Percentage is a powerful new benchmark for measuring the funded status of a portfolio dynamically through retirement. Further, the Target Percentage serves as a key metric to trigger various techniques to take action to preserve portfolio survival during retirement.
The Target Percentage Adjustment is a flexible, precise, and efficient way to achieve higher safe withdrawal rates without reducing the confidence of success while minimizing the risk of reducing purchasing power during retirement.
There are an infinite number of possible Target Percentages and Target Percentage Adjustments. The Target Percentage and the Target Percentage Adjustment combine to create a framework for describing adaptive withdrawal techniques. Other adaptive withdrawal techniques may be seen as just one implementation of this generalized concept. Further research is warranted to determine whether more optimal Target Percentages and Target Percentage Adjustment techniques can be found.
Endnotes
- The terms Target Percentage and Target Percentage Adjustment are trademarks of the author.
- The author chose to compare Guyton’s Modified Rule (GMR) with a Target Percentage Adjustment (TPA) of 2 percent because (a) GMR is Guyton’s best performing rule, and (b) the amount of the enhancement is very close to a TPA of 2 percent.
References
Athavale, Manoj, and Joseph M. Goebel. 2011. “A Safer Safe Withdrawal Rate Using Various Return Distributions.” Journal of Financial Planning 24, 7 (July): 36–43.
Bengen, William P. 1994. “Determining Withdrawal Rates Using Historical Data.” Journal of Financial Planning 7, 4 (October): 171–180.
Bengen, William P. 2006. Conserving Client Portfolios During Retirement. Denver: FPA Press.
Bernicke, Ty. 2005. “Reality Retirement Planning: A New Paradigm for an Old Science.” Journal of Financial Planning 18, 6 (June): 56-61.
Blanchett, David M., and Larry R. Frank. 2009. “A Dynamic and Adaptive Approach to Distribution Planning and Monitoring.” Journal of Financial Planning 22, 4 (April): 52–66.
Cooley, Philip L., Carl M. Hubbard, and Daniel T. Walz. 2011. “Portfolio Success Rates: Where to Draw the Line.” Journal of Financial Planning 24, 4 (April): 48–60.
Finke, Michael, Wade D. Pfau, and Duncan Williams. 2012. “Spending Flexibility and Safe Withdrawal Rates.” Journal of Financial Planning 25, 3 (March): 44-51.
Guyton, Jonathan T. 2004. “Decision Rules and Portfolio Management for Retirees: Is the ‘Safe’ Initial Withdrawal Rate Too Safe?” Journal of Financial Planning 17, 10 (October): 54–62.
Guyton, Jonathan T., and William J. Klinger. 2006. “Decision Rules and Maximum Initial Withdrawal Rates.” Journal of Financial Planning 19, 3 (March): 50–58.
Kitces, Michael E. 2008. “Resolving the Paradox—Is the Safe Withdrawal Rate Sometimes Too Safe?” The Kitces Report (May).
Pfau, Wade. 2012. “How Do Spending Needs Evolve During Retirement?” Advisor Perspectives 6, 11 (March 13).
Sidebar
CPI, CPI Increase, and Deflation
Each month, the U.S. Bureau of Labor Statistics publishes the prior month’s Consumer Price Index for All Urban Consumers (CPI-U, or as it is more commonly known, CPI). The index uses a base of 100 representing average prices from 1982 to 1984. For December 2010 and 2011, the CPI was 219.179 and 225.672, respectively. Therefore, the CPI increase for 2011 was 2.96 percent (225.672 divided by 219.179 minus 1). A decrease in the CPI from one year to the next represents a decline in prices and is known as deflation.
The terms CPI and CPI increase are not the same. The CPI for December 2011 was 225.672. The CPI increase for 2011 was 2.96 percent. The CPI represents prices at a point in time while the CPI increase represents the increase in prices over a period of time, in this case, one year.