Journal of Financial Planning: February 2017
Wade D. Pfau, Ph.D., CFA, is a professor of retirement income at The American College and a principal at McLean Asset Management. He is also chief planning strategist for inStream Solutions. He is a two-time recipient of the Journal’s Montgomery-Warschauer Award and the host of www.RetirementResearcher.com.
Executive Summary
- This analysis explored finding the most efficient approach for meeting retirement spending goals: obtaining mortality credits through risk pooling with an income annuity, or investing for upside growth through the stock risk premium.
- Risk pooling offers a unique source of returns not available from an investment portfolio, and risk pooling may provide a cheaper way to meet a spending goal, leaving more assets to cover contingencies and support legacy.
- An investments-only strategy can support greater legacy in the short term compared to a partial-annuitization strategy that uses risk pooling to meet spending goals and investments to meet liquidity and legacy goals.
- The advantages of risk pooling include a contractual guarantee to support lifetime spending, the ability to meet spending goals with a smaller portion of assets, and the potential to support a larger legacy in the event of a long life.
Different groups within the financial services profession continue to debate about the best approach to building a retirement income plan. Pfau (2014) identified two general philosophies about retirement income: the probability-based and safety-first schools of thought. A key issue of disagreement between these sides is about where retirees are best served in placing their focus and trust: in the risk/reward trade-offs and upside potential of a stock portfolio (probability-based), or in the contractual guarantee of income annuities (safety first).
This analysis aimed to test these competing approaches to provide greater clarity about the role of risk pooling (income annuities) and risk premium (stocks) in a retirement income plan. The analysis was based on meeting a prioritized list of three spending goals: (1) funding retirement spending; (2) supporting liquidity to cover contingencies or to support further lifestyle enhancements; and (3) providing a legacy to the next generation.
The “risk premium” strategy used an investment portfolio to meet all three goals. The “risk pooling” strategy was an integrated strategy whereby an income annuity was used to meet spending goals and an investment portfolio was used to support liquidity and legacy. For a generalizable case study, this analysis found that risk pooling provided a number of possible advantages to solely seeking the risk premium from stocks. For risk averse retirees, risk pooling funded retirement spending goals more cheaply and with contractual guaranties, which in turn allowed for greater true liquidity for non-annuitized investment assets.
The main advantage for the investments-only risk premium strategy was that it allowed for a larger legacy should the retiree die early, but at the cost of not having a contractual guarantee for income and with less true liquidity, as more had to be set aside to provide sufficient confidence that the spending goal could be funded. In the event of a long retirement, the legacy advantage of the risk premium strategy gradually declined as partial annuitization could ultimately support a larger legacy in the long term.
These trade-offs suggest that greater care should be taken by advisers and retirees when considering how a client’s risk aversion and desires for legacy impact the relative advantages of risk pooling and the risk premium as strategies to fund retirement spending goals. It is not obvious that an investments-only retirement income strategy will outperform a partial annuitization strategy when seeking to meet various client retirement goals and managing retirement risk.
Retirement Income Planning Theory
The theory for retirement income planning used in this research was informed from multiple sources. First, Branning and Grubbs (2010) proposed a framework for thinking about retirement income in terms of household liabilities and asset-liability matching. Liabilities represented the goals of a retiree, which Branning and Grubbs outlined as a pyramid of funding priorities. In order of priority, retirees match assets to a base fund to cover essential spending, a contingency fund for spending shocks, a discretionary fund for additional lifestyle improvements, and finally a legacy fund. For this analysis, Branning and Grubbs’ approach was simplified by assuming that a retiree first has a basic lifestyle spending goal for their retirement, then would like to preserve liquid assets to support contingency expenses (or possible lifestyle upgrades), and ultimately be satisfied with building a legacy after being sure they can first meet their spending goals and support liquidity.
Next, the meaning of risk from the perspective of retirement and personal finance must be clarified. Risk is not only related to short-term market volatility, although the ability of a risk-averse investor to stomach portfolio volatility is an important constraint for asset allocation decisions. Rather, the fundamental nature of risk for retirees is the threat that events take place (such as an unexpectedly long life, poor market returns, or spending shocks) that trigger a permanently lowered standard of living in subsequent years.
Retirees must decide how much risk to their lifestyle they are willing to accept. Major retirement risks relate to the unknown longevity and planning horizon of a retiree, the impacts of market volatility, and the risks of spending shocks that require additional unanticipated expenditures. Risk management tools include spending conservatively to stretch assets out and preserve liquidity for the unexpected, pooling risk through an insurance company, and investing for upside growth with a diversified portfolio.
In terms of longevity risk, the trade-off relates to how one must spend less in order to spread assets over a long period of time, to the extent that one is worried about outliving their portfolio. Risk pooling provides another option. An insurance company can pool longevity risk across a large number of consumers, paying each member of the pool as though they will live to their life expectancy, with those who die earlier subsidizing those who live longer.
As for market risk, if one is willing to assume that risk premium on stocks will be earned and therefore decides to spend more today than the bond yield curve can support, then this person is engaged in risky behavior. A natural mathematical formula that applies to retirement planning is that higher assumed future market returns imply a higher sustainable spending rate. Bonds provide a fixed rate of return when held to maturity, and stocks potentially offer a higher return than bonds as a reward for their additional volatility. But this “risk premium” is not guaranteed and it may not materialize; therefore, it is risky. Retirees who spend more today because they are planning for higher market returns than available for bonds are essentially amortizing their upside—they are spending more today than justified by bond investments, based on an assumption that higher returns in the future will make up the difference and justify the higher spending rate.
Maintaining liquidity is also an important tool for managing unanticipated spending shocks in retirement, and the nature of liquidity in a retirement income plan should be carefully considered. Cloke (2011) provided a key distinction about liquidity in a retirement income plan. In a sense, an investment portfolio is a liquid asset, but some of its liquidity may be only an illusion. Assets must be matched to liabilities. Some, or even all, of the investment portfolio may be earmarked to meet future lifestyle spending goals. In Cloke’s language, the portfolio is held “hostage to income needs.” A retiree is free to reallocate her assets in any way she wishes, but the assets are not truly liquid because they must be preserved to meet the spending goal. While a retiree could decide to use these assets for another purpose, doing so would jeopardize the ability to fund future spending.
This is different from “true liquidity,” in which assets could be spent in any desired way because they are not earmarked to cover other liabilities. True liquidity emerges when excess assets remain after specifically accounting for ongoing lifestyle spending goals. This distinction is important because there could be cases when tying up part of one’s assets in something illiquid, such as an income annuity, may allow for the spending goal to be covered more cheaply than could be done when all assets are positioned in an investment portfolio. In simple terms, an income annuity that pools longevity risk may allow lifetime spending to be met at a cost of 20 years of the spending objective, while self-funding for longevity may require setting aside enough from an investment portfolio to cover 30 to 40 years of expenses. Because risk pooling allows for less to be set aside to cover the spending goal, it allows greater true liquidity and therefore more to cover other unexpected contingencies, such as long-term care or health care shocks, without jeopardizing core spending needs.
In order to calculate the “true liquidity” for an investment portfolio that is also supporting a spending goal, assumptions were made about how much of the portfolio shall be earmarked for the spending goal. This analysis drew from Monte Carlo approaches for calculating retirement spending using an actuarial framework. In particular, Frank, Mitchell, and Blanchett (2012) developed a three-dimensional model in which sustainable spending was based on a time horizon, acceptable probability of failure, and asset allocation (linked to underlying capital market expectations). The asset base to support a spending goal was the spending goal divided by the estimated “safe” withdrawal rate based on the retiree’s planning age, accepted probability of portfolio depletion, and asset allocation. If the current portfolio value was larger than this threshold, the excess reflected true liquidity. True liquidity could be negative (the spending goal has a shortfall at the accepted level of risk) if current assets were less than what was needed to create sufficient comfort that the retirement spending goal would be met:

If a retiree chose to fully cover a spending goal through the partial annuitization of her portfolio, then remaining assets in the portfolio were not earmarked to cover spending. With this integrated strategy, risk pooling was used to earmark assets for spending, and the risk premium was used for remaining liquidity and legacy goals—they can be said to provide true liquidity. Because the retiree owned a contractual guarantee to cover her spending for life, she also had more risk capacity than with a pure investment strategy. After partial annuitization to a bond-like income annuity, the retiree may decide to use a more aggressive asset allocation to seek more risk premium with her remaining portfolio assets.
Retirement Reality with Fixed Income Investments
For this analysis, fixed income investments were simplified to assume a flat and unchanging yield curve. This eliminated interest rate risk from the analysis, as there was no possibility for fluctuating interest rates to create capital gains or losses for the underlying bond portfolio. In reality, if interest rates rise, the value of a fixed income portfolio declines, but the present-value cost of funding a future spending objective also decreases. If the duration of the bond portfolio matches the duration of the spending liability, then interest rate fluctuations have offsetting effects on the asset and liability sides of the household balance sheet, and interest rate risk is hedged. Alternatively, consider the retiree as holding individual bonds to maturity, which means that any capital gains or losses from interest rate fluctuations would not be realized as the bonds reach maturity and provide their face value as a source of retirement spending for that year.
This simplification about fixed income did not meaningfully impact the decision between stocks and income annuities; it simply let the analysis focus more directly on the equity risk premium and risk pooling without also having to worry about fluctuating interest rates. In reality, bond holdings may be riskier for retired households than implied by this analysis, but that was not the focus here.
With a flat and unchanging yield curve, it is simple to determine the amount of sustainable spending that can be supported by a bond portfolio in retirement. The answer depends on the interest rate and the length of retirement. More specifically, the PMT function in Excel provides an answer for how much can be spent for a given interest rate, planning horizon, portfolio value, desired legacy value, and whether distributions are taken at the start or end of the year.
Table 1 provides sustainable spending for a 65-year-old individual with $1 million who seeks to spend down the portfolio by the specified planning age, and who takes distributions at the start of each year. Longer planning horizons demand less annual spending in order to spread out assets for a longer period of time, and higher interest rates allow for higher spending through greater investment growth.

The baseline used for subsequent analysis was a 2 percent interest rate. This was aligned with the Daily Treasury Long-Term Composite Rates at the time of this writing.1 In this case, a 65-year-old individual wishing to plan for spending through age 80 could spend $76,299, whereas sustainable spending fell precipitously to $59,958 to make it through age 85, to $43,774 to make it through age 95, and to $39,218 to make it through age 100.
Risk Pooling as a Retirement Income Solution
What planning age should a 65-year-old retiree choose when building a retirement income plan? This is a personal decision to be based partly on objective characteristics: gender, smoking status, health status and history, family health history, and other socio-economic characteristics that correlate with mortality. It is also partly based on a client’s answers to more subjective questions: how does she feel about outliving her investment portfolio, and what would be the impact on her standard of living if she outlives her portfolio?
Milevsky and Huang (2011) defined longevity risk aversion as the attitude one has regarding the possibility of living longer than expected and outliving one’s financial resources. Beyond the objective available information about mortality, longevity risk aversion is what will likely drive the client’s decision about an appropriate planning age.
Longevity risk, or the risk of running out of assets before running out of time, is the fundamental risk for retirement. The distribution of longevity for the overall population is known, but an individual cannot know in advance precisely where he or she will fall in the distribution. The length of one’s retirement could be much shorter or longer than their statistical life expectancy. Half of the population will outlive their median life expectancy; some will live much longer.
Retirees do not know how long their retirements will last. Therefore, they face a delicate trade-off between wanting to spend as much as possible without overdoing it and risking old age poverty.
To add longevity risk to the retirement model, the analysis here used the Society of Actuaries (SOA) 2012 Individual Annuity Mortality tables with built-in projections for mortality improvements through 2016. This was treated as the objective information available regarding longevity for a 65-year-old retiree. This mortality data is for annuity purchasers, who do tend to live longer than the average American. This will reflect the more highly educated and higher-earning clients typically working with financial planners.
In terms of remaining life expectancy at age 65 in 2016, the Society of Actuaries projected an expected 22.6 more years for male annuitants to age 87.6, while female annuitants could expect 24.3 more years to age 89.3. For an opposite-sex couple, the longest living member of the couple could expect to live 27.6 more years to age 92.6.
Figure 1 illustrates longevity risk for a 65-year-old individual who builds a retirement plan using a 30-year planning horizon. The probability of outliving this time horizon is not insignificant. The probability for a 65-year-old individual reaching age 95 is 22 percent for male annuitants, 29 percent for female annuitants, and 45 percent for at least one member of an opposite-gender annuitant couple.

Without risk pooling, the mechanism for an individual to manage longevity risk is to use a conservative planning horizon for which there is a sufficiently low probability to outlive. This requires spending less so that available assets can be drawn out for a longer period of time. The probability of surviving to advanced ages is low. Individuals must determine how low of spending they are willing to accept today in their effort to plan for a longer life and better ensure that they will not deplete their assets before death.
An individual’s longevity risk aversion determines how she will evaluate this trade-off. For example, consider a 65-year-old female client who decides that her appropriate planning horizon is the age for which there is only a 10 percent chance she might live even longer. Assuming the objective mortality data used in this analysis is correct for this individual, her planning age is roughly 100 (precisely, there is a 10 percent chance she will live beyond age 100.1). She plans for 35 years of retirement spending from age 65 through age 99, with an assumption she will pass away on her 100th birthday. We assume this is the planning age that she is comfortable using with respect to her longevity risk aversion. With a 2 percent interest rate, if she invests $1 million in a bond portfolio and plans to live to age 100, Table 1 shows that she can sustain retirement spending of $39,218 per year throughout her retirement.
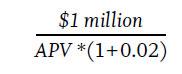
Next, an income annuity is introduced as a tool to pool longevity risk. An insurance company prices income annuities using the bond yield curve, mortality data, and any overhead charges. The price for an income annuity is the survival-weighted sum of discounted cash flows provided by the annuity. With a 2 percent interest rate and the SOA mortality data, the lifetime annual income that could be supported by a $1 million premium for a 65-year-old female is $51,943. If a realistic overhead charge of 2 percent is added, the lifetime annual income is $50,924.2 With a 2 percent interest rate, Table 1 showed that this income was slightly more than what could be generated with a planning age of 90. More precisely, a bond ladder could support this amount of income for 24.55 years, which falls between ages 89 and 90.
The income annuity has effectively calibrated lifetime income to what an individual could support on her own if her planning age was roughly the same as her median life expectancy. The $50,924 from the annuity is 30 percent more than the $39,218 that could be supported (through age 100) from bonds.
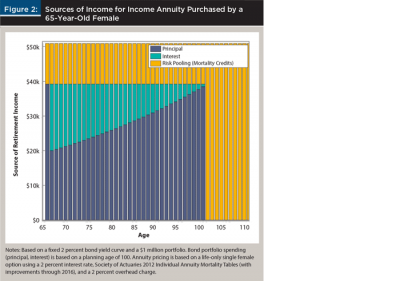
Figure 2 illustrates the sources of income for an income annuity. There are three sources of returns: (1) repayment of the principal; (2) interest earned on the principal; and (3) mortality credits available through risk pooling. For principal and interest, Figure 2 shows the amortized payments from the bond portfolio as it was spent down through age 100, when it was depleted and bond income stopped. The 30 percent additional income through age 100, and then any ongoing income beyond age 100 for those still alive, is a unique source of additional returns from pooling risk (the short-lived subsidizing the long-lived) not available from a bond portfolio. These mortality credits are mortality-contingent in that the income is only received when an individual is still alive. Importantly, though, for those demonstrating longevity risk aversion (and who therefore use a planning age somewhere beyond their statistical life expectancy), higher income is supported no matter how long one actually lives. Annuitization can reduce concern about outliving assets and provide a license to spend more.
To further investigate the case of a 65-year-old female deciding between bonds and an income annuity, the following assumption was added: her retirement spending goal was to take a $45,000 distribution at the start of each year. The 65-year-old client has $1 million at retirement, faces a 2 percent bond yield curve, and wishes to build a financial plan that works through a planning age of 100. The life-only income annuity costs $883,669 at age 65 and provides income for life. Costs are fixed at the initial premium level. Meanwhile, the cost of funding retirement with bonds is dependent on the length of life; it is the present-discounted value of the $45,000 spending stream for an increasing number of years. With the age 90 distribution, the cost of funding retirement through bonds exceeds the cost with an income annuity. With the age 94 distribution, the cost of the bond ladder exceeds $1 million. For a planning age of 100 (35 years of payments), the bond ladder cost is $1,124,485, which is 27 percent more than the annuity cost. The bond ladder cost continues to rise with longevity. The trade-off for the bond ladder is that there are more legacy assets for a given level of wealth in the event of an early death, but rising costs and risk of portfolio depletion in the event of a long life. For those with longevity risk aversion, the income annuity offers contractually guaranteed higher lifetime spending at the cost of potential legacy in the event of an early death.
Figure 3 investigates each retirement goal ($45,000 spending goal, support true liquidity, support legacy) for the same 65-year-old female with $1 million. As noted, the $1 million in the bond ladder can support the $45,000 goal until funds are depleted by age 94. Retirement spending then falls to $0. For the income annuity, a premium of $883,669 purchases $45,000 of spending for as long as the individual lives. This leaves $118,657 at age 65 that is not needed to cover spending.
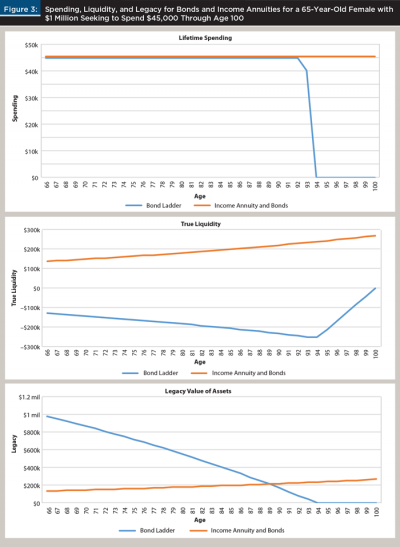
Next, true liquidity was measured as any remaining wealth not earmarked for meeting the retirement spending goal through the planning age. With the bond ladder, it was already determined that assets were insufficient to meet the spending goal. The retiree needs to have wealth exceed $1,124,485 before there is any true liquidity for her retirement income strategy. Liquidity, measured as remaining portfolio assets less the present value of remaining desired spending through the planning age, is negative. Meanwhile, with the income annuity, the spending goal is fully covered with the $883,669 initial outlay, leaving the entire remainder of the $1 million as a resource of truly liquid assets. At 2 percent interest, this $118,657 grows to $232,649 at the planning age of 100.
Finally, in terms of legacy, the bond portfolio is spent down until it reaches $0 by age 94. Prior to 94, legacy assets are whatever remains in the bond portfolio. Meanwhile, the legacy supported by the income annuity is the remaining $118,657 at age 65 that is not needed for income and that subsequently grows at 2 percent for the remainder of retirement. By age 90, legacy assets with the partial annuitization strategy ($190,853) exceeds legacy assets with the bonds-only strategy ($170,415). At the planning age of 100, legacy assets for the partial annuitization strategy are $232,649, compared to $0 for bonds.
Risk Premium as a Retirement Income Solution
Thus far, the financial portfolio has grown based on a fixed growth rate less any distributions. Stocks are then added as a volatile asset class. The ‘risky’ asset was based on large-capitalization stocks in the United States. The Stocks, Bonds, Bills, and Inflation yearbook from Morningstar provides historical data that shows that the arithmetic average return on large-capitalization stocks for the period 1926–2015 was 12 percent, with a standard deviation of 20 percent. During this time period, this was 6 percent larger than the 6 percent average return earned by long-term U.S. government bonds. The historical premium that large-capitalization stocks earned above long-term government bonds was 6 percent. The subsequent analysis was based on using this historical 6 percent equity risk premium and 20 percent standard deviation. Stock returns were modeled using a lognormal distribution based on an 8 percent arithmetic average (6 percent more than the 2 percent long-term bond rate) and a 20 percent standard deviation.
The introduction of stock market risk required two additional elements for the decision-making of a hypothetical risk-averse retiree. What failure probability does she comfortably and willingly accept that her portfolio will continue supporting spending through the planning age? How high of stock allocation is she willing to accept, in terms of her ability to stomach the daily volatility experienced by her investment portfolio? With the volatile investment and a fixed spending goal, some probability for portfolio depletion must be accepted by anyone seeking upside growth potential through the equity risk premium.
The hypothetical retiree analyzed here sought to support a retirement spending goal of $45,000 annually for 35 years from a starting portfolio of $1 million. Figure 4 shows the probability of success for meeting this goal for different asset allocations using 10,000 Monte Carlo simulations. Figure 4 shows that for someone to consider the risk premium as a retirement solution, it is important not to be timid with one’s stock allocation. Being able to support the full spending goal required an internal rate of return on investments of 2.97 percent. With bonds yielding 2 percent, success was not possible with an all-bonds portfolio (confirming the earlier point that the bond portfolio depleted by age 94). Adding stocks to the portfolio created the opportunity to achieve upside growth, improving the odds that the goal could be achieved. Success probabilities peaked for portfolios that included at least 50 percent stocks. For stock allocations of at least 50 percent, the probabilities of success for the spending plan fell between 74 percent and 75 percent.

To continue the example used here, assume that the 65-year-old female seeking to fund $45,000 per year through age 100 is comfortable holding a 50 percent stock allocation in retirement, and is willing to accept a 25 percent chance that her portfolio will be depleted by age 100 (which is needed to know for the purposes of determining the true liquidity for her portfolio).
Figure 5 provides the key results for comparing three strategies: (1) bond ladder; (2) an investment portfolio with 50 percent stocks; and (3) using an income annuity to cover the spending goal while investing remaining funds in 100 percent stocks.
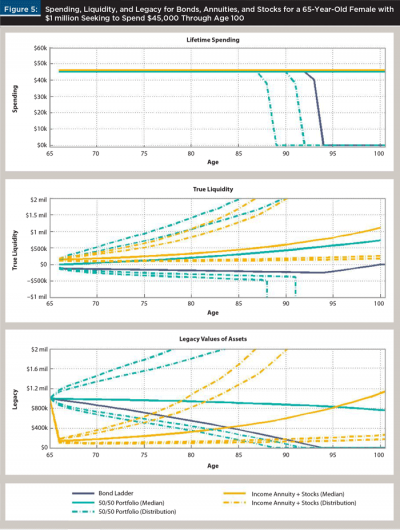
For strategies including stocks, Figure 5 shows the median as a solid line, and the 5th, 10th, 90th, and 95th percentiles of the distribution as dashed lines. For lifetime spending, the bond portfolio supported income through age 94. The 50/50 portfolio experienced a 5 percent chance that the spending goal could not be fully met by age 88, and a 10 percent chance by age 91. The first case of wealth depletion happened at age 79, and there was a 15 percent chance that the investment portfolio ran out of assets before the bonds-only strategy. For the other percentiles of the distribution shown in Figure 5, income could be sustained indefinitely. As for the income annuity, partially annuitizing $883,669 of the $1 million provided a contractual guarantee to support the $45,000 spending goal for life.
Next, with regard to true liquidity, the bond ladder experienced the same shortfalls as described before. For the 50/50 portfolio, median liquidity remained positive throughout the planning horizon, but shortfalls relative to the goal were experienced at the 5th and 10th percentiles. For the 90th and 95th percentiles, liquidity grew dramatically throughout retirement as portfolio growth outpaced the distributions for spending. As for the income annuity strategy, the distribution for liquidity stayed more narrow than with the stock/bond strategy. Median liquidity with partial annuitization remained higher throughout the retirement horizon. Because distributions were not taken from the liquid assets with the partial annuitization strategy, there were no cases where liquidity became negative.
Finally, regarding legacy assets, wealth was slowly spent down with the bond portfolio as the spending rate exceeded the 2 percent portfolio return, until the portfolio reached $0 at age 94. With the investment portfolio and the equity risk premium, the distribution of outcomes was wide. As noted, at both the 5th and 10th percentiles the 50/50 portfolio depleted earlier than the bond portfolio. This was the risky aspect of investing for the risk premium. However, the potential for upside was great. Median wealth was $767,116 at age 100, and at the 90th percentile of the distribution wealth had already exceeded $2 million by age 84. There was a 43.7 percent chance that the initial $1 million could be preserved by the planning age. Meanwhile, for the partial annuitization strategy, legacy wealth declined dramatically as the life-only annuity was purchased, but it increased over time as a result of no further distributions being taken from this asset combined with the more aggressive 100 percent stock allocation supported by the retiree’s increased risk capacity. Median wealth was $1,103,637 by the planning horizon, and there was a 53.3 percent chance that the initial $1 million was preserved by the planning age.
Figure 6 shows the probabilities for the risk pooling and risk premium strategies to support more with each of the three retirement goals: spending, liquidity, and legacy. Risk pooling provided a contractual guarantee to meet the spending goal, while beginning at age 79 the risk premium strategy began to experience portfolio depletion. This accounted for the slowly increasing probability that risk pooling could support greater income at advanced ages.
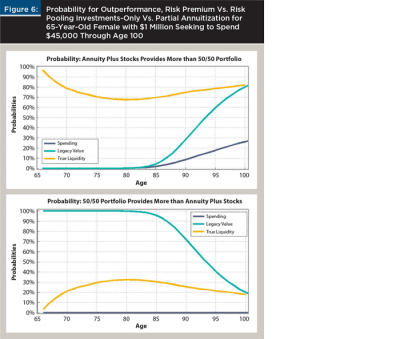
Regarding liquidity, risk pooling was able to meet the spending goal with a smaller asset base, which allowed for greater liquidity at the start of retirement. Throughout the retirement horizon, risk pooling supported a greater amount of true liquidity; more than 67 percent of the time at the lowest levels and more than 80 percent of the time at the planning horizon. Greater liquidity can allow for greater peace of mind in retirement as well as potential lifestyle improvements because of a reduced fear about outliving assets. With risk pooling, the ability to support greater legacy was hampered until late in retirement. There was a greater than 50 percent chance that legacy was larger with risk pooling by age 94, and an 80 percent chance for a larger legacy by age 100. Preserving legacy for the early part of retirement was the primary advantage of the risk premium investment-only strategy.
Conclusion
For the retirement income showdown between risk pooling and risk premium, the analysis of the case study here has shown that risk pooling provided stronger support for meeting a retirement spending goal and for preserving true liquidity. The risk premium did support greater legacy at the beginning of retirement, but this advantage diminished at more advanced ages. For clients choosing between these strategies, an important distinction will be on how much weight is given to the increased legacy in early retirement supported by the risk premium. Those favoring spending and true liquidity will find that it is much more difficult than commonly assumed for an investments-only strategy to outperform a strategy with partial annuitization.
This research focused on one general case study. Variations in these results could be found by changing the assumptions, including the bond interest rate, the value of the equity premium and the volatility of the stock market, the gender and size of the retired household, and the ratio of the retirement spending goal to the amount of retirement date assets. Aspects of the retiree’s longevity risk aversion and general risk aversion are also important, including the planning age, accepted probability of failure by the planning age, and acceptable asset allocations for both the investments-only and partial-annuitization strategies. Additional options for the income annuity may also be considered, such as including a cash refund provision to provide unspent premiums back to the estate in the event of the annuitant’s early death.
Table 2 provides an overview about how changing these assumptions would impact the relative performance for the risk premium (investments only) and risk pooling (partial annuitization).

Ultimately, the message of this research is that risk premiums do not obviously outperform risk pooling as a way to meet retirement spending goals as well as provide support for contingencies and legacy.
Endnotes
- The long-term composite rate was 1.98 percent on August 1, 2016, and 2.02 percent on August 2, 2016. (www.treasury.gov/resource-center/data-chart-center/interest-rates/Pages/TextView.aspx?data=longtermrate). Use of the long-term rate implicitly means that the analysis herein was based on a nominal spending goal without inflation increases. This long-term composite rate does tend to closely match the internal rate of return supported by a 30-year retirement income bond ladder, which justifies assuming a flat yield curve at this rate as a simplification for the analysis. The market for consumer price inflation-adjusted income annuities is smaller and less competitive, so this analysis was based on the more competitive nominal annuities market. This distinction does not otherwise matter for the comparisons between risk premiums and risk pooling. Without loss of generality, fixed spending adjustments (such as 2 percent annual spending growth) could be incorporated into the analysis. As a point of reference, the long-term real interest rate on August 1, 2016, was 0.49 percent.
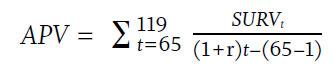
- Mathematically, the actuarial present value of $1 of income for a 65-year-old female is
References
Branning, Jason K., and M. Ray Grubbs. 2010. “Using a Hierarchy of Funds to Reach Client Goals.” Journal of Financial Planning 23 (12): 31–33.
Cloke, Curtis V. 2011. “Breaking the Income Annuity Liquidity Myth.” LifeHealthPRO (March 25). Available at www.lifehealthpro.com/2011/03/25/breaking-the-income-annuity-liquidity-myth.
Frank, Larry, John Mitchell, and David Blanchett. 2012. “An Age-Based, Three-Dimensional Distribution Model Incorporating Sequence and Longevity Risks.” Journal of Financial Planning 25 (3): 52–60.
Milevsky, Moshe A., and Huaxiong Huang. 2011. “Spending Retirement on Planet Vulcan: The Impact of Longevity Risk Aversion on Optimal Withdrawal Rates.” Financial Analysts Journal 67 (2): 45–58.
Pfau, Wade D. 2014. “2 Schools of Thought on Retirement Income.” Journal of Financial Planning 27 (4): 30–31.
Citation
Pfau, Wade D. 2017. “Retirement Income Showdown: Risk Pooling Versus Risk Premium.” Journal of Financial Planning 30 (2): 40–51.