Journal of Financial Planning: December 2015
C. Edward Chang, Ph.D., is a professor of finance in the college of business at Missouri State University. His research interests are performance measurement of investment vehicles and financial education. His research has been published in the Journal of Investing, Financial Services Review, Managerial Finance, American Journal of Business, Journal of Multinational Financial Management, Applied Financial Economics, Real Estate Review, and Financial Practice and Education.
Thomas M. Krueger, DBA, is a J.R. Manning Endowed Professor of Innovation in business education in the college of business administration at Texas A&M University, Kingsville. His research interests include market efficiency within the mutual fund and stock markets, firm reputations, and academic accreditation standards. His research has been published in the Journal of Finance, Journal of Investing, Mid-American Journal of Business, and Journal of Economics and Business.
Executive Summary
- Traditional index funds (TIFs) allocate investments in such a way that chosen firms have the same weight as they do in a price-weighted, capitalization-weighted, or similar measure of market behavior.
- Fundamental index funds (FIFs) allocate cash in such a way that more money is spent on stocks with book value, cash flow, dividends, and net income characteristics that supposedly lead to higher subsequent investment returns.
- The potential advantages of fundamental indexing have stoked debate between supporters of traditional capitalization-weighted index funds and advocates of more recently created fundamental index funds.
- Using the universe of index ETFs and mutual funds with at least five years of data, this study documents the performance of fundamental index funds and traditional index funds since the 2008–2009 market meltdown.
- Cost, return, risk, and risk-adjusted returns measures were used to compare the allocation methods. Significant differences were noted.
- We found that index fund providers were able to increase return, but also added risk. Although risk-adjusted returns in general were insignificant, fundamental weightings tended to enhance domestic returns when the market advanced.
Index funds have been around for decades, providing a means by which investors can judge the performance of active portfolio management. Index funds also serve as an investment option for those seeking market returns without any direct involvement in portfolio management. Even CalPERS, the California pension fund with $300 billion in assets and hence the ability to hire the smartest investment minds, decided to move money from active management to passively managed index funds in 2013. With index funds beating 87 percent of actively managed mutual funds over the prior five years, the move was viewed as an act of capitulation to the efficient market hypothesis (Saporito 2014).
An underlying dilemma faced by investors has been identification of the “market,” and once the market has been identified, how to weight the securities in the chosen marketplace. Traditionally, the proportion of a portfolio invested in identified securities was weighted on the basis of market capitalization, as done by the S&P 500. However, one consequence of this weighting technique is that more money is placed into shares that are temporarily overpriced, while underweighting shares for which investor sentiment has turned sour without an underlying economic justification. Fundamental funds attempt to remedy this by weighting funds on the basis of supposedly key company conditions, such as sales growth or earnings that are not at the mercy of the stock market itself.
Relatively recently, fundamental funds have been created that weight investment securities within a given broad market on the basis of these key fundamental factors. By comparison, fundamental index funds hold all the stocks in an index with weightings based on firm-related factors. Uncertainty regarding a preference for traditional value weighted or fundamental firm characteristic weightings is embodied by the comments of Marie Chandaha, president and CEO of Charles Schwab Investment Management, who said, “We believe the systematic approach inherent in fundamentally weighted methodologies, when used alongside cap-weighted strategies, enables investors to diversify and balance their exposure” (DeLegge 2013).
As of March 2014, 10 U.S. equity exchange-traded funds (ETFs), 18 international equity ETFs, two U.S. equity mutual funds, and three international equity mutual funds claiming to be fundamental index funds had been in existence for at least five years.
This study looked at their operating characteristics, return and risk measures, and risk-adjusted returns during various market conditions. As a benchmark, we used a matched set of traditional index funds. The sample covered 24 Morningstar categories, using “best fit” indexes to fine tune the matching of fundamental index funds (FIFs) and traditional index funds (TIFs). Following the lead of Hsu and Campollo (2006), our analysis considered both domestic and international index funds. In order to set the stage, the literature review describes the advent of TIFs and FIFs, the ongoing controversy of fund proponents, and past research findings.
Literature Review
Market indexing is not new. For decades, the Dow Jones Wilshire 5000, Russell 2000, and S&P 500 have measured general stock market performance following a market capitalization formula.
In 1975, John Bogle started the first market mirroring index fund, which relied heavily on Burton Malkiel’s A Random Walk Down Wall Street (1973) treatise. The cornerstone of indexing is that consistently outsmarting the market is impossible. Three decades later, in 2005, Robert Arnott rolled out his first fundamental index. WisdomTree, a big ETF sponsor, began independently offering a line of 48 fundamentally weighted ETFs in 2006.
A key premise of the fundamental index methodology is that underlying corporate accounting and valuation measures are more accurate estimators of a company’s intrinsic value than share price. Frequently, accounting figures such as earnings, sales, or other measures considered in corporate valuation are used. Invesco PowerShares employs four fundamental measures: (1) five-year average sales; (2) cash flow; (3) dividends; and (4) current book value, while WisdomTree tends to use a single fundamental factor (Anderson 2013).
Using multiple fundamental indices has the potential to average out specific sector biases, such as utilities being overweighted if book value is used, or retailers if employees are used, which could arise when only one fundamental factor is used.
Regardless of the number of factors used, the result is that the fundamental weighting technique tends to put more money into value stocks. However, in its listing of fundamental indexing’s potential advantages, the online investment research provider ETFguide.com1 notes that when the desirability of factors used in fundamental portfolio construction becomes less attractive, fundamental indexing will underperform traditional market cap weighted indexes.
Assuming that market prices are at best educated guesses regarding firm worth, the traditional method of capitalization-based weighting of index components implies an overweighting of overpriced stocks and an underweighting of underpriced stocks. Although investors cannot remove share price inefficiencies, they can claim to eliminate systematic inefficiencies imbedded in capitalization-weighted indices.
At a naïve level, equal weighting is a method to remove price inefficiencies. This approach, however, is likely to suffer from the requirement to invest large sums in illiquid stocks. Other issues include high turnover as firm shares change and index managers regain an equal distribution of wealth and high volatility as low-priced stocks have disproportionate influence.
Hsu (2006) showed that a capitalization-weighted index will, on average, underperform an equal-weighted index with similar risk, and that the size of underperformance is roughly equal to the noise in stock prices. That is, the more prices fluctuate independently of changes in company fundamentals, the greater the cap-weighted underperformance.
Hsu and Campollo (2006) demonstrated that the so-called “return drag” on cap-weighted portfolios is significantly increased when mispricing is temporary. More recently, Aked, Kalesnik, Kose, Lawton, and Moroz (2014) found that equal-weighted portfolios underperform cap-weighted portfolios once turnover and liquidity considerations are addressed, with fundamental-weighted portfolios outperforming both.
Kaplan (2008) presented an argument for combining capitalization and fundamental variables. This “collared” approach accentuates the low turnover advantage of the capitalization-weighted technique while dampening this approach’s disadvantage of not selling a stock whose proportion keeps expanding as a consequence of having an increasingly higher stock price. Employing fundamental factors in weighting of securities within a portfolio avoids the pitfalls of equal weighting while still removing the potential systematic inefficiency of price-based weighting. In the parlance of “Wall Street” and “Main Street,” fundamental analysis weights components such as revenue, net income, cash flow, and dividends. In situations where investor sentiment has a greater impact on share pricing, resulting in a lower correlation between share price and economic fundamentals, fundamental indexation should provide a relatively higher investment return.
Virtually all investment-related research is an effort to determine the authenticity of the capital asset pricing model or some variant thereof. In their study of small firms over a 14-year period, Hackel, Livnat, and Rai (1994) investigated the benefits of selecting stocks on the basis of operating and free cash flows, low financial leverage, and low free cash flow multiples (defined as price/free cash flows). In subsequent research, they again found superior investment results for portfolios consisting of stocks with consistent free cash flows, low financial leverage, and those that were sold at low free cash flow multiples based upon a more recent four-year period (Hackel, Livnat, and Rai 2000).
Arnott, Hsu, and Moore (2005) used 43 years of back-tested data to determine that indices weighted by several fundamental factors, including sales, EBIT, earnings, cash flow, book value, and dividends, outperformed the S&P 500 by approximately 2 percent per annum with volatility similar to the S&P 500. Fundamental-based indices had a higher Sharpe ratio than capitalization-weighted indices. In non-U.S. markets, fundamental-based indices outperformed capitalization-weighted indices by approximately 2.5 percent with slightly less volatility. These funds outperformed in all 23 MSCI EAFE countries.
Hsu and Campollo (2006) reproduced this investigation using data from a more recent period, finding a difference of 2.8 percent domestically and 3.5 percent internationally. For calendar year 2009, comparative performance of the fundamental index based on the Russell 1000 exceeded its benchmark by 41.75 percent. However, Droms (2010) attributed a significant portion of this success to the fact that Research Affiliates Fundamental Index (RAFI) funds are rebalanced in mid- to late-March, and that benefited the funds greatly from the market rebound that occurred from the March 9 bottom. For instance, the S&P 500 Index bottomed at 676 on March 9, 2009 and recovered to close at 1,115 on December 31, 2009 (an increase of 64.8 percent).
Financial economists Walkshäusl and Lobe (2010) investigated the performance of global and 50 country-specific (28 developed and 22 emerging) fundamental-weighted indices compared to capitalization-weighted indices between 1982 and 2008. Even after controlling for “data snooping” biases and the value premium, they found evidence that fundamental indexing produces economically and statistically significant positive alphas for global and country-specific samples.
In a separate study of 50 national markets, Langlois and Lussier (2009) identified nine countries where fundamental indexation creates value that cannot be defined by size, value, or price momentum. However, they concluded that the fundamental weighting technique proposed by Arnott et al. (2005) was really a means to identify the extent of mispricing. There continues to be a heated debate regarding the value and implementation of fundamental analysis (see Amenc, Goltz, and Ye 2012; Chow, Hsu, Kalesnick, and Little 2011).
The present study was based on the belief that it is the results that matter. Hence, we compared the actual performance of fundamental index funds to traditional index funds. Similar to other research relying on a priori assumptions about probabilities and data attributes (Hill 1976; Jin, Xu, and Zhuo 2008), we made the assumption that having an above-average weighting scheme will lead to superior investment performance.
The contribution of our research is that it examines the performance of index funds designed to benefit from the advantages of capitalization weighting or fundamental weighting.
Data and Research Methods
The universe of mutual funds that are index funds with return data for the 2009–2014 period consists of 33 FIFs and 34 TIFs. A listing of the index funds can be found in Table 1, where ETFs are presented in Panel A and mutual funds are in Panel B.
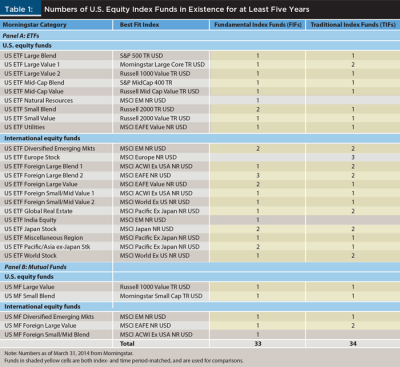
In order to pair up funds properly, we first used the Morningstar category classification and then the best fit index. In a single Morningstar category, funds may be based on several best fit indexes. Likewise, funds based on the same best fit index may be classified into various Morningstar categories. With this procedure, FIFs and TIFs may be more comparable than just filtered by Morningstar category only. Moreover, we increased the degrees of freedom through this procedure by having multiple representatives in the same Morningstar category. For instance, there is a U.S. ETF Large Value 1 set and U.S. ETF Large Value 2 set of FIFs and TIFs.
Funds in each mutual fund category were used only if there was at least one FIF and TIF. This eliminated four Morningstar categories from further consideration. Performance of multiple mutual funds within a single remaining category was averaged, which resulted in one observation per Morningstar category. Consequently, this analysis was based on the performance of funds within 24 Morningstar categories. The specific representation breakdown is as follows: 8 U.S. equity ETF categories, 11 international equity ETF categories, 2 U.S. equity mutual fund categories, and 3 international equity mutual fund categories.
The best fit indexes are listed in the second column of Table 1. Each of the U.S. equity ETFs was matched up with a different Morningstar assigned best fit index. Upon sample expansion beyond the group of U.S. equity ETFs, best fit indexes are periodically applicable to multiple Morningstar categories, which can be variations of an investment genre. For instance, the MSCI Pacific excluding Japan index is the best fit index for three Morningstar categories: U.S. ETF Global Real Estate, U.S. ETF Miscellaneous Region, and U.S. ETF Pacific/Asia excluding-Japan Stock. The MSCI EM (emerging markets) NR (net dividends reinvested) USD (U.S. dollars) index is considered the best fit benchmark for at least one of the ETF Morningstar categories (U.S. ETF Diversified Emerging Markets and U.S. MF (mutual fund) Diversified Emerging Markets). As with the U.S. ETFs, different best fit categories applied to each Morningstar category represented by the mutual funds in this study. Lending credence to the robustness of our findings, in total, 15 best fit indexes were represented by the sample.
The other columns of Table 1 report the number of FIFs and TIFs with five years of activity trading prior to March 31, 2014. Totals are reported on the bottom row, which reveals that 33 FIFs had information available for five years. A similar 34 TIFs had been in existence over at least the April 2009 to March 2014 period. Yellow shading is provided in each row where there is at least one of each type of index fund. The other instances were eliminated from further consideration. As a consequence, the findings presented below are based on 30 FIFs and 31 TIFs.
Utilization of longer sample periods would have resulted in more instances without at least one FIF and one TIF in a specified Morningstar category with the same best fit index. The use of the sample period post the 2008–2009 financial crisis also eliminated a spurious advantage gained by the RAFI indexes, which were rebalanced in mid-March 2009, near the time of the stock market low. It is also possible that all of the attention related to fundamental investing may have reduced the value of the fundamental-weighting technique. As Droms (2010, p. 75) put it, “If stock markets evolve to a higher level of efficiency, then one would expect to see the value of fundamental indexing compared to market cap indexing to decline.”
A paired t-test was the primary statistical testing method used in this study. There was a matching of the average measure of the FIFs and the average measure of the TIFs placed in the same category and same best fit index by Morningstar. Given its positive reputation and widespread use by investors, we relied on Morningstar for proper categorization of funds. Measurements were aggregated across fund categories and best fit indexes. The null hypothesis was always equality of means, with the alternative hypothesis being inequality of means.
Research Findings: Investment Fund Operating Characteristics
Managers of funds using prescribed firm fundamentals appear to charge for their analytical efforts, as exhibited in Panel A of Table 2. Whether considering ETFs (in primary columns 1 and 2), or mutual funds (in primary columns 3 and 4), the FIFs’ expense ratios were always higher. Significance levels ranged from 0.10 for international mutual funds (column 4) to 0.01 for both ETF sets (column 1 and column 2). The highest average annual expense ratio was 0.55 percent for international ETF FIFs. The biggest difference also occurred among international ETFs, where FIFs charged 0.17 percent (0.55 percent – 0.38 percent) more. Mutual fund expense ratios were consistently below their ETF counterparts. For instance, the U.S. ETFs’ FIFs average was 0.38 percent, while the average U.S. FIF mutual fund expense ratio was 0.36 percent.
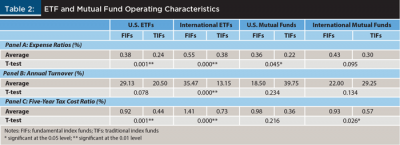
Annual turnover was consistently higher for ETF FIFs, but insignificantly lower for mutual fund FIFs, as exhibited in Panel B of Table 2. A variety of turnover relationships existed across the four sets of funds. Mutual funds had the lowest turnover within FIFs, but the highest turnover within the TIFs group. Before too much is said about this difference, it should be noted that annual turnover difference within U.S. equity mutual funds was not significant. By comparison, both ETF pairings had t-test statistics that were less than 0.10. International ETF FIFs had the second highest turnover (35.47 percent), while international ETF TIFs had the lowest turnover (13.15 percent).
Tax cost ratios were always higher for FIFs, as exhibited in Panel C of Table 2. This measure of the percentage of annual distributions that are taxed away was only 1.41 percent at its highest level among international ETF FIFs. Nonetheless, on a $100,000 distribution, the difference in tax efficiency between international ETF FIFs and TIFs amounted to $680 ($100,000 (0.0141 – 0.0073)). This additional taxation was significant at the 0.01 level, as it was for U.S. ETFs where FIFs had a higher cost at $480 ($100,000 (0.0092 – 0.0044)).
Although U.S. mutual fund TIFs had the lowest tax cost ratio, at 0.36 percent, this rate was not significantly less than that of the 0.98 percent tax cost ratio of the U.S. mutual fund FIFs. International mutual funds’ FIFs carried a significantly higher tax cost ratio that equated to $360 ($100,000 (0.0093 – 0.0057)) on a $100,000 investment.
In summary, a consistent pattern arises if one focuses on the significant differences between FIFs and TIFs. If one limits consideration to instances when there were significant differences, FIFs had the higher expense ratios, annual turnover, and tax cost ratios. In the case of ETFs, the difference was significant at the 0.01 level, except for annual turnover among U.S. ETFs, where the difference was significant at the 0.10 level. Looking across the ETF pairings, international ETFs tended to have higher expense ratios, annual turnover, and tax cost ratios. Differences were more muted among mutual funds. However, U.S. mutual fund FIFs had higher expense ratios, while international mutual fund FIFs had higher tax cost ratios.
Return and Risk Measures
Average annual returns over the April 2009 to March 2014 period are provided in Table 3. This was a bull market period, coming out of the 2008 economic recession, during which the S&P 500 rose at an average annual rate of return of 19.33 percent. Over these five years, the S&P 500 almost doubled from 797.9 to 1569.2. Also during this period, the average annual dividend yield was 1.99 percent for a total return of 21.32 percent.2
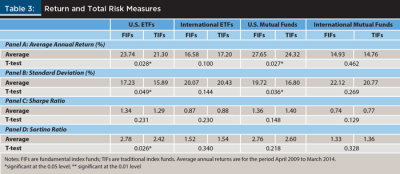
Average annual returns are presented in Panel A of Table 3, where it is shown that both sets of U.S.-based equity FIFs outperformed TIFs. Among ETFs, the difference was 2.44 percent (23.74 percent – 21.30 percent), which was significant at the 0.05 level. Among mutual funds, the difference was slightly higher at 3.33 percent (27.65 percent – 24.32 percent), which was also significant at the 0.05 level.
Relative to the S&P 500’s total return, the U.S. equity ETF FIFs earned an extra 2.42 percent annually (23.74 percent – 21.32 percent), while U.S. equity mutual fund FIFs earned 6.33 percent (27.65 percent – 21.32 percent) more. In the case of international equity funds, the difference between FIFs and TIFs was insignificant.
U.S. FIFs also tended to have more risk, as reported in Panel B of Table 3. The standard deviation of ETF FIFs was 1.34 percent (17.23 percent – 15.89 percent) higher, while the standard deviation of mutual fund FIFs was 2.92 percent (19.72 percent – 16.80 percent) higher. Both numbers were significant at the 0.05 level. There was an obvious positive risk/return relationship—which even held within the international fund sets—although the international mutual fund results were not significant. International ETF TIFs also had higher returns and risk, while international mutual funds FIFs had higher returns and risk.
Given the positive risk and return relationship, it was not surprising that the Sharpe ratios shown in Panel C of Table 3 were insignificant. Looking at the individual pairings, the difference never exceeded 0.05. Based on this measure of total return and risk, one would conclude that there was no difference in the relative performance of FIFs and TIFs.
However, if one considers only downward variance, through computation of the Sortino ratio, a slightly different conclusion can be drawn. When considering return relative to the undesirable downward variance in share price, FIFs outperformed TIFs within the U.S. equity ETF genre. The difference was 0.36 (2.78 – 2.42), which was significant at the 0.05 level. When reflecting on these two risk-adjusted return measures, it appears that a relatively large component of FIF total risk is desirable upward variation, which, when excluded, resulted in significant differences in the Sortino ratio. Additional insight to this potential cause will be revealed later when capture ratios are presented.
Systematic Risk Characteristics
International ETF FIFs and TIFs had significantly different levels of systematic risk, as exhibited in Panel A of Table 4. Although the difference was only 0.03 (1.02 – 0.99), it was significant at almost the 0.01 level, suggesting that there was a large amount of consistency within the beta measures of FIFs and TIFs. Interestingly, it was only among international ETFs that FIFs had a lower beta average than TIFs.
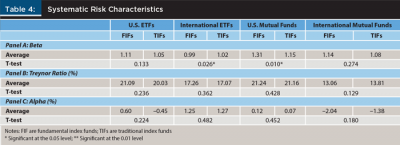
When it comes to U.S. mutual funds, the FIFs average beta was 0.16 (1.31 – 1.15) higher. This difference was significant at close to the 0.01 level. U.S. mutual fund FIFs and TIFs had higher beta values than U.S. ETFs. Likewise, international mutual fund FIFs and TIFs had higher beta levels than their international ETFs counterparts.
As with the Sharpe ratios, neither of the beta-based, risk-adjusted return measures could be used to identify a significantly different level of performance between FIFs and TIFs. Treynor ratios were consistently higher for FIFs among ETFs, but the difference never exceeded 1.06 percent, as displayed in Panel B of Table 4. In a departure from the norm of FIFs having higher values, the Treynor ratio of the international mutual fund TIFs was 0.75 percent higher, but this was far from being significant.
FIF and TIF alpha values were also not significantly different, as shown in Panel C of Table 4. As with the Treynor ratios, FIF alpha values were also higher in all but the international mutual fund comparison where both alpha values were negative. The individual performance of each group, however, was worthy of note. International ETFs had the highest alpha measures, while international mutual fund values were the lowest. U.S. equity mutual fund alpha measures were closest to zero. There was a dichotomous situation within the U.S. ETFs, with FIFs having positive 0.60 percent alpha measures, while TIFs had an average alpha of –0.45 percent. This suggests that there may be some valuable insight about FIFs, or negative about TIFs, that was not being identified through the alpha measure of risk-adjusted returns. The following section on capture ratios sheds some light on this divergent behavior.
Capture Ratios
Upside and downside capture ratios are presented in Panel A and Panel B, respectively, of Table 5. There was a significant difference in upside capture ratios between FIFs and TIFs in both ETF and the U.S. mutual fund pairing. In the case of U.S. equities, FIFs had significantly higher capture ratios, reaching a difference of 13.10 percent (129.42 percent – 116.32 percent) in the mutual fund set. When the market rose by 21.32 percent, which was the average annual return on the S&P 500 during this time period, U.S. mutual fund FIFs did 2.79 percent (0.1310 x 21.32 percent) better than U.S. mutual fund TIFs. Among U.S. ETFs, FIFs did 1.52 percent ((1.1248 – 1.0534) x 21.32 percent) better.
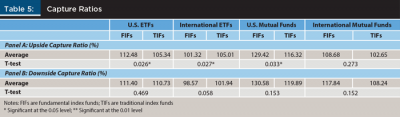
An interesting phenomenon happened among international equity ETFs, where FIFs earned 101.32 percent of the market gain. This rate was significantly less than the 105.01 percent capture ratio for international equity TIFs. Given that the values were significant though similar, it appears as though sensitivity to market performance was consistent within both subsets of the international equity ETF market. U.S. mutual fund FIFs had a higher, though insignificantly different, upside capture ratio when compared to TIFs.
As shown in Panel B of Table 5, none of the downside capture ratio within a given market was significant. Some interesting differences emerged going across markets. U.S. equity mutual fund downside capture ratios were the largest for both FIFs and TIFS, and were an approximate offset to the upside capture ratios. This finding of high downside sensitivity was consistent with the beta values presented in Table 4.
A similar statement regarding approximate offsetting was applicable for U.S. equity ETFs. At the p = .10 level, there was a significant difference between international equity FIFs and TIFs, with FIFs being least likely to exhibit returns that reflected the market decline. TIFs captured 3.37 percent (101.94 percent – 98.57 percent) more of market dips. By comparison, international mutual funds had downside capture ratios well in excess of 100 percent.
Conclusion
Traditional equity indexes, like the Vanguard Total Stock Market Index, which attracted a market-topping $251 billion in 2013 (Forgione 2013), weigh stock holdings based purely on market capitalization. If a stock price is inflated and about to plummet, a traditional index fund does not adjust for this possibility because the foundation of index investing is that trying to outsmart the market is futile.
After the rise and fall of the dot-com stock market bubble, Arnott (2011) concluded that it would be better to weight portfolios based on essential economic aspects of a firm. What emerged was fundamental indexing. Fundamental indexing has its critics. John Bogle branded fundamental indexation as “witchcraft” in an interview with Morningstar (Benz 2008). Bogle argued that this technique requires identification of the key fundamental characteristics and how to properly weight each in a portfolio. Results from the current study expand the debate by examining the relative merits of fundamental indexation versus traditional indexation of portfolio construction.
Findings suggest that domestic FIFs have significantly higher expense ratios and tax cost ratios than TIFs. In both U.S. ETFs and U.S. mutual funds cases, the expense ratio is more than 50 percent higher, while the tax cost ratio is more than twice as high. Higher costs also exist among international ETFs, though not international index mutual funds. One reason for higher expenses is the significantly higher levels of turnover for fundamentally indexed ETFs.
Return measures reported here favor Arnott’s (2011) argument. Returns were significantly higher when considering domestic index funds. However, fundamental index funds also had higher risk. As a consequence, the Sharpe ratios were found to be similar across the two types of index funds, though the Sortino ratio favored fundamental indexation. Traditional indexation advocates would point out that significance is limited to U.S. ETFs. Consideration of systematic risk and risk-adjusted returns found virtually no difference between the indexing techniques; nor was there the ability to provide significantly less sensitivity to recessionary market conditions.
An interesting dichotomy existed, however, when considering index reaction to market advances. U.S. ETFs using fundamental weighting magnified market advances to an extent that was significantly better than the performance of traditional index funds. However, international ETFs using fundamental indexing underperformed the market and traditional index funds to a significant extent. The underperformance may be a reflection of the significantly higher expense ratios charged by FIFs. In answer to the question posed in the title of this research, in light of the fact that investors seek higher risk-adjusted returns, the findings lean slightly in favor of the wise use of fundamental factors in investment selection.
Several options exist to extend this research. For example, bond funds could be considered. Second, country-specific differences might be informative. Third, a shorter sample period could be considered in order to expand the sample. Fourth, with the passage of time, it may be possible to both increase the sample and the insight provided by each index fund. Fifth, subsets of the U.S. equity landscape could be considered, such as the advantages of fundamental indexation across large, medium, and small firms. Finally, researchers could study the portfolio formation process and performance of Arnott’s PowerShares funds, Schwab funds, WisdomTree funds, and Vanguard’s funds in order to ascertain which fundamental weighting techniques perform the best.
Endnotes
- See “Fundamental vs. Traditional Index Investing” at www.etfguide.com/fundamental-vs-traditional-index-investing.
- See www.multpl.com/s-p-500-dividend-yield/table.
References
Aked, Michael, Vitali Kalesnik, Engin Kose, Philip Lawton, and Max Moroz. 2014. “Equal-Weight and Fundamental-Weight Index Investing: A Comparison of Two Smart Beta Strategies.” Research Affiliates white paper, May
www.researchaffiliates.com.
Amenc, Noel, Felix Goltz, and Shuyang Ye. 2012. “Seeing through the Smoke Screen of Fundamental Indexers: What Are the Issues with Alternative Equity Index Strategies?” EDHEC Business School risk working paper, June, www.edhec-risk.com.
Anderson, Tom. 2013. “Has Rob Arnott Build a Better Index Fund?” Forbes June 24.
Arnott, Robert D. 2011. “Better Beta Explained: Demystifying Alternative Equity Index Strategies.” The Journal of Index Investing 2 (1): 51–58.
Arnott, Robert D., Jason Hsu, and Philip Moore. 2005. “Fundamental Indexation.” Financial Analysts Journal 61 (2): 83–99.
Benz, Christine. 2008. “Bogle on a Knock against Indexing.” Morningstar video interview posted September 23. www.morningstar.com/cover/videoCenter.aspx?id=255347.
Chow, Tzee-man, Jason Hsu, Vitali Kalesnik, and Bryce Little. 2011. “A Survey of Alternative Equity Index Strategies.” Financial Analysts Journal 67 (5): 37–57.
DeLegge, Ron. 2013. “Are Fundamental ETFs Better?” Research Magazine November.
Droms, William G. 2010. “A Fundamental Shift to Fundamental Investing.” Journal of Financial Service Professionals 64 (4): 69–75.
Forgione, Sam. 2013. “Pimco Total Return Loses Title as World’s Largest Mutual Fund.” Reuters November 4.
Hackel, Kenneth S., Joshua Livnat, and Atul Rai. 1994. “The Free Cash Flow/Small Cap Anomaly.” Financial Analysts Journal 50 (5): 33–42.
Hackel, Kenneth S., Joshua Livnat, and Atul Rai. 2000. “A Free Cash Flow Investment Anomaly.” Journal of Accounting, Auditing & Finance 15 (1): 1–24.
Hill, Rowland R. 1976. “An Algorithm for Counting the Number of Possible Portfolios Given Linear Restrictions on the Weights.” Journal of Financial and Quantitative Analysis 11 (3): 479–480.
Hsu, Jason C. 2006. “Cap-Weighted Portfolios Are Sub-Optimal Portfolios.” Journal of Investment Management 4 (3): 1–10.
Hsu, Jason C., and Carmen Campollo. 2006. “New Frontiers in Investing: An Examination of Fundamental Indexation,” Journal of Indexes 8 (1): 32–37, 58.
Jin, Hanqing, Zuo Quan Xu, and Xun Yu Zhou. 2008. “A Convex Stochastic Optimization Problem Arising from Portfolio Selection.” Mathematical Finance 18 (1): 171–183.
Kaplan, Paul D. 2008. “Why Fundamental Indexation Might—or Might Not—Work.” Financial Analysts Journal 64 (1): 32–39.
Langlois, Hugues, and Jacques Lussier. 2009. “Fundamental Indexing: It’s Not about the Fundamentals.” Ipsol Capital research paper. www.ipsolcapital.com.
Malkiel, Burton G. 1973. A Random Walk Down Wall Street. New York: W. W. Norton & Company.
Saporito, Bill. 2014. “The Triumph of Index Funds.” Time September 18.
Walkshäusl, Christian, and Sebastian Lobe. 2010. “Fundamental Indexing Around the World.” Review of Financial Economics 3 (19): 117–127.
Citation
Chang, C. Edward, and Thomas M. Krueger. 2015. “Do Fundamental Index Funds Outperform Traditional Index Funds?” Journal of Financial Planning 28 (12): 40–48.