Journal of Financial Planning: August 2016
Mark J. Warshawsky, Ph.D., is a senior research fellow at the Mercatus Center at George Mason University, president of ReLIAS LLC, and visiting scholar at the MIT Center for Finance and Policy. He is the author of more than 150 scholarly articles and four books, and previously served as Assistant Secretary for Economic Policy at the U.S. Treasury Department and was a member of the Social Security Advisory Board.
Acknowledgments: The author appreciates the excellent programming assistance to this research provided by Ted Goodman, other assistance by Ross Marchand, and the helpful detailed comments given by two anonymous reviewers.
Executive Summary
- A combination strategy of laddered purchases of immediate life annuities and fixed percentage withdrawals from a portfolio whose assets are being dynamically allocated represents a promising way for retirees to manage their retirement assets in order to get lifetime income in a flexible manner while still maintaining growth, liquidity, and bequest potentials.
- Simulations showed that by age 95, a retiree using this strategy would get higher income in inflation-adjusted terms, on average, across most scenarios, than by using full and complete annuitization or using the 4 percent withdrawal rule.
- Simulations also showed significant real retirement balances remaining at all ages and scenarios.
- The combination laddered strategy can be tailored to the preferences of the retired household for higher income, rising income, a larger bequest, a firmer income floor, or more growth potential.
The use of life annuities for retirement account assets by participants in qualified plans and holders of deductible and rollover individual retirement accounts (IRAs) is of great interest to analysts, policymakers, and advisers. With the decline in automatic annuitization from defined benefit pension plans, many are concerned about the financial security of retirees—that retirees receive continual income payments over increasingly longer lifetimes. Experts recognize, however, that voluntary full and total annuitization may be an unrealistic and even inappropriate goal for most retired households. Therefore, partial annuitization strategies need to be fully explored.
This paper builds on prior, related research to show the advantage of a broad genus of partial annuitization combination strategies using systematic withdrawals from a dynamically changing investment portfolio together with the laddered purchases of immediate life annuities over an extended period of time. The flexibility and security of these strategies are explained here. And their risk and return properties, compared to other strategies such as full and complete annuitization and asset-only withdrawals, are shown to be attractive in historical simulation modeling.
Literature Review
Warshawsky (2015b) conducted a comprehensive comparison of two simple retirement income strategies: the Bengen (1994) withdrawal rule and the immediate life annuity. In particular, by using historical simulations, differences were calculated between the inflation-adjusted (“real”) annual income produced by the Bengen rule (4 percent initial annual withdrawal, subsequently indexed for the rate of inflation) and the estimated inflation-adjusted income produced by a joint-and-50-percent-to-survivor nominal immediate life annuity for a couple of the same age. These differences, starting at various retirement ages, were averaged over the remaining lifetimes of various historical cohorts (for example, 62 year olds who retired in 1955) and then averaged over all the cohorts. This 2015 study calculated the cohort lifetime average in two ways: as a simple average over the entire possible horizon (to age 110), and as an average weighted by survival probabilities. The study also counted the number of cohorts in which the Bengen rule produced higher average income than did the life annuity at various retirement ages.
For retirement age 55, Warshawsky’s results indicated that the Bengen withdrawal rule was superior to the life annuity. The Bengen rule produced higher income in more cohorts, and the average value of income differences, measured by the mean across cohorts, was significantly positive at $720 a year for a $100,000 initial retirement account. With an early retirement age—and therefore a long retirement period—the force of inflation wore down the nominal life annuity, and the possibility of favorable asset returns over the long run favored the Bengen rule.
The average measures weighted by mortality odds were not as impressive, though, giving greater emphasis to earlier years of retirement. As the retirement age shifted to one of the more common ages (62 to 70), the measures showed that the life annuity was the favorite, whether looking at simple averages or weighted averages of counts of income differences. For example, at age 67, the Bengen rule produced higher average income in only about two-fifths of the cohorts, and the average annual real income difference was negative (–$794). With survival weighting, the results were even worse under the Bengen rule.
However, it should not be concluded that the complete use of the immediate life annuity is always or even necessarily the superior distribution method for the entire portfolio of asset holdings in individual accounts for retirees. Some retirees will have impaired longevity prospects; for them, the immediate life annuity would be a relatively poor choice. Other retirees, perhaps facing idiosyncratic risks or with inadequate insurance coverage (for health, long-term care, their homes, or something else) may need liquidity, which a life annuity is not able to provide. Finally, and perhaps more likely for middle-class to wealthy people, retirees may have the wherewithal and desire to leave bequests to their children and to charitable institutions.
Could combination strategies improve on the use of either a life annuity or withdrawal strategy alone? Ameriks, Veres, and Warshawsky (2001) began to address the issue of combination strategies—that is, using both immediate life annuities and systematic withdrawals from an appropriately invested portfolio. In particular, the Ameriks, Veres, and Warshawsky study used up to half of the initial portfolio (for an individual age 65) to purchase an immediate life annuity, assuming it is priced with a 7 percent interest rate and annuitant mortality. Income flowed from the nominal annuity, and portfolio withdrawals were combined to try to reach a goal of 4.5 percent inflation-adjusted continual income. If the retirement investment portfolio was aggressively allocated (85 percent to stocks), and the initial allocation of initial resources was 50 percent to the life annuity, an inflation-adjusted income of at least 4.5 percent could be distributed over 35 years in 95 percent of simulations (i.e., a 5 percent failure rate to age 100 when starting at age 65). Moreover, in only 7.4 percent of simulations did the portfolio fail over 40 years (although failure was not complete because the life annuity continued to pay). These failure rates were substantially lower than if a life annuity was not used (11.8 percent over 35 years for a no-annuity case).
Moreover, according to Ameriks, Veres, and Warshawsky, the residual portfolio value was not that much lower for the median simulation (2.28 times the original portfolio value over 35 years with a 50 percent initial allocation to the life annuity, compared with 2.78 times with no annuity). This example illustrates well Finke, Pfau, and Blanchett’s (2013) speculation that partial use of a life annuity in a portfolio may be a worthwhile trade-off of residual wealth for income and security.
It must be cautioned, however, that the assumption by Ameriks, Veres, and Warshawsky of a relatively high point in the interest rate cycle in 2000 (i.e., a low point in the pricing cycle for fixed life annuities) may bias the results somewhat in favor of the annuity. That possibility bears further empirical investigation and a more refined methodology with comprehensive historical data and simulations of annuity pricing, as will be done in this paper. The simulation of annuity pricing over time and income payments discounted by inflation realizations, as well as the complex programming needed to represent laddered purchases of annuities, is a methodological advance in this paper, and is necessary to accurately evaluate partial combination strategies, including laddered annuitization, using the historical simulation methodology.
Warshawsky (2012) worked further on the obvious next phase of analysis—creating strategies that combined laddered purchases of smaller amounts of immediate life annuities over time (i.e., dollar-cost averaging) and systematic withdrawals from a balanced investment portfolio. Because of the laddering, this approach provided some protection against interest rate risk (that is, annuity pricing and timing). Because it may be stopped at any time, say when a spouse gets sick or there is an uninsured financial emergency, laddering is more flexible to the retired household than a one-time purchase. The timing and extent of annuity purchases and the nature of systematic withdrawals from the retirement asset portfolio, as well as asset allocations, can result in thousands of combinations and may be optimized and customized to the many different situations among retired households.
Chapter 7 of Warshawsky (2012) focused on this particular combination strategy: the optimal split and timing of systematic withdrawals and laddered purchases of immediate life annuities. This was examined for a 65-year-old individual and a couple of the same age. The choice criterion was to minimize the shortfall risk, defined as the weighted probability of real income and wealth balances falling below certain thresholds.
For an individual age 65, the analysis found that the optimal strategy was to annuitize 10 percent of wealth initially and the remainder over 20 years, and to simultaneously take a fixed 5 percent withdrawal from retirement wealth balances while they remained. The equity share increased from 50 percent at age 65, to 100 percent at age 74. This strategy produced the lowest weighted shortfall risk.
Several alternative scenarios and situations were also modeled. If less emphasis was placed on income shortfalls, the optimal initial annuitization was 0 percent at age 65, and increased to 20 percent of wealth by age 70. The optimal equity allocation also increased to only 62.5 percent by age 70, and the withdrawal rate increased to 6 percent. If high priority was given to income production and the initial equity share was larger (70 percent), only the initial annuitization percentage changed from the base results—to 15 percent of wealth—and everything else remained the same. If the individual retired at age 60, the optimal annuitization period extended to 25 years. For couples, the optimal strategy was no initial annuitization and a longer annuitization period—30 years. This strategy concurred with the notion that there is some intra-family mortality risk pooling with a couple and thus slower and lower desired annuitization. The equity share reached 100 percent at age 80. If there was less emphasis on income production, couples would skip annuitization entirely and withdraw at a 6 percent rate.
Other research on this topic includes Dus, Maurer, and Mitchell (2005) in which a stochastic simulation analysis of various strategies was conducted, including for an individual at the beginning of retirement to purchase a deferred annuity (to begin to pay at age 75 or 85). This is the longevity insurance strategy advocated by some researchers such as Milevsky (2005) and Scott (2008). Dus, Maurer, and Mitchell found that the outcomes were generally inferior to delayed immediate annuitization, particularly for longevity insurance at age 85, and especially if bequests or liquidity were desired.
Gong and Webb (2010) examined longevity insurance more formally, comparing it with complete annuitization through a real (inflation-indexed) immediate annuity, postponing complete annuitization to a late age, and systematic withdrawals. Gong and Webb did not, however, consider annuity ladders. They employed an expected utility model with no risky assets or bequest motive. With retirement at age 65 and moderate risk aversion, complete immediate annuitization was found to be preferred to the alternative strategy that included longevity insurance commencing payment at age 85, because longevity insurance had a much higher expense load.
Pfau (2015) looked at several variable spending strategies (dividing them into decision rule and actuarial methods) with certain desired properties and evaluated their expected performance on a consistent basis using a stochastic model of asset returns and inflation. Pfau focused on the real income in 10, 20, and 30 years from retirement, and the remaining real wealth in 30 years produced by these strategies at the 10th, 50th, and 90th percentiles of the distribution. This study employed an evaluation framework similar to that used by Pfau.
Empirical Methodology
The empirical methodology used in this paper was the same as in Warshawsky (2015b), using the historical simulation approach commonly found in the financial planning literature.
The analysis in this paper started with life annuities. The focus was on gender-neutral workers who retired at age 65. The annual income from an immediate life annuity for a $100,000 investment was the starting point of the analysis; more specifically, a joint-and-100-percent-to-survivor immediate life annuity to a heterosexual couple of the same age. A joint-and-full annuity was chosen in order to be comparable to the Bengen rule, which tries to pay out the same amount regardless of survivorship, even though a 50-percent or 67-percent-to-survivor annuity is probably sufficient, given a reduction in the cost of living when one member of the couple passes away. Simulations of the fixed nominal incomes from life annuities were based on historical yields on constant-maturity, 10-year Treasury bonds and unisex mortality tables with a cutoff age of 110. The adjustment to real (inflation-adjusted) incomes was based on historical observations of price inflation subsequent to the retirement age and date, 10, 20, and 30 years later.
The model used here for annuity pricing, the same one as in Warshawsky (2015a and b), is relatively simple. It employed the yield on the 10-year Treasury bond and the unisex annuitant mortality table currently enjoined by the IRS for certain pension and other purposes. The mortality table was a projection 10 years into the future based on estimated current experience. Long historical time series of annuity prices were not available, so modeling of prices were used for the simulations. Moreover, because actual prices would reflect changes in assumed mortality rates over time, as well as changes in financial and economic conditions, the focus in this paper on the sole impact of possible future changes in financial and economic conditions was better served by modeling of annuity prices. Unisex annuity pricing was legally relevant and required only for employer-provided retirement plans and for commercial sales in the state of Montana; in actual cases for men, cheaper annuities would be available in the commercial market.
As shown in Warshawsky (2015b), this pricing model produced results quite close to actual prices averaged over about 15 insurance companies’ nominal immediate annuities in the Cannex database over the last 10 years, so that the calculated average negative 1 percent load reported there was used in this paper. Also, as shown there, the calculated load did not differ by the size of the life annuity. On March 16, 2016, when the yield on the 10-year Treasury bond was 1.91 percent, the immediateannuity.com quote for a $100,000 straight life annuity (blended gender) for a 65 year old was $6,474 annual income, and the annuity pricing model used by the author produced $6,211; that is, a −4 percent load.
For inflation-indexed immediate life annuities, as shown in Warshawsky (2015a), a load of 12 percent was needed to get close to actual recent pricing sold by two insurance companies in the last two years. The simple regression equation for the real interest rate on the nominal rate (based on daily yields on TIPS and nominal 10-year Treasury bonds from January 3, 2005 through June 9, 2014 produced TIPS yield = −1.8 + 0.88 × nominal Treasury yield) used in the historical modeling of the inflation-indexed annuity pricing was further explained in Warshawsky (2015a).
The annual real income produced by strategies using systematic withdrawals was simulated by using historical observations of asset returns on the S&P 500 stock index portfolio and a portfolio of 10-year Treasury bonds, as well as consumer price inflation. In particular, a retirement investment fund was modeled, initially with 50 percent equity and 50 percent bonds, with a low 20 basis point investment management fee charged, rebalanced following changes in annual market returns and withdrawals, and any purchases of immediate life annuities. For the partial annuitization strategies, annuities were considered to be fixed-income instruments. To keep overall investment risk roughly constant, bonds were replaced in the portfolio as annuities were purchased until equities took up more of the investment portfolio, up to 100 percent.
This study reprised the analysis of annual withdrawals following the simple withdrawal rule first put forward by Bengen (1994). The first strategy was 4 percent of the initial portfolio value at the point of retirement, which produced a particular dollar amount that was subsequently increased by the actual rate of inflation. Then various other strategies, including combination strategies, were modeled. In particular, an inflation-indexed annuity was examined, and the Bengen rule was modified to 3.2 percent (reflecting a more sober view of future asset returns).
For the combination strategy with laddered annuitization, 15 percent of retirement wealth was annuitized initially, increasing to 25 percent of wealth over 20 years—that is, annual purchases from age 66 to age 85 of 0.5 percent of initial wealth were assumed to grow at the current interest rate. This annuitiziation operated simultaneously with a fixed percentage withdrawal rule (here shown as 4.75 percent, akin to the distributions from variable annuities with guaranteed lifetime withdrawal benefits, but different rates may be optimal for the specific household situation).
To understand the combination strategy better, laddered annuitization and fixed percentage strategies were also evaluated as operating separately. Finally, two partial annuitization combination strategies were compared—laddering from 0 percent to 25 percent over 20 years, and an initial purchase of an immediate annuity using 25 percent of wealth with no further purchases, both combined with 4.75 percent asset withdrawals.
The historical annual asset return and inflation and interest rate data used in this paper came from Robert Shiller’s public access database. Shiller’s data begins with the year 1871 and continues to the present, but only data starting in 1919, after World War I and the creation of the Federal Reserve System to reduce financial and economic volatility, through 2013 was used.
Bond returns (not found in the Shiller database), based on the yield and change over the year in yields for 10-year, constant-maturity Treasury bonds, were calculated by formula, so that the return arising from the change in bond price is
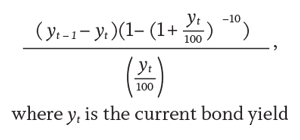
For the historical simulations here, the results included and ended with the cohort of 65 year olds retiring in 1983, so there were a total of 65 observations in the simulations.
Empirical Results for Retirement Income Strategies
Table 1 compares results for the various retirement income strategies mentioned previously on a basis comparable to the literature cited earlier for the Bengen withdrawal rule. For cohorts retiring from 1919 through 1983, results of historical model simulations were examined for year one, year 10, year 20, and year 30 inflation-adjusted annual incomes from a $100,000 retirement asset account. The remaining retirement portfolio in year 20, approximately the life expectancy of a 65 year old, is also shown. Table 1 reports the 10th, 50th, and 90th percentiles of the range of historical experiences for each strategy.
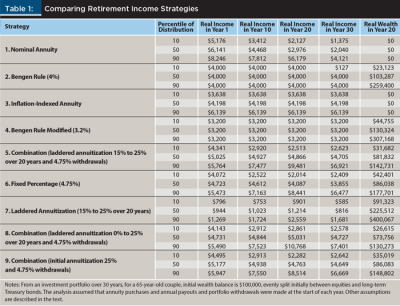
The first strategy displayed in Table 1 shows that in the first year of retirement, the immediate life annuity provides the highest annual income compared to all the other strategies. At the median, annual income is $6,141. The range of initial incomes (from $5,176 to $8,246) arises from different interest rates, with high interest rates producing more income; so there is timing risk with complete annuitization. Over the years, the nominally fixed incomes decline; how fast, in real terms, depends on the realization of inflation. At the median, by year 30, annual income is $2,040 (payments continue, however, for the lifetimes of the retirees). In some scenarios, inflation is quite modest, and real income stays fairly robust. Moreover, some decline in real incomes may be acceptable, especially with high initial income, because spending during retirement generally does decline with age if health costs are insured, as travel is curtailed and so on.
The second strategy shows the Bengen rule, which gives a steady real income of $4,000 across scenarios, as well as a positive fund balance (real wealth) in the 20th year of retirement, even though wealth does vary widely with market performance. At the median, the fund balance is almost identical to what the retiree started with, in real terms ($103,287). But by year 30 of the historical simulation (at age 95), the Bengen rule has failed about 11 percent of the time; wealth has fallen to zero. Keep in mind that for a 65-year-old couple, there is nearly a one-in-five probability of one person surviving past age 95.
The third strategy shows results for an inflation-indexed annuity. Income is much lower than for the nominal annuity across all scenarios in the first year ($4,198 at the median) and for most scenarios in the 10th year. By the 20th year and beyond, however, the steady real income from the inflation-indexed annuity is generally higher than for the nominal annuity. Of course, with complete annuitization, there is no fund balance left at any age.
The fourth strategy is the Bengen rule modified for sustainability. Real income, by construction, remains flat across the retirement life cycle at $3,200, and there is no portfolio failure through age 95. Real wealth at age 85 ranges widely but at the median is $130,324. If the emphasis is on wealth preservation and a low, steady income is acceptable, then the modified Bengen rule may work out for the retired household.
If, however, a generally higher level of income is desired with some upside potential and an income floor, as well as significant real wealth remaining at the life expectancy and beyond, then the fifth strategy illustrated in Table 1 (the combination fixed percentage withdrawal and laddered annuity purchases) is superior in the simulations.
An example of such a combination strategy is an initial purchase of an immediate life annuity that uses 15 percent of wealth balances ($15,000 from a $100,000 account), followed by additional small purchases of life annuities (0.5 percent of initial wealth whose growth is projected at the current interest rate) that are made over 20 years until 25 percent of projected wealth is annuitized. These laddered annuity purchases are a type of dollar-cost averaging and therefore somewhat protect against pricing risk and give some boost to nominal income to account for inflation. Simultaneously, the retired household withdraws 4.75 percent of wealth balances annually and reallocates investments so as to keep to the initial allocation, counting life annuities as fixed-income instruments. Note that this is only one implementation of the type of combination laddered strategy proposed here; other implementations, say with longer or lower or higher annuitization paths, or higher or lower withdrawal rates, may be best in particular situations to meet specific goals, preferences, and needs of a retired household.
As seen for the combination strategy (No. 5 in Table 1), the first-year income is generally higher than the inflation-indexed annuity (at the median, it is $5,025); moreover, in some scenarios, with rising asset values supporting high withdrawals, and/or high interest rates supporting rising annuity incomes, real incomes rise over time, as do real wealth balances (to $142,731 at age 85 in the 90th percentile). At the median, income is fairly steady with $4,705 at the 30-year horizon, which is higher than the median for the inflation-indexed annuity, and $81,832 remains in the real wealth portfolio with the combination strategy versus $0 with the pure annuity strategies. In the 10th percentile of the combination strategy outcomes at later ages, both real income and wealth levels are more modest, but the annuity laddering supports an income floor of $2,623 at the 30-year horizon, and $31,682 in real balances.
The sixth and seventh strategies in Table 1 show the two components of the combination strategy operating separately. Each strategy alone does not work as well as the combination strategy; with the fixed percentage, incomes are too volatile, and the laddering (at least at the indicated extent of annuitization) gives too low an income. But as seen, the laddering does provide a real income floor that rises through the life expectancy, regardless of asset market conditions. Moreover, the fixed percentage strategy does have the desirable feature that, with good asset market performance, the standard of living generally rises.
Finally, the eighth and ninth strategies compare two partial annuitization combination strategies; first the laddering strategy, starting at zero percent and increasing to 25 percent of wealth by 20 years; and the second strategy simply starting and stopping with 25 percent of wealth annuitized initially. Both of these strategies have the combined feature of 4.75 percent withdrawals from the portfolio.
Strategy No. 8 produces outcomes quite close to strategy No. 5, except income is somewhat lower in the early years ($4,731 at the median in year one) and somewhat higher in the latter years ($5,031 at the median in year 20), and real wealth is somewhat lower at year 20 ($73,756 at the median). The partial immediate annuitization strategy shown (No. 9) has higher initial income ($5,177 at the median in year one), lower income in later years, especially when there are poor returns and high inflation ($2,282 at the 10th percentile in year 20) and generally higher wealth outcomes.
How the Combination Strategy Fared
Consider in more detail how the partial and laddered annuitization combination strategy worked and fared by adding the mean, 25th, 75th percentiles of outcomes to the presentation of the analysis of strategy No. 5 from Table 1. The focus here shifts to means because income from annuities and distributions from the account balances sum to total income only at the mean, as the percentile results are reported for each individual cell.
In Panel 1 of Table 2, representing the range of experiences for the first year of retirement, $993 in income comes from a life annuity and $4,028 comes from systematic withdrawals, totaling $5,022, at the mean. Although this is less income than what complete and total nominal annuitization would bring initially, it is more than what the traditional Bengen withdrawal rule produced and much more than the modified Bengen rule. The remaining retirement account balances here are still quite significant, $85,314 at the mean, representing considerable liquidity for emergencies and a contingent bequest.
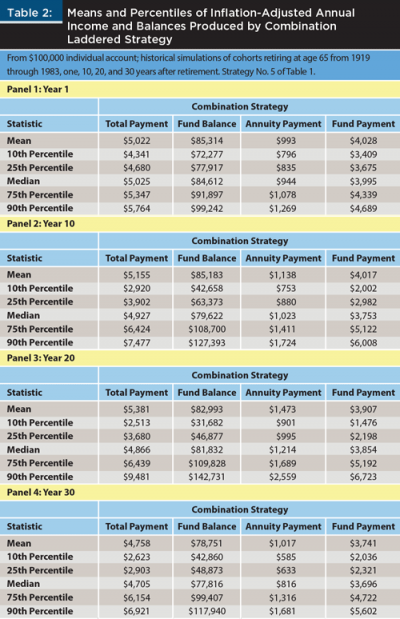
In Panel 2, representing the range of experiences in inflation-adjusted terms for the 10th year of retirement, outcomes widen in the combination strategy for both annual real income flows and wealth balances. Income ranges from $2,920 to $7,477, with generally more dependency on life annuity payouts; real wealth balances range from $42,658 to $127,393. Still, the averages and medians of the combination strategy are nearly unchanged from the amounts in the first year of retirement, despite the passage of nine years, distributions for purchases of life annuities and withdrawals from retirement accounts, ups and downs of the markets, and gradual degradation as a result of inflation. Moreover, at the median, an income surplus from the combination strategy compared to complete and total annuitization has materialized ($459), and the income surplus compared to that under the traditional Bengen withdrawal rule remains about $1,000. Again, the partial annuitization combination strategy preserves liquidity and bequest possibilities well, compared to total annuitization.
In Panel 3 of Table 2, representing the range of experiences in inflation-adjusted terms for year 20 of retirement (age 85), some of the real strength of the combination strategy is becoming apparent. Average income, at $5,381, increases somewhat compared to year 10. In better outcomes, where investments performed well and/or inflation was relatively tame, real income is $9,481 and real wealth balances are $142,731. Even in bad times, income levels remained healthy and balances remained significant, especially considering the passage of time, inflation, and so forth. In addition, the range of experiences for remaining wealth is less risky compared with that produced by the Bengen rule. In particular, the range (90th percentile less the 10th percentile) divided by the mean is 1.34 for the combination laddered strategy, compared to 1.96 for the Bengen rule.
Panel 4 of Table 2, representing the range of experiences in inflation-adjusted terms for year 30 of retirement (age 95), shows the ultimate test of a strategy. Here, the robust superiority in simulations can be seen of the combination strategy compared with complete and total annuitization and the Bengen withdrawal rule. Average income ($4,758) and incomes across all experience percentiles are significantly higher than with complete and total annuitization in inflation-adjusted terms, while large balances remain, on average ($78,751) and across the various percentiles. The positive skewness of real income seen in year 20 goes away somewhat by year 30, because in the historical experience, inflation eventually wears away fixed annuity payments. Comparing the combination strategy with the Bengen rule, in year 30 there is no risk of running out of money and real income is higher on average and in most percentiles. The fixed-percentage approach of the combination strategy compared to the fixed-dollar (inflation-indexed) approach of the Bengen rule gives lower risk overall, and the bulwark of the life annuity payouts—even degraded by inflation—also helps.
Although there is no doubt the combination strategy can and should be refined to get the optimal mix of outcomes across various environments to more precisely reflect a retired household’s goals, risk preferences, and needs, the superior performance of the combination strategy in the simulations is evident.
To further illustrate these results, Figures 1, 2, and 3 show three specific cohorts: the simulated experience of those who retired at age 65 in 1932, 1966, and 1982, comparing lifetime inflation-adjusted annual incomes from a joint-and-survivor immediate life annuity with incomes from the combination strategy explained above, and showing the remaining account balances under the combination strategy.
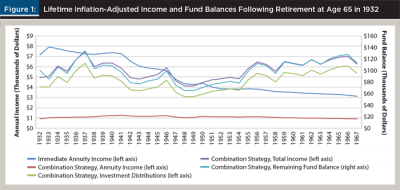
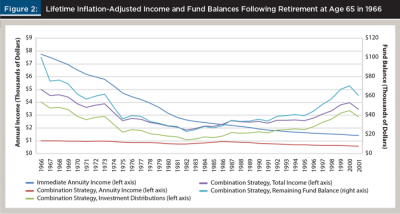
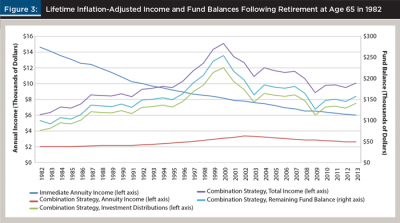
For the 1932 and 1966 cohorts, “lifetime” means a horizon through 36 years (i.e., age 101); for the 1982 cohort, only a 32-year horizon was available. These three illustrations show a wide range of outcomes, reflecting the very different historical experiences of these cohorts with interest rates, inflation rates, and asset returns, which are included in the summary statistics reported earlier.
The first cohort initially experienced an economic recovery and low inflation (even deflation), but then inflation picked up after World War II, as did equity returns. The second cohort ran into a deep decline in asset returns and high inflation soon after retirement, and the third cohort started with high interest rates and then experienced generally good, but volatile, asset returns.
For the 1932 cohort, immediate annuity income started out quite high, but then fell over time with inflation. The combination strategy, however, had total income fairly high and increased with time, only dropping with declines in the stock market in the late 1930s and after World War II. By age 100, both real income and real wealth were near lifetime highs.
For the 1966 cohort, both high inflation and poor asset markets were damaging to all strategies, but the combination strategy (income and balances) recovered with lower inflation and good asset performance later in life, while real income from the nominal annuity continued to decline.
For the 1982 cohort, high interest rates produced initially high nominal annuity income, while rising asset markets produced rising incomes for the combination strategy through 2000, while the annuity laddering cushioned the fall of asset markets thereafter.
Alternative Combination Laddered Strategies
To round out the analysis, consider some alternative combination laddered strategies. Strategy A in Table 3 is the combination strategy already discussed. Strategy B uses a higher extent and faster laddering of annuitization (20 percent to 45 percent over 15 years), balanced out by a much lower withdrawal rate from the retirement investment portfolio (2.25 percent). Real income is lower initially, but it increases with age at the median and is steadier in the lowest percentile. It also produces uniformly higher real wealth than strategy A.
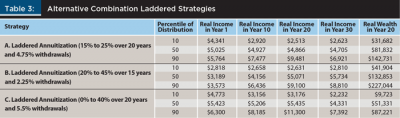
Strategy B might be more appropriate for a household that is still working part-time in the early stages of retirement and does not need as much income immediately, but wants the strong prospect of increasing real income when work stops completely. This household also wants to leave a significant bequest to children.
Strategy C uses a higher withdrawal rate (5.5 percent) and a fairly extensive and lengthy annuitization (0 percent to 40 percent over 20 years). Initial income is the highest of the three strategies, and real income is more volatile and can be quite high but tends to decline by the end of life. Real wealth is the lowest of the three combination strategies. Strategy C might be most appropriate for a couple who wants higher income flows, desires to experience upside potential with their income, and has a more modest bequest motive.
Tax Considerations
Regarding tax considerations, an immediate life annuity has no particular tax advantage or disadvantage compared to ordinary fixed income assets, unlike a deferred annuity that has tax-favored treatment as an accumulation investment. In a taxable portfolio, income from the immediate annuity is taxed according to the exclusion ratio, which is the tax code’s method of providing equivalent treatment to payments from the life annuity to interest from non-life-contingent fixed assets.
In a tax-preferred retirement investment portfolio (deductible or rollover IRA or 401(k) account), income from annuities is taxed as income. As fixed-income instruments, the use of immediate life annuities in the retirement portfolio may have some advantage compared to highly tax-advantaged equities, such as growth stocks, which might be better held in a taxable portfolio. The minimum distribution rules may require higher rates of withdrawal from the retirement portfolio than otherwise desired past age 70½; immediate life annuities automatically satisfy the distribution rules.
Conclusion
The higher equity allocation at older ages in the combination partial laddered annuitization strategy is justified by the higher allocation to life annuities (a guaranteed fixed-income instrument) in the overall mix of retirement resources being used by the household. This aspect of the strategy is important to the favorable outcomes reported here, particularly on the upside. It should be explained and illustrated up-front, to assuage any concerns later on from the household (or their relatives) and regulators who might view the investment portfolio in isolation.
Strategies for the laddered purchases of immediate life annuities combined with fixed percentage asset withdrawals represent a promising way for retirees to manage their assets to generate generally high and sometimes increasing lifetime incomes in a flexible manner while maintaining asset growth, liquidity, and bequest potentials, according to historical simulations.
The simulated outcomes show that even at age 95, a retiree who has used partial laddering annuitization combination strategies will get higher income, in inflation-adjusted terms, on average and across most scenarios than with full and complete annuitization or under the Bengen withdrawal rule. Moreover, a significant real retirement fund balance remains at age 95; the real balances are generally not, on average, as large as with the Bengen rule, but there is no risk of running out of assets. Also, combination strategies can be customized and personalized to the preferences, goals, and needs of the retired household.
References
Ameriks, John, Robert Veres, and Mark Warshawsky. 2001. “Making Retirement Income Last a Lifetime.” Journal of Financial Planning 14 (12): 60–76.
Bengen, William P. 1994. “Determining Withdrawal Rates Using Historical Data.” Journal of Financial Planning 7 (4): 171–180.
Dus, Ivica, Raimond Maurer, and Olivia S. Mitchell. 2005. “Betting on Death and Capital Markets in Retirement: A Shortfall Risk Analysis of Life Annuities versus Phased Withdrawal Plans.” Financial Services Review 14 (3): 169–196.
Finke, Michael, Wade D. Pfau, and David M. Blanchett. 2013. “The 4 Percent Rule Is Not Safe in a Low-Yield World.” Journal of Financial Planning 26 (6): 46–55.
Gong, Guan, and Anthony Webb. 2010. “Evaluating the Advanced Life Deferred Annuity—An Annuity People Might Actually Buy.” Insurance: Mathematics and Economics 46 (1): 210–221.
Milevsky, Moshe A. 2005. “Real Longevity Insurance with a Deductible: Introduction to Advanced-Life Delayed Annuities (ALDA).” North American Actuarial Journal 9 (4): 109–122.
Pfau, Wade D. 2015. “Making Sense Out of Variable Spending Strategies for Retirees.” Journal of Financial Planning 28 (10): 42–51.
Scott, Jason S. 2008. “The Longevity Annuity: An Annuity for Everyone?” Financial Analysts Journal 64 (1): 40–48.
Warshawsky, Mark J. 2012. Retirement Income: Risks and Strategies. Cambridge, MA: MIT Press.
Warshawsky, Mark J. 2015a. “Illustrating Retirement Income for Defined Contribution Plan Participants: A Critical Analysis of the Department of Labor Proposal.” The Journal of Retirement 3 (1): 12–26.
Warshawsky, Mark J. 2015b. “Distribution Methods for Assets in Individual Accounts for Retirees: Life Income Annuities and Withdrawal Rules.” The Journal of Retirement 3 (2): 105–122.
Citation
Warshawsky, Mark J. 2016. “New Approaches to Retirement Income: An Evaluation of Combination Laddered Strategies.” Journal of Financial Planning 29 (8): 52–61.