Journal of Financial Planning: August 2015
Robert J. Atra, Ph.D., CFA, is professor and chair of the department of finance, and academic director of the M.S. in Finance program at Lewis University in Romeoville, Illinois. He has published papers on investment strategies and equity returns and is co-author of three chapters in The Valuation Handbook.
Yuntaek Pae, Ph.D., CFA, is associate professor of finance at Lewis University in Romeoville, Illinois. His research interests include portfolio management, investments, and asset pricing. Prior to his work in academia, he was employed as an equity analyst.
Executive Summary
- Highest-in, first-out (HIFO) accounting is a technique used when liquidating shares in a taxable account to capture tax benefits sooner rather than later.
- This study builds on previous HIFO research by investigating the impact of volatility of returns on the benefit provided by HIFO accounting to determine if more volatile securities have a greater tax benefit.
- Results indicate that the effect of volatility on the total dollar benefit of HIFO is not always clear. However, when expressed as a percentage of wealth, above-average volatility increases the HIFO benefit substantially after controlling for return. While, on average, HIFO can increase wealth by about 1 percent, more volatile assets may have HIFO benefits three times as large.
- This study can help financial planners understand the effectiveness of a HIFO strategy and the benefit of locating high risk/return investments in taxable accounts.
The purpose of this study was to analyze the effect of taxes on long-term investments such as those targeted for retirement in taxable (non-qualified) accounts. More specifically, this study sought to determine whether volatility can play an economically significant role in influencing long-term wealth accumulation if investors choose to determine the basis of stocks according to highest-in, first-out (HIFO) accounting. By using HIFO accounting, investors sell stocks with the highest bases first as a way to capture a tax benefit sooner rather than later.
Portfolio management for taxable investors entails maximizing returns for given risk after consideration of tax effects. Taxes, therefore, represent a friction that investors must explicitly account for in achieving their financial goals. Unfortunately, much financial theory is based on assumptions of frictionless markets. These assumptions may not represent a realistic environment in which most investors make decisions. Tax issues are complicated by voluminous pages of tax law in each country and myriad investment options facing investors as they choose among tax-free, tax-deferred, and fully taxable investments.
Tax issues have been researched in numerous studies. For example, computing after-tax returns for mutual funds was analyzed by Dickson and Shoven (1993). Jeffrey and Arnott (1993) and Arnott, Berkin, and Ye (2001) investigated ways to improve performance through tax management.
Berkin and Ye (2003) examined the benefits of tax loss harvesting and HIFO accounting. The tax loss harvesting technique involves an active management process where portfolio managers sell shares when the price drops below their basis. HIFO accounting entails tracking the basis of shares purchased and selling shares with the highest basis first, thus maximizing the present value of tax shelters.
Others, such as Horan (2003) and Horan and Peterson (2001), researched the return differences between accounts that have different tax characteristics, such as traditional and Roth IRAs. Horan and Adler (2009) tested the extent to which investment advisers make tax-aware recommendations and confirmed the use of HIFO accounting by wealth managers.
The impact of volatility on the effect of HIFO accounting has been studied tangentially. Atra and Mann (2011) showed the benefits of HIFO accounting in comparing lump sum versus dollar cost averaging investment strategies. Their results indicated the value of HIFO accounting is positively related to the number of investment purchases. They found that HIFO has a small impact on total wealth. Atra and Pae (2014) investigated the effect on wealth of using HIFO accounting by simulating various retirement scenarios and found volatility had a small positive impact on wealth at retirement.
Volatility of returns plays a role as more volatile returns will have an effect on share prices, which can influence any wealth benefit attributed to HIFO accounting. If returns are more volatile during a period when investors are accumulating shares, the volatility will lead to a wider range of bases from which the investor may choose. As the investor has more choices when liquidating stocks, the HIFO benefit could become more pronounced.
The following figures help illustrate the issue. In Figure 1, note the effect volatility could have on share prices for two hypothetical investments. In panel A of Figure 1, the solid line represents an investment growing at a given rate of return with no volatility. The dashed line represents an investment that grows at the same long-term rate but with volatility. For an investor making periodic purchases of the investment, the investment with volatility will result in a greater range of bases. This wider range of bases will give the investor the option of selling the shares with the highest bases first that will result in a greater benefit when invoking a HIFO accounting procedure.
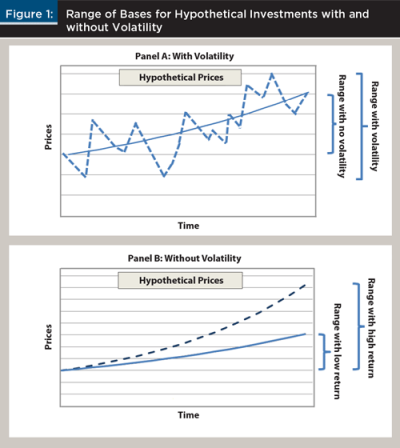
Volatility is not alone in determining the range of stock bases accumulated over time. Return itself plays an important role, as higher return investments will rise in price more rapidly and result in a wider range. Panel B of Figure 1 demonstrates the role return plays for hypothetical investments assuming no volatility and different rates of return. As illustrated, the high-return investment provides a much wider range of bases by virtue of the rapid growth in share price. Therefore, rate of return should be positively correlated with a benefit due to HIFO accounting.
However, neither of the above hypothetical cases fully describes reality. Return is not separate from risk, so it is likely that more volatile investments should also have greater returns over time as investors are compensated for risk.1 Conversely, due to the mathematical effects of compounding, investments with higher volatility will have lower growth, all else equal. That is, if two assets have the same arithmetic mean return, the asset with the higher standard deviation of returns will have a lower geometric mean return and, hence, lower growth. In that sense, volatility could have the two competing effects on HIFO benefits: higher volatility can lead to a wider range of bases but could also decrease growth, which can result in a lower range of bases. Exactly which effect dominates is the focus of this study.
Finally, increased return may lead to a higher range of bases but not necessarily a higher benefit due to HIFO accounting when measured as a percentage of wealth. Because previous research has shown the HIFO benefit as a percentage of wealth, the simulation in this study sought to determine the effects of the above on the relative effect of HIFO on wealth accumulation. Specifically, does it indeed add an economically significant benefit to the level of wealth achieved?
Empirical Study
The Internal Revenue Service (IRS) recently put into place rules regarding basis tracking. The rules, phased in between 2011 and 2013, require securities firms to track the basis of shares being sold. For example, a mutual fund investor liquidating shares from a taxable account must choose a cost basis method to use. Funds typically give choices of average cost, first-in, first-out (FIFO), specific identification, or highest-in, first out (HIFO), with the funds often having a default. Vanguard, for example, uses average cost as the default as do other fund families, although others may use FIFO, according to Morningstar (Benz 2012). Generally, it is in an investor’s best interest to sell high-basis shares first, so neither average cost nor FIFO may be optimal choices for maximizing wealth.
Consistent with the default issue, this study sought to determine the efficacy of a basic HIFO strategy compared to the simpler average cost strategy. The average cost strategy is most likely the easiest way for investors to determine stock basis. For example, in a simple setup where the investor accumulates shares during a particular period and liquidates them in the following period, the average cost of shares over the liquidation period will be identical. In that case, the average share basis can be computed as the total wealth invested in the accumulation period divided by the number of shares purchased. The simplicity of the average cost basis accounting method may be attractive to investors who may not optimize but instead choose to satisfice.2
The focus of this study is to present a realistic interpretation of HIFO accounting benefits given different levels of volatility of the investment. Unlike previous research, such as that by Berkin and Ye (2003), a hypothetical retirement planning problem was used in this study to investigate the impact of HIFO accounting. This retirement planning problem was employed by Atra and Mann (2011) and assumes investments are made for a period of 30 years, followed by a liquidation period of 15 years. The primary benefit of this design is interpretation. By dividing the time line into two distinct periods of investment and liquidation, the results can easily be interpreted in a retirement planning context. Furthermore, the design allows for the benefit of HIFO to be expressed as both a dollar amount and a percentage of wealth, which may be a more accessible concept to individual investors as opposed to alpha.
What effect does volatility have on wealth accumulation in long-term taxable accounts? To answer this question, a retirement planning problem with distinct investment and liquidation periods was constructed as previously described. To simplify further, returns on the investment were assumed to (1) be only in the form of capital gains; and (2) produce no current income. Consequently, taxes were deferred to the point of account liquidation. This design would be typical of an investor using a “tax location” strategy, such as placing income-producing investments in a tax-advantaged account, and capital-gain-producing investments in a taxable account.
When shares were liquidated, the capital gain was computed on the sales price less the original cost of the shares (basis) and represented as:
ATP = PL – (PL – BL) * T (1)
where
ATP = after-tax proceeds from sale
PL = price of the stock being liquidated
BL = basis of stock being liquidated
T = tax rate
After rearranging,
ATP = PL (1 – T) + BL * T (2)
The basis multiplied by the tax rate in equation 2 can be interpreted as a tax shelter component to after-tax returns. As shares are liquidated, the price originally paid for the shares increases the after-tax cash flow by reducing taxes paid.
The realistic lengths of the periods also provide a practical benefit to interpreting the results. Although some tax benefits may be fleeting, the time frames analyzed here provide longer-term evidence about the effectiveness of HIFO accounting in generating wealth. To make the approach more realistic, the cash flows were not fixed but were increased at a rate indicative of wage inflation, which should approximate a fixed real cash flow being invested over the 30 years. In other words, it was assumed that investors are willing to increase their contributions into an investment account as their wages increase. A nominal investment of $1,000 per year or approximately $83 per month was chosen to start. The nominal $1,000 amount allowed the results to be easily scaled up or down. It was assumed that the investment account accumulated wealth from the monthly investments and from randomly generated returns based upon parameters discussed later.
It was assumed that the retirement account was completely liquidated over a 15-year period through 180 beginning-of-the-month withdrawals. The 15-year liquidation period mimics the earlier work on HIFO strategies presented by Atra and Pae (2014). The 15-year liquidation period is reasonable given retirement dates and life expectancies. Other simulations with longer life expectancies did not change the implications of the study.
As in Atra and Mann (2011), the retirement account was exhausted by liquidating an amount from the account proportional to the time remaining. For example, in the first month, 1/180 was liquidated. The amount liquidated for each month was 1/(months remaining) until the account balance reached zero at the 180th month.
The Analysis
To test the value of HIFO accounting, cost bases were tracked for the shares during the investment period. Given the monthly period employed for the investing period, 360 different bases were generated in the typical retirement scenario. Upon reaching the liquidation stage, sufficient shares were sold to fund the liquidation, where the number of shares sold was a function of the market level at the month of liquidation and the number of months left. The shares chosen were based upon the HIFO structure, where sufficient shares were pulled out of each of the 360 cost basis “buckets” to fund the liquidation. The function of the basis was to shelter taxes as in equation 2 and provide for larger cash flows earlier in the liquidation period.
As a comparison, the previously described liquidation procedure was also used but with the share basis being the average cost from the accumulation period. Once the after-tax cash flow was computed for both the HIFO and average cost systems, the differences were taken on a periodic basis. The 180 differences were then discounted back to the time at which the liquidation period began. (The retirement date and the benefit of the HIFO accounting system was represented as both a dollar amount and a percentage of total dollar value as of that date.) Although a case can be made to discount benefits at a variety of rates, a uniform 5 percent discount rate was used in the analysis. Other slightly higher and lower discount rates were used (+/– 2 percent) with similar results and no substantial change in the implications of the analysis.
In the first analysis, a bootstrapping simulation was used to generate data. The bootstrapping technique used historical data from the S&P 500 Index during the period 1950 to August 2013. In total, 15,994 monthly returns formed the pool of returns for the simulation.
In the bootstrapping simulation, uniform random integers ranging from 1 to 15,994 were generated to pick historical returns from the pool of monthly returns. In each simulation, 360 monthly returns with replacement were randomly picked for the investment period, and 180 monthly returns were randomly picked for the withdrawal period. In total, returns were selected for 540 monthly returns from the pool of historical returns and the simulation was repeated 10,000 times.
For each simulation, the price of the stock index (cost basis), total wealth, cash flow differences between the HIFO and average cost approaches, and the net present value of the difference to the point where liquidation began were computed. The initial monthly investment was assumed to be $1,000 growing at 4.737 percent annually, which was the average annual growth rate of the U.S. wage index from 1973 to 2011 (see www.ssa.gov/oact/cola/AWI.html).
In the second analysis, a Monte Carlo simulation was used to control average return and volatility rather than depending on historical monthly stock returns. The Monte Carlo simulation generated 30 years of monthly random returns for the investment period and 15 years of monthly returns for the withdrawal period. The returns for each month were drawn randomly from a normal distribution defined by the scenario.
A monthly investment return of 0.6 percent was used in every scenario, and monthly standard deviations ranging from 1.5 percent to 9.0 percent were used to generate scenarios of different volatility. For example, in the first scenario, returns were generated from a normal distribution with a mean of 0.6 percent and standard deviation of 1.5 percent, which matched the approximate average return and standard deviation from the period used in the bootstrapping analysis. That scenario was then run 10,000 times. Other simulations were run with higher standard deviations. As with the historical return simulation, the Monte Carlo simulation was run with monthly contributions increasing at the average wage growth rate.
Results
Summary statistics for the bootstrapping simulation are shown in Table 1. The present value of the HIFO technique, on average, contributed about 0.90 percent to the value of the account at the date liquidation began. However, the results varied. At a minimum, HIFO contributed just over 0.25 percent to the portfolio, and at most, approximately 8.64 percent. Note that the HIFO technique was superior in the sense that the NPV was always positive. In other words, investors using the simplistic average cost basis underperformed those using the HIFO approach.

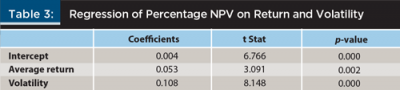
The first analysis did not answer the question about the effect of volatility on the HIFO benefit. To analyze that relationship, regressions of the HIFO benefit were run, both in dollar terms and percentage of wealth terms, in any given scenario against the standard deviation of the returns for each scenario. Results from the multiple regressions are shown in Tables 2 and 3.
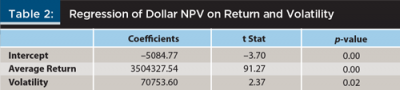
In terms of the dollar value of the HIFO benefit, both return and volatility (as measured by standard deviation) had positive effects, with return being significant at the 1 percent level.
Volatility was significant with a p value of approximately 2 percent. The return significance was not surprising given that the dollar value of any strategy was a function of the size of the portfolio. Although one would expect volatility to be positively related to the HIFO benefit, the regressions confirmed that the more variable investments yield greater HIFO benefits.
As a percentage of wealth, both variables were significant at the 1 percent level. Volatility, once again, had a positive impact on the HIFO benefit because higher volatility implies a wider range of bases to choose from when employing the HIFO strategy. The return impact, while not as intuitive, likely had a similar effect. As return increased, all else being equal, the range of bases would also be greater, because during the investment period, share prices (the bases) were increasing at a greater rate. Put another way, if the return was zero for the investment period, there would be no range of bases to choose from, rendering the HIFO strategy ineffective.
To better understand the combined effect of return and volatility on the HIFO benefit, data were split into quartiles and sorted, first by return and then by volatility. The procedure was also performed in reverse order; first by volatility and then by return. Sorting in this sequence was used to determine if there were ranges where one of the variables dominated.
Results from the quartile analysis appear in Table 4. The results demonstrate the combined effect of return and volatility. This can be seen by running down the diagonal from the upper left to the lower right. At low levels, such as in the first return quartile, volatility did not increase the percent NPV of the HIFO benefit. Instead, it appears to have an offsetting effect. In contrast, at higher return quartiles, volatility had a positive, albeit small, effect.

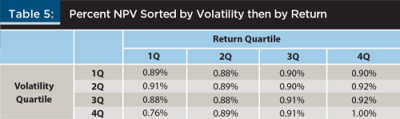
Table 5 provides another view of the relationship by sorting first by volatility, then by return. Once again, the diagonal suggests a compounding of the relationship where both high return and high volatility lead to a higher HIFO benefit. At low volatility, returns appear to have a negligible impact, yet at higher volatility quartiles—especially in the highest volatility quartile—the effect of return was pronounced.
The economic implications of the analysis seem to be that both return and volatility have an impact on the HIFO benefit. Despite being statistically significant, the economic benefit appears relatively small, with differences between quartile portfolios generally being within 0.10 percent and at most approximately 0.25 percent. For example, on a $1 million portfolio at retirement, the maximum difference would be approximately $3,000 when comparing low and high volatility portfolios. Nonetheless, investors considering using a HIFO strategy will tend to see the largest impacts when the HIFO strategy is employed on assets that have both high return and high volatility.
Monte Carlo simulations were used to gain a better insight into the effect of volatility on the HIFO benefit. Monte Carlo simulation results not only help determine the effects of volatility on the HIFO benefit but also provide insight as to the likely benefit for differing types of investments. For example, assume an investor chooses an individual stock rather than an index. It is possible, if the stock is typical, that the average return of the stock may be similar to that of the index. However, because the stock has more risk (i.e., higher standard deviation) than the diversified index, the stock should have greater HIFO benefits. To put it more technically, the idiosyncratic risk of the stock may actually provide some tax benefits through HIFO accounting.
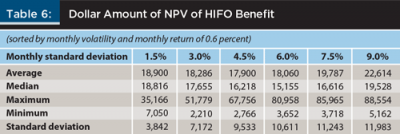
As a base case, a normal distribution for monthly returns with a mean of 0.6 percent and a standard deviation of 4.5 percent was assumed. Note that these parameters were similar to the historical data series in the bootstrapping simulation. Furthermore, simulations were run with the standard deviation of monthly returns as 1.5 percent, 3.0 percent, 4.5 percent, 6.0 percent, 7.5 percent, and 9.0 percent.
The results for the dollar value of the HIFO benefit appear in Table 6. As indicated in the table, the relationship between standard deviation and the dollar value of the HIFO benefit was not linear. As volatility increased, the average benefit dropped but then increased. At a 9 percent standard deviation, the average HIFO benefit was more than $22,000. It reached a maximum of more than $88,000 over the 10,000 simulations. The standard deviation of the HIFO benefit was also positively related to the volatility assumed in the simulation.
The results from the simulation of the HIFO benefit as a percentage of wealth on volatility appear in Table 7. The relationship between standard deviation and the HIFO benefit as a percentage of wealth was basically flat at lower volatilities. It increased substantially as the standard deviation increased beyond 4.5 percent. At the highest standard deviation of 9.0 percent, the HIFO benefit added more than 2.7 percent to total wealth, which was approximately triple of the base case standard deviation of 4.5 percent and what was indicated in the bootstrapping simulation.
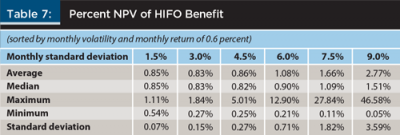
Somewhat different than the bootstrapping results, these findings imply a significant economic benefit from HIFO accounting, especially for highly volatile investments that also have high returns. If investments are made in a taxable account, volatility can play a significant role in increasing terminal wealth. HIFO accounting, therefore, appears to provide a better economic impact for an investor who employs the technique when investing in individual stocks as opposed to a diversified fund, because the fund may have a similar return but a smaller standard deviation.
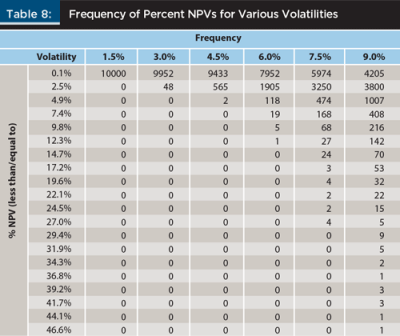
Frequency distributions for the HIFO benefit under the various scenarios was also examined. As shown in Table 8, the distributions had a pronounced skew effect because the HIFO benefit had a substantial upside benefit and that was bounded at zero on the left tail. Once again, as in the bootstrapping simulation, the results show that the HIFO benefit had no real NPV downside. Investors, therefore, should, whenever possible, invoke the HIFO strategy because there appears to be no risk to using it unless the cost of implementation is significant. Given that brokerage accounts generally track investments for individuals, the cost would tend to be low. As such, investors would be best served by using HIFO as opposed to average cost.
Conclusion
This study provides evidence that the benefit of HIFO accounting generally increases as volatility increases, although returns also influence results. A bootstrapping simulation showed that highly volatile assets yield advantages using HIFO accounting when those assets also exhibit high returns. The Monte Carlo simulation demonstrated that above-average volatility does indeed increase the HIFO benefit. In this study, the result was even more significant at very high standard deviations of returns. Thus, investors willing to use HIFO accounting are rewarded with the benefit of increased wealth in all scenarios. Investors may have additional tax benefits when investing in assets of very high risk. Put another way, investors using an average cost basis for share accounting are reducing their after-tax wealth, especially when average cost is used for assets with high risk and return performance.
According to the simulations, the HIFO technique increases wealth, on average, by about 1 percent; however, the benefit was highly varied. Volatility has a statistically and economically significant impact on accounts using HIFO accounting. When the benefit was defined as a dollar amount, these simulations suggest volatility does not monotonically increase wealth. This might be because of the dual effects of volatility. Volatility may directly increase the range of bases but it can also diminish returns due to compounding. As returns diminish, so do the dollar benefits of HIFO accounting.
However, when return was controlled for, and the HIFO benefit was defined as a percentage of ending wealth, the benefit from the technique was clearer; namely, increasing volatility increased the payoff from optimal share cost basis accounting at above-average levels of volatility. At high volatilities, such as those associated with individual securities, HIFO may add, on average, almost 3 percent to wealth in a realistic retirement planning scenario. Investors using high-volatility securities in taxable accounts can take some solace in that the volatility does have a payoff in terms of tax benefits.
Although this study introduces the notion of how more volatile investments affect the HIFO benefit, it leaves several opportunities for future research. Clearly, HIFO is a more complex accounting system than a simple average cost approach. The costs of implementing HIFO must be weighed against the benefits described here. For larger portfolios, the additional benefit of 1 percent would likely outweigh costs. For smaller portfolios, the evidence presented here can help investors and their advisers understand what benefits are likely in conducting their own cost/benefit analysis.
Additionally, this study simplified the analysis by assuming all returns were in the form of capital gains and taxed at a rate that was uniform across time. Extensions to this work could include an analysis of how reinvestment of dividends would impact both the HIFO benefit and the cost of using a HIFO system of accounting.
Finally, research relaxing the simplified HIFO assumptions would be beneficial. For example, a more complicated share tracking structure, such as specific identification, might increase the benefit if tax rates change during a period in which an investor liquidates shares.
Endnotes
- Volatility and risk are not necessarily synonymous from a portfolio perspective. If the volatility of an investment is not due to systematic factors, it may not be priced into the asset. In other words, it is possible for investments to have similar rates of return even if one has significant more volatility.
- The term “satisfice” was introduced by Herbert Simon in his 1956 Psychological Review article, “Rational Choice and the Structure of the Environment,” as a combination of “satisfy” and “suffice” to explain decision making. It is now used regularly in the field of behavioral finance to describe individuals who are limited by resources or cognitive ability and cannot arrive at a theoretically optimal decision. For example, investors may choose alternatives they view as “good enough” when making real-world financial decisions.
References
Arnott, Robert D., Andrew Berkin, and Jia Ye. 2001. “The Management and Mismanagement of Taxable Assets.” Journal of Investing 10 (1): 15–21.
Atra, Robert J. and Thomas L. Mann. 2001. “Dollar-Cost Averaging and Seasonality: Some International Evidence.” Journal of Financial Planning 14 (7): 98–105.
Atra, Robert J., and Thomas L Mann, 2011. “Can Taxes Save Dollar-Cost Averaging?” Journal of Financial Planning 24 (6): 52–59.
Atra, Robert J., and Yuntaek Pae, 2014. “Likely Benefits from HIFO Accounting.” Journal of Financial Planning 27 (1): 54–60.
Benz, Christine, (2012). “Beware the Default Method for Cost-Basis Elections.” Improving Your Finances Blog at Morningstar.com.
Berkin, Andrew, and Jia Ye. 2003. “Tax Management, Loss Harvesting, and HIFO Accounting.” Financial Analysts Journal 59 (4): 91–102.
Dickson, Joel M., and John B. Shoven, 1993. “Ranking Mutual Funds on an After-Tax Basis.” National Bureau of Economic Research working paper 4393.
Horan, Stephen M. 2003. “Choosing between Tax-Advantaged Savings Accounts: A Reconciliation of Standardized Pretax and After-Tax Frameworks.” Financial Services Review 12 (4): 339–357.
Horan, Steven M., and David Adler. 2009. “Tax-Aware Investment Management Practice.” Journal of Wealth Management 12 (2): 71–88.
Horan, Stephen M., and Jeffrey H. Peterson. 2001. “A Reexamination of Tax-Deductible IRAs, Roth IRAs, and 401(k) Investments.” Financial Services Review 10 (1): 87–100.
Jeffrey, Robert H., and Robert Arnott. 1993. “Was Your Alpha Big Enough to Cover Its Taxes?” Journal of Portfolio Management 19 (3): 15–25.
Citation
Atra, Robert, and Yuntaek Pae. 2015. “Volatility and HIFO Accounting.” Journal of Financial Planning 28 (8): 50–57.